Statistical Analysis of Forms of Phosphorus in
Aquatic Sediments -Case of the Main Rivers in
the area of Meknes (Morocco)-
Hind Omari 1, Adil Lammini 1, Ali Dehbi 1, Abdelaziz Abdallaoui 2*
PhD Student, Analytical Chemistry and Environment Team, Department of Chemistry, Faculty of Sciences, Moulay
Ismail University, Meknes, Morocco 1
Professor, Analytical Chemistry and Environment Team, Department of Chemistry, Faculty of Sciences, Moulay Ismail
University, Meknes, Morocco 2
ABSTRACT: For a contribution to the study of the water quality of the Meknes region, we realized samples of surficial sediments at the level of the main wadis of this region in four different seasons.
The results of the study of different phosphorus fractions of studied sediments have been the subject of a principal component analysis (PCA). This statistical method allowed us to identify the principal relationships between forms of phosphorus and showed that the increase in total phosphorus content (Ptot) of the studied sediments is primarily caused
by increased levels of inorganic forms of phosphorus {Fe (OOH)-P} and CaCO3-P}.
Furthermore, for having the relationship between the sampling periods, sampling stations and forms of phosphorus, we performed a factorial correspondence analysis (FCA), as well as the hierarchical ascendant analysis (HAC), which helped to classify the individuals with similar behaviour in three different classes.
Indeed, the factorial correspondence analysis is a method that can be combined to the HAC because they use the same distance between individuals. The FCA has not only allows to classify individuals but has allows us also the identification of the homogeneous groups. The HAC using the same distance as that the FCA allows us to clarify the contours of homogeneous classes.
KEYWORDS: Sediment, Forms of phosphorus, Statistical analysis, PCA, FCA, HAC. I. INTRODUCTION
The city of Meknes is situated in the northern part of Morocco; it is the second city of the plain Sais after the city of Fez. It is one of the most important agriculture regions of the Kingdom and is home every year since 2006, “The International Agriculture Show in Morocco”. The intensification of industrial and agricultural activities as well as the rapid increase in the population of this city, leads to serious problems in the natural environment [1], and generate pollutants such as phosphorus that can affect the physicochemical and biological quality from the aquatic environment.
Furthermore, the sediment has the ability to store phosphorus in abundance in different forms. This sediment load can be put into solution under specific physicochemical conditions such as pH and redox potential which affect the mobility of phosphorus [2]. That sometimes poses serious problems with regard the waters quality of these rivers.
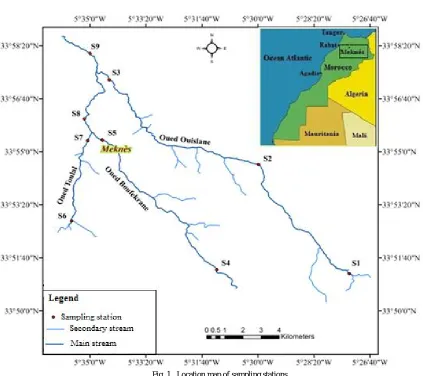
II. MATERIALANDMETHODS II.1Study sites
This study was done on three rivers of Meknes region, Oued Boufekrane, Oued Ouislane and Oued Toulal. The first two streams have attracted the interest of many researchers [3] [4].
The Oued Boufekrane is a permanent watercourse of the Middle Atlas; it rises to the west of El Hajeb, in the Middle-Atlas, 750 meters above the sea level [5]: Ain Maârouf which flows in the agricultural plain of the plateau of Meknes and passes through the town of Boufekrane to which it owns its name to 10 km from the source. 34 km downstream the wadi crosses the valley separating the old town and the new town of the city of Meknes. At its middle course, it receives domestic and industrial discharges not treated in the city of Meknes [6].
Oued Boufekrane joined the two other streams to form Oued R’dom, first Oued Toulal which crosses the commune of Toulal, then Oued Ouislane which belongs to the superficial hydrographic network of the region of Meknes, starting from the south-east of the village of Boufekrane.
II.2Sampling
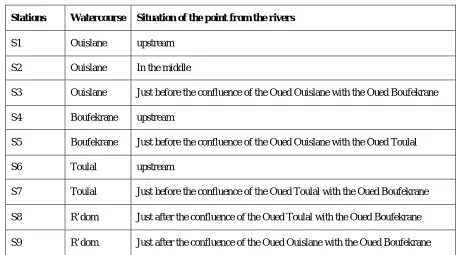
Sediment samples were collected during four different seasons (Autumn, Winter, Spring and Summer) at nine stations, upstream, downstream, and at the confluences of three wadis (36 samples) (Table 1).
Table. 1 Location of sampling stations
Stations Watercourse Situation of the point from the rivers
S1 Ouislane upstream
S2 Ouislane In the middle
S3 Ouislane Just before the confluence of the Oued Ouislane with the Oued Boufekrane
S4 Boufekrane upstream
S5 Boufekrane Just before the confluence of the Oued Ouislane with the Oued Toulal
S6 Toulal upstream
S7 Toulal Just before the confluence of the Oued Toulal with the Oued Boufekrane
S8 R’dom Just after the confluence of the Oued Toulal with the Oued Boufekrane
S9 R’dom Just after the confluence of the Oued Ouislane with the Oued Boufekrane
Fig. 1 Location map of sampling stations
Phosphorus is often present in sediments in organic form (Porg) and inorganic form (Pinorg). The inorganic fractions
constituted of complexes of phosphorus with iron or calcium [7].
The different fractions of phosphorus in the studied sediments were determined following the scheme of splitting of Golterman [8], which was chosen because it uses specific chelators designed to extract the mineral phosphorus without disrupting organic phosphorus by adjusting the pH of the extractant solutions to the sediment [9]. This scheme allowed us to sequentially extract the phosphorus in several forms:
Fe (OOH)-P: Phosphorus bound to iron,
CaCO3-P: Phosphorus bound to calcium,
ASOP: Organic phosphorus soluble in acid,
ROP: Residual organic phosphorus,
Pinorg: Inorganic phosphorus: {Fe (OOH)-P + CaCO3-P},
Porg: Organic phosphorus: {POSA + POR},
Ptot: Total phosphorus.
The application of this method of statistical analysis in the field of environmental study was the subject of many studies [10] [11] [12] [13]. This method of statistical processing allows regrouping of heterogeneous data (different units) in a simple graphical representation.
To perform this analysis, the raw data have been introduced into a double-entry matrix: observations x variables (samples x analytical data). This matrix is considered such as a data table centered and reduced, which is processed by principal component analysis to determine its factorial axes. The scatter of points corresponding to the matrix is then projected on a plane defined by two main axes. This graphic representation serves as a support to the interpretation of the results.
After establishing important correlations between the different forms of phosphorus, we have sought to highlight the relationship between the sampling periods, sampling stations, as well as forms of phosphorus, for this we conducted the factorial correspondence analysis (FCA), complemented by hierarchical ascendant classification (HAC) [14].
The complementarities of these two methods is the fact that the FCA introduces the elements studied as a continuous space and allows characterize the homogeneous groups, while the HAC made clear divisions or partitions between these same elements specifying the contours.
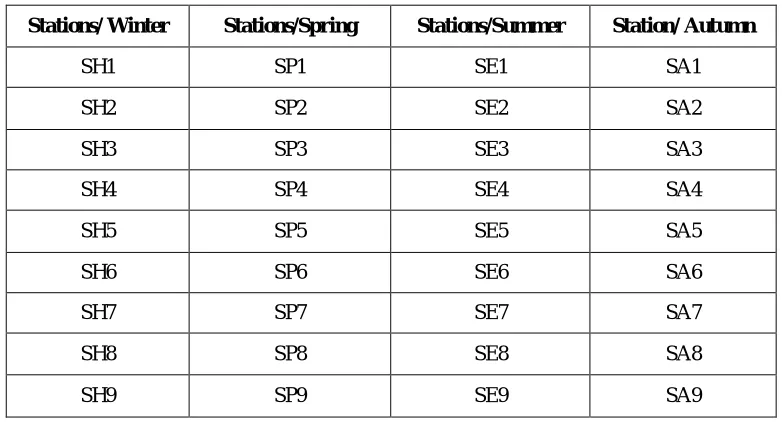
Table 2 summarizes the symbols used in this study associated with each sampling station during the four seasons (Winter, Spring, Summer, and Autumn).
Table. 2 Symbols of sediment sampling stations studied during the four seasons
Stations/ Winter Stations/Spring Stations/Summer Station/ Autumn
SH1 SP1 SE1 SA1
SH2 SP2 SE2 SA2
SH3 SP3 SE3 SA3
SH4 SP4 SE4 SA4
SH5 SP5 SE5 SA5
SH6 SP6 SE6 SA6
SH7 SP7 SE7 SA7
SH8 SP8 SE8 SA8
SH9 SP9 SE9 SA9
III.RESULTSANDDISCUSSION
The principal components analysis which allows the description of the data contained in a table of individuals /quantitative variables (observation/forms of phosphorus), is the basic method of data statistical analysis. This technique allows study the forms of phosphorus in terms of correlation. Its main advantage lies in its ability to analyse simultaneously a large database. It also allows determining the interrelations between forms of phosphorus, by reducing in a small number of principal components also called indicators or factors.
Note also that forms of Pinorg and Porg were used in the principal component analysis as additional variables, given the
first was estimated by adding Fe (OOH)-P and CaCO3-P, and the second was estimated by summing the forms ASOP
and ROP. Table 3 includes the values and variances of the first four components of the principal component analysis (F1, F2, F3 and F4) with respect to the total variance, as well as their cumulative percentage.
Table. 3 Percentage of inertia explained by the first four axes of the PCA
F1 F2 F3 F4 Values 3.24 1.28 0.36 0.10
% variance 64.75 25.62 7.10 1.97
% cumulative 64.75 90.37 97.46 99.44
From this table we note that the first two components F1 and F2 respectively explain 64.75 % and 25.62 % of inertia.
The other factorial axes (F3, F4...) have a small contribution compared to the total inertia and will therefore not be
considered in interpretations.
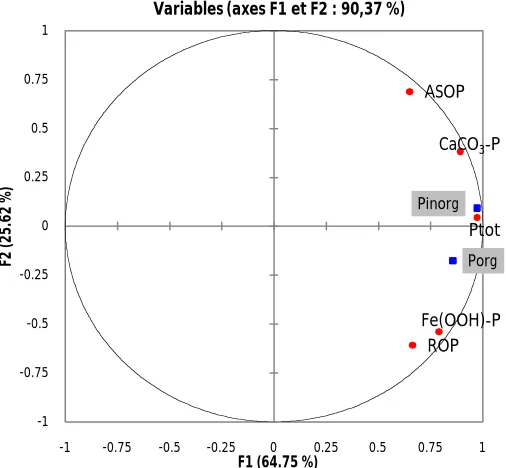
Figure 2 presents the projection of phosphorus forms of sediments on the plane formed by the axes F1 and F2. This
factorial explains almost 90 % of the total variance and shows clearly the important objective of principal components analysis which is the determination of a reduced dimensional space, and obtaining a more relevant summary possible of initial data [15].
Fig. 2 Circle of correlation of the principal component analysis of forms of phosphorus of studied sediments
Table 4 represents the matrix of correlations between forms of phosphorus. We find that the majority of the correlation coefficients r values are above the critical value (Rc= 0.33), which is given by the usual tables found in the books
specialized in the analysis of data and statistics (Saporta 1990). R values depend on the number of individuals n and
Fe(OOH)-P
CaCO3-P
ASOP
ROP Ptot
Porg Pinorg
-1 -0.75 -0.5 -0.25 0 0.25 0.5 0.75 1
-1 -0.75 -0.5 -0.25 0 0.25 0.5 0.75 1
F2
(
2
5
.6
2
%
)
F1 (64.75 %)
Table. 4 Correlation matrix between phosphorus forms in studied sediments
Variables Fe(OOH)-P CaCO3-P ASOP ROP Ptot Porg Pinorg
Fe(OOH)-P 1
CaCO3-P 0.50 1
ASOP 0.11 0.78 1
ROP 0.74 0.33 0.12 1
Ptot 0.78 0.90 0.61 0.54 1
Porg 0.67 0.64 0.57 0.88 0.74 1
Pinorg 0.75 0.95 0.64 0.53 0.97 0.74 1
At first, it seems that in sediments of the studied wadis, an increase in the levels of total phosphorus (Ptot) is mainly
caused by increased levels of forms inorganic phosphorus {Fe (OOH)-P and CaCO3-P}. This result is confirmed if we
consult the correlation matrix (table 4). Indeed, total phosphorus correlates more significantly with the phosphorus bound to iron (0.78), and with the phosphorus bound to calcium (0.90), more than the organic phosphorus : ASOP (0.61) et ROP (0.54).
Furthermore, the residual organic phosphorus (ROP) significantly correlates with the axis F1, which shows that these
two variables (ROP and Porg) correlate with each other in our sediments, with a correlation coefficient of the order of
0.88. While the organic phosphorus soluble in acid (ASOP) and the residual organic phosphorus (ROP), don’t seem correlated (0.12).
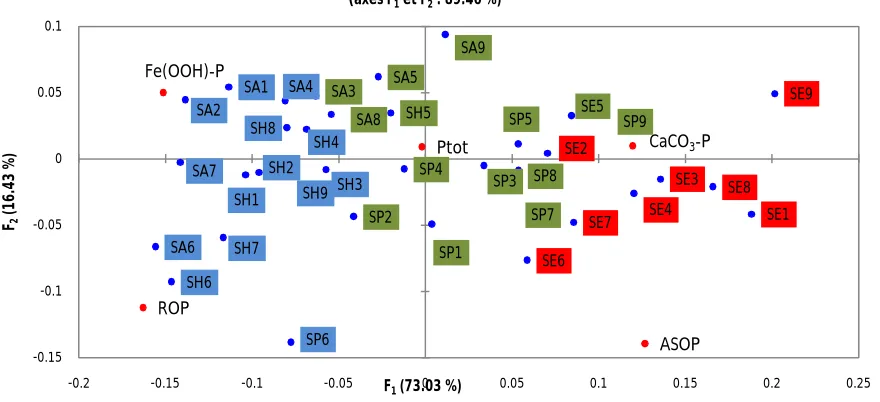
The results of the correspondence analysis and hierarchical ascendant classification are shown in figures 3 and 4. Figure 3 shows the plane formed by the factorial axes F1 and F2. The axis F1 explains 73.03% of the variance and the
axis F2 explains 16.43%, for both axes 89.46% of the total inertia.
Fig. 3 Representation of the three groups of individuals in the first factorial, colored differently according to their class of membership. Class 1 in blue, class 2 in green and class 3 in red
Fe(OOH)-P
CaCO3-P
ASOP ROP Ptot SA1 SA2 SA3 SA4 SA5 SA6 SA7 SA8 SA9 SP1 SP2 SP3 SP4 SP5 SP6 SP7 SP8 SP9 SE1 SE2 SE3 SE4 SE5 SE6 SE7 SE8 SE9 SH1 SH2 SH3 SH4 SH5 SH6 SH7 SH8 SH9 -0.15 -0.1 -0.05 0 0.05 0.1
-0.2 -0.15 -0.1 -0.05 0 0.05 0.1 0.15 0.2 0.25
F2 (1 6 .4 3 % )
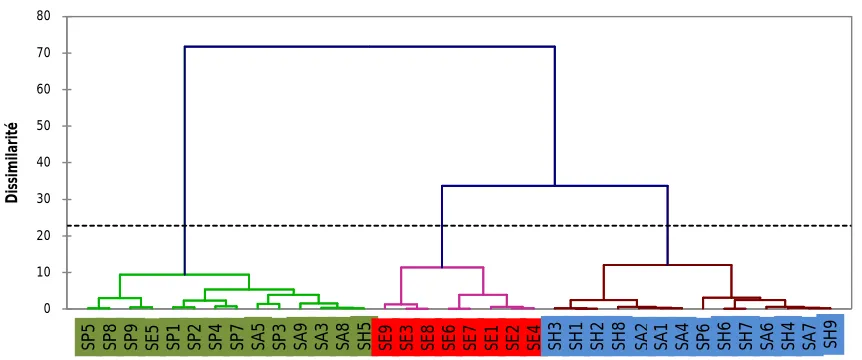
Figure 4 shows the Hierarchical tree obtained by the Hierarchical Ascendant Classification, the main of this analysis is to represent homogeneous classes that represent similar values in all the variables analysed, where class 1 shown in blue, class 2 in green, and class 3 in red.
Fig. 4 Hierarchical tree obtained by the HAC. Class 1 in blue, class 2 in green, and class 3 in red
The application of these two complementary statistical techniques has identified three classes:
Class 1: Presented by sediments collected in autumn at the stations located upstream, and sediments collected in winter;
Class 2: Includes sediments collected in autumn at stations located downstream, and sediments where samples are taken in the spring;
Class 3: Presented by sediment collected in summer.
Indeed, we can interpret the high concentrations of CaCO3-P in spring and summer period, by the high values of pH in
water column caused by photosynthetic activity which is responsible for the decrease of CO2 in water, which decreases
the adsorption capacity of phosphorus at the level of iron oxides by increasing competition between the hydroxide ion (OH-) and phosphate [16] [17]. However, an increase in pH causes adsorption or co-precipitation of phosphorus with carbonates (CaCO3) [18]. Conversely, acidic conditions cause the dissolution of carbonates and thus the release of
phosphorus [19].
Maximum concentrations of Fe (OOH)-P in sediments recorded in autumn can be explained by elevated organic carbon levels, this can be explained by the formation of complex “Organic Matter-iron-phosphate”. This explanation is suggested by several authors [20] [21].
Furthermore, a temperature rise in the surface sediment level is notably responsible for an increase in bacterial activity and mineralization of organic matter. In summer, the increased microbial activity causes a reduction of the redox potential in the sediment surface that can be responsible for a reduction of ferric ion into ferrous ion and phosphate release in the pore water [22] [23]. The result is a decrease in Fe (OOH) and Fe (OOH)-P in the sediment
IV.CONCLUSION
In this study, we realized a study on the correlation between the different forms of phosphorus in sediments studied by the application of the principal component analysis. Eigen value analysis allows us to retrain the first two axes; these
The application of principal component analysis to our database of the phosphorus forms showed that the increase in total phosphorus (Ptot) is mainly caused by increased levels of inorganic phosphorus forms {Fe(OOH)-P et CaCO3-P},
with correlation coefficients respectively of the order of 0.78 et 0.90.
The combined application of a factorial method (factorial correspondence analysis, FCA) and hierarchical ascendant classification method, HAC), allowed us to identify three classes divided into the sampling stations as well as the periods of sampling. It also showed that the studied sediments are in spring and summer periods, richer in form CaCO3
-P by cons into autumn period, these sediments are richer in Fe (OOH)--P.
REFERENCES
[1] McKinney, M.L., “Urbanization, Biodiversity, and Conservation”, Bioscience, Vol. 52, pp. 883–890, 2002.
[2] Gomez, E., Durillon, C., Rofes, G., and Picot, B., “Phosphate adsorption and release from sediments of brackish lagoons: pH, O2 and loading
influence”, Water Research, Vol. 33, pp. 2437–2447, 1999.
[3] Chahlaoui, A., “Etude hydro-biologique de l’oued Boufkrane (Meknès), Impact sur l'environnement et la santé”, Thèse d’état, Université Moulay Ismail, Faculté desSciences- Meknès, 234 p, 1996.
[4] Larif, M., Soulymani, A., et Elmidaoui, A., “Contamination spatio-temporelle d’origine hydrique de l’Oued Boufekrane dans la région de Meknès-Tafilalet (Maroc) ”, International Journal of Biological and Chemical Sciences, Vol. 7, pp. 172-184, 2013.
[5] Saadallah, M., “Contribution à l’étude de la pollution métallique des sédiments des cours d'eau marocains-cas del'oued Boufkrane”, Thèse de 3ème cycle, Université MoulayIsmail, Faculté des Sciences Meknès, 181 p, 1991.
[6] Hammada, S., Dakki, M., Fekhaoui, M., et EL Agbani, M.A., “Typologie spatio-temporelle et valeurs bioindicatrices des algues benthiques de l’Oued Boufkrane (Maroc) ”, Bulletin de l’Institiut Scientifique, Vol. 20, pp. 155–162, 1996.
[7] Williams, J.D.H., Jaquet, J.M., and Thomas, R.L., “Forms of Phosphorus in the Surficial Sediments of Lake Erie”, Journal of the Fisheries Research Board of Canada, Vol. 33, pp. 413–429, 1976.
[8] Golterman, H.L., “Fractionation of sediment phosphate with chelating compounds: a simplification and comparison with other methods”, Hydrobiologia, Vol. 335, pp. 87–95, 1996.
[9] Taoufik, M., Kemmou, S., Idrissi, L.L., et Dafir, J,E., “Comparaison de deux méthodes de spéciation du phosphore dans des sédiments de la partie aval du basin Oum Rabiaa ( Maroc )”, Water Quality Research, Vol. 39, pp. 50–56, 2004.
[10] Zerki, N., Bouhaouss, A., and Bchitou, R., “Modeling and optimization the effect of some anions on the water conductivity”, Australian Journal of Basic and Applied Sciences, Vol. 6, pp. 396-402, 2012.
[11] Chaouki, I., Mouhir, L., Fekhaoui, M., El Abidi, A., Bellaouchou, A., El Morhit, M., “Application de l’analyse en composantes principales (ACP ) pour l’évaluation de la qualité des eaux usées industriellesde Salam Gaz – Skhirat”, Journal of Materials and Environmental Science, Vol. 6, pp. 455–464, 2015.
[12] Lakhili, F., Benabdelhadi, M., Lahrach, H., Lahrach, A., “Etude de la qualité physicochimique et de la contamination métallique des eaux de surface du basin versant de Beht (Maroc) ”, European Scientific Journal, Vol. 11, pp. 132-147, 2015.
[13] Laghzal, A., Salmoun, F., Boudinar, B., Khaddar, M., Cherroud, S., Fihri, M., Mammad, C., “Evaluation of physic-chemical and bacteriological quality of water springs by using a principal component analysis (PCA): A case study of Tingitane Peninsula (Morocco)”, Journal of Materials Environmental Science, Vol. 7, pp. 456-462, 2016.
[14] Benzécri J.P & coll., Pratique de l’Analyse des données, Tome 3, Linguistique & Lexicologie, Paris, Dunod, 234 p. 1981.
[15] Baccini, A., Statistique Descriptive ultidimensionnelle (version de mai 2010), Publication de l’Institut de Mathématiques de Toulouse, Université Paul Sabatier, Toulouse, France, 2010.
[16] Sondergaard, M., Jensen, J.P., and Jeppesen, E., “Retention and Internal Loading of Phosphorus in Shallow, Eutrophic Lakes”, The Scientific World Journal,Vol1, pp. 427–442, 2001.
[17] Rydin, E., “Potentially mobile phosphorus in Lake Erken sediment”, Water Research, Vol. 34, pp. 2037–2042. 2000.
[18] Neal, C., “The potential for phosphorus pollution remediation by calcite precipitation in UK freshwaters”, Hydrology and Earth System Sciences, Vol.5,pp. 119–131, 2001.
[19] Penn, M.R., Auer, M.T., Doerr, S.M., Driscoll, C.T., Brooks, C.M., and Effler, S.W., “Seasonality in phosphorus release rates from the sediments of a hypereutrophic lake under a matrix of pH and redox conditions”, Canadian Journal ofFisheries and Aquatic Sciences, Vol. 57, pp. 1033–1041, 2000.
[20] Suzuki, Y., Kuma, K., Kudo, I., Hasebe, K., and Matsunaga, K., “Existence of stable Fe(II) complex in oxic river water and its determination”, Water Research, Vol. 26, pp. 1421–1424, 1992.
[21] Selig, U., and Schlungbaum, G., “Longitudinal patterns of phosphorus and phosphorus binding in sediment of a lowland lake-river system”, Hydrobiologia, Vol. 472, pp. 67–76, 2002.
[22] Kamp-nielsen, L., “A kinetic approach to the aerobic sediment- Water exchange of phosphorus in lake Esrom”, Ecological Modelling, Vol. 1, pp.153–160, 1975.