Aeroelastic Behaviour of a Long Span
Cable Stayed Bridge
Dr.K.V.Ramana Reddy
1, Vanisri Gunnala
2, M.Padmaja
3Department of Civil Engineering, Mahatma Gandhi Institute of Technology, Hyderabad, India1
Department of Civil Engineering, Geethanjali College of Engineering & Technology, Hyderabad, India2
Department of Civil Engineering, Mahatma Gandhi Institute of Technology, Hyderabad, India3
ABSTRACT: Aerodynamic stability of a proposed Cable Stayed Prestressed Concrete Bridge of span 480 m under wind loads have been studied. Flutter and buffeting responses due to wind loads was investigated on a sectional mode to the scale of 1:200. The model was tested in a wind tunnel for two values of structural damping (0.03 and 0.06) in both torsional and vertical motions with different combinations of live loads at the ratio of frequencies of torsional and vertical oscillations is equals to 1.2. The model exhibited coupled vertical and torsional oscillations in wind. In addition, another uncoupled mode in the form of rolling oscillation about the longitudinal axis of the tunnel was also consistently observed. This type of oscillation has not been reported in the literature and is believed to be due to the overtone flexural oscillation of the main span of the bridge. After trying out several curative measures, it was found that provision of small holes in the bottom of the deck, controlled the vertical and rolling oscillations. The test results were compared with the theoretical (design) values and conclusions drawn for predicting flutter and buffeting responses due to wind loads.
KEYWORDS:Flutter, Buffering responses, Structural damping, Overtone flexural oscillation.
I. INTRODUCTION
Of the several bridges existing all over the world, built of different material or techniques developed, cable stayed bridges stand out as the most recent technological development. Stromsund Bridge was the first cable stayed highway bridge constructed in Sweden in 1955 with a central span of 183 m. Subsequently, a number of cable stayed bridges were constructed world over in many countries. Cable stayed bridges are considered to be the most suitable system for the medium long spans in the range of 100 m to 300 m. However, there has been a continuous endeavor to this span limitation. Tatara bridge (Japan) with a world record span of 890 m opened up the vision for researchers to study the adoption of cable stayed systems with spans exceeding 1000 m which has been hitherto suspension system. In India too, after the completion of Vidyasagar Sethu Bridge (also known as Second Hooghly Bridge) at Calcutta, which was the world’s longest (457.2 m) cable stayed bridge until 1992, cable stayed system found an appropriate place with wider adoption in the years to follow.
II. LITERATURE REVIEW
Aerodynamic response of a bridge is affected by means of wind direction as well as turbulence. Bridge buffeting in angled wind was investigated by Tanaka et al (1993) and Jones et al (1992) and vortex excited oscillation on 2D and 3D models of rectangular section were investigated by Zan et al (1993). In the last decade, Several investigations [e.g; Miyata et al (1994), Chen (1994), Tanaka et al (1993), Namini et al (1992), Jones and Scanlan (1991), Bucher and Lin (1988,1989) and Lin and Yang (1983)] identified the problems of multimode response of long span cable bridges to wind excitation. Analysis of flutter and buffeting can be done in two ways using time domain methods of Bucher and Lin(1988,1989), or frequency domain methods of Tanaka et al (1993), Jones and Scanlan (1991), Scanlan and Jones (1990) and Lin and Yang (1983). Studies by Tanaka et al (1993), and Bucher and Lin (1988, 1989) proposed solutions to the multimode flutter and the multimode buffeting problems .Recently, multimode flutter and buffeting analyses were developed by Jain et al, (1996) based on frequency-domain methods and incorporated the theory of Scanlan and Jones (1990), taking into account the fully coupled aeroelastic and aerodynamic response of long span bridges to wind excitation. However, the extent of this coupling was not significant for the span lengths considered.
III. EXPERIMENTAL INVESTIGATIONS
a. Flutter
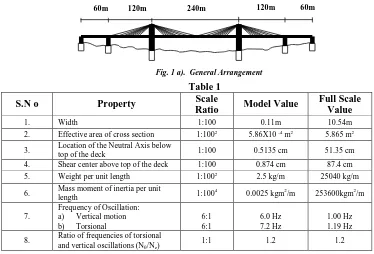
A model was built to a scale of 1:200 representing a 240 m length of the bridge span. Well-seasoned teakwood was used to fabricate the model. Various components of the model, such as the main girder, longitudinal beam, cross beam, deck slab, foot path, handrailing, camber and fillet were all fabricated separately and carefully assembled to get the replica of the prototype as shown in Fig. 1 a & b. Two designs for the hand railings, one with an ornamental design and the other, a plain design fabricated using angle iron, are investigated. The important physical properties and dimensions of the model and were shown in Table. 1.Damping was measured by giving an impulse disturbance to the model and recording the decaying signal to arrive at the logarithmic decrement. Freeman, Fox and Partners (designers of the bridge) had specified a structural damping value (s ) of 0.06 in both bending and torsion and a value close to this was obtained in flexure by adjusting the size of
damper disc. The location of the damper disc on the longitudinal bar was then adjusted to obtain a torsional damping of nearly 0.06. A number of tests were conducted even at this lower value of damping i.e 0.03, as some bridges are known to possess such low values of damping.
Table 1
S.N o Property Scale
Ratio Model Value
Full Scale Value
1. Width 1:100 0.11m 10.54m
2. Effective area of cross section 1:1002 5.86X10 -4 m2 5.865 m2
3. Location of the Neutral Axis below top of the deck 1:100 0.5135 cm 51.35 cm
4. Shear center above top of the deck 1:100 0.874 cm 87.4 cm
5. Weight per unit length 1:1002 2.5 kg/m 25040 kg/m
6. Mass moment of inertia per unit
length 1:100
4 0.0025 kgm2/m 253600kgm2/m
7.
Frequency of Oscillation: a) Vertical motion b) Torsional
6:1 6:1
6.0 Hz 7.2 Hz
1.00 Hz 1.19 Hz
8. Ratio of frequencies of torsional and vertical oscillations (N/Nz)
1:1 1.2 1.2
Fig. 1 a). General Arrangement
120m 240m 120m 60m 60m
Measurements were made for vertical and torsional oscillations with and without live loads for the damping values of 0.06 and 0.03 at positive and negative angles of attack ranging from 0 to 7.5 degrees at intervals of 2.5 degrees. In the present investigation, a distinct single degree of freedom oscillation in the rolling mode has also been consistently observed. In configurations where torsional oscillation occurred, the rolling mode of instability was seen to occur almost immediately. The rolling mode of instability seen in sectional model tests may be described as due to the overtone flexural oscillation of the main span of the bridge.
b. Buffeting
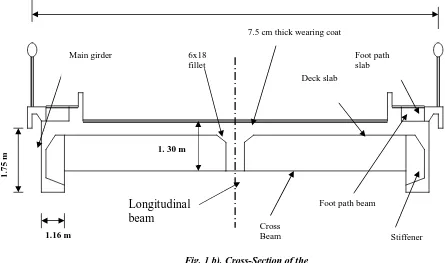
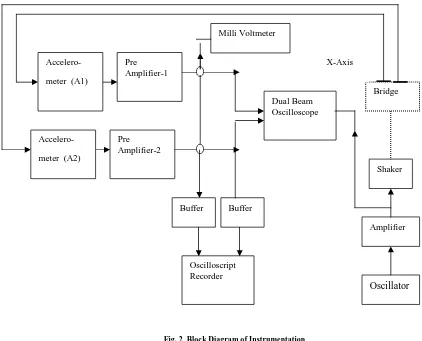
A model to the scale of 1:200 was built of and the properties are similar to the model used for conducting flutter test. The velocity scale was 1:5. The measurements were made of vortex shedding response, buffeting response and torsional instability response as a function of wind speed. The model displacements were measured using Kaman displacement transducers. These were installed at four locations under the deck in pairs, which allowed computation of vertical and torsional deflections. The lateral bending stiffness of this bridge is much greater than the vertical bending stiffness. As a result, the blowback was assumed to be negligible, and the vertical and torsional deflections could then be calculated by taking the sum and difference of the signals from a pair of transducers. Another phase of this experiment investigated the response of the model to 300 angled wind, and measurements were made of the buffeting response and torsional instability 300 angled wind, and measurements were made of the buffeting response and torsional instability response of the full bridge.The block diagram for experimentation is shown in fig.2.
10. 54 m
1.16 m
1.
75
m
Fig. 1 b). Cross-Section of the Bridge
7.5 cm thick wearing coat
Foot path slab Deck slab
Foot path beam
Longitudinal
beam
Cross
Beam Stiffener
6x18 fillet Main girder
IV. RESULTS AND DISCUSSIONS a. Flutter
From the results of wind tunnel tests on the sectional model with various configurations, it is evident that corresponding full-scale values can be obtained by applying appropriate scale factors. With regard to the two flexural modes, the second flexural mode of 1.07 Hz was considered along with the torsional mode of 1.20 Hz to get the lowest ratio of frequencies of torsional and vertical oscillations (N/Nz) for model simulation. However, since the oscillations
of the model were uncoupled, oscillation in each of those modes had to be interpreted independently. The basic model, without any modifications, vibrates with a maximum amplitude of 1.61 mm and with a wind speed of 15.5 m/s, the value of structural dumping in vertical motion (zs) was 0.03 with angle iron hand railing. The central amplitude for the
full-scale bridge turns out to be 64.4 mm. This amplitude in the full-scale structure occurring at a speed of 50 m/s is seen to be fairly large and remedial measures to reduce this amplitude would become inevitable. When the hand-railing is of the ornamental type, the model vibrates with more or less the same amplitude. The speed range for instability is also approximately the same. With the introduction of dashpots, the value of structural dumping in vertical motion (zs)
is raised to 0.06 and the maximum amplitude of the model with angle iron handrailing is brought down by about 40 percent. The vibration of the model with ornamental hand-railing is insignificant by the introduction of dashpots.
It is seen that a positive wind angle leads to slightly increased amplitude of oscillation, the speed range for instability being essentially unaffected. With a negative angle of attack the amplitude is reduced significantly and the speed for the inception of instability is also higher by about 40 percent. Maximum amplitude of 1.97 mm was observed for the model with ornamental handrailing when the truck convoys were moving in the same direction on the leeward side and at 0.25
Dual Beam Oscilloscope
Buffer
Bridge
Accelero-meter (A1)
Pre Amplifier-1
Oscilloscript Recorder
Amplifier
Oscillator
Shaker Milli Voltmeter
Accelero-meter (A2)
Pre Amplifier-2
Buffer
X-Axis
m from the centre. For the angle iron handrailing, the maximum amplitude was 0.82 mm, when the truck convoy was moving in the same direction, very close to the centre, on the windward side. The ranges of wind speed for instability in vertical motion were not affected by the presence of tank or truck as live loads. It is the amplitude of oscillation, which tended to be much more pronounced.
The wind tunnel tests showed that the sectional model of the bridge oscillated in the torsional mode as the wind speed was increased beyond the range for instability in vertical motion. The sectional model with ornamental handrailing showed instability in torsion between wind speeds of 30 m/s to 35 m/s. The maximum amplitude observed was 0.90, when the value of structural damping in torsional motion (s) was 0.03. There was a slight reduction in the amplitude,
the value of structural damping in torsional motion (s) was raised to 0.06. With the introduction of the tank live load
on the model with ornamental handrailing, the torsional amplitudes were pronounced. The maximum amplitude of 1.5o occurred when the tank was on the windward side and 0.5 m from the centre. The smallest amplitude was 0.95o and was realized with the tank on the leeward side and close to the centre. When the handrailing was of the angle iron type, it did not record in any measurable torsion. The maximum amplitude for this case was as small as 0.10 when the tank was located on the windward side at 0.5 m from the centre.
As the wind speed was increased beyond the range of torsional instability, it was found that the model was soon oscillating in the rolling mode. For the bare model with ornamental handrailing, the rolling oscillations started when the wind speed was 30 m/s and continued upto a wind speed of 40 m/s. The maximum rolling amplitude was 0.04o. With the introduction of dashpots, the maximum amplitude for both the types of handrailing was 0.02o. At a positive angle of attack of 10o, the rolling amplitude was 0.04o for the model with ornamental handnrailing and dashpots. With the angle of attack at -10o, the amplitude came down to 0.02o and speed for the onset of instability raised by about 20 percent. It is seen that the maximum amplitude of vertical oscillation is reduced by about 25 percent with this modification on the model with ornamental handrailing. Tests at higher speed on the same configuration showed that there was a significant reduction in the torsional amplitudes also. For the basic model, the maximum torsion was 0.7o and was brought down to 0.1o by covering the bottom. The bridge model with angle iron type of handrailing presented no torsional instabilities. The tests showed that the overall benefits of covering the bottom are marginal.
b. Buffeting
The results obtained from the computer are in terms of model scale values. The wind speeds have been converted to deck level values. The data presented for both vertical and torsional deflections are the mean, root-mean-square (rms) and peak deflections. The peak deflections are defined as the magnitude of the largest excursion from the mean value. The ratio is defined as the absolute value of peak divided by the value of rms. For response due to a torsional instability, the ratio would be 1.4 if the response was sinusoidal, but is usually slightly greater. The torsional buffeting response of the bridge deck as a function of dimensional model wind speed for tests in highly turbulent flow. The prototype wind speeds are five times greater than the model wind speeds.
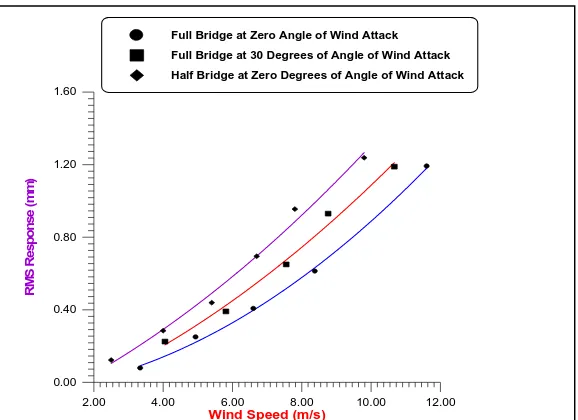
At a wind angle of 300,, the response of the full bridge is decreased and again the normal component of velocity seems to govern the response. This observation may be valid for a bridge with appreciable camber along the span as yawed wind will change the mean angle of attack of the wind. The response of the half-bridge is much larger than the full bridge at a given wind speed because of the decreased frequencies. It is seen that the buffeting response increases significantly during the erection stages.
Damping was measured by giving an impulse disturbance to the model and recording the decaying signal to arrive at the logarithmic decrement. Freeman, Fox and Partners (designers of the bridge) had specified a structural damping value (s ) of 0.06 in both bending and torsion and a value close to this was obtained in flexure by adjusting the size of
may be described as due to the overtone flexural oscillation of the main span of the bridge. A model to the scale of 1:200 was built of and the properties are similar to the model used for conducting flutter test. The velocity scale was 1:5.
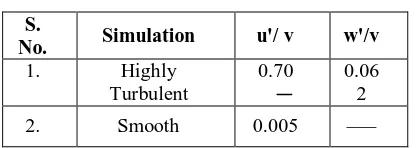
The measurements were made of vortex shedding response, buffeting response and torsional instability response as a function of wind speed. The model displacements were measured using Kaman displacement transducers. These were installed at four locations under the deck in pairs, which allowed computation of vertical and torsional deflections. The lateral bending stiffness of this bridge is much greater than the vertical bending stiffness. As a result, the blowback was assumed to be negligible, and the vertical and torsional deflections could then be calculated by taking the sum and difference of the signals from a pair of transducers. Another phase of this experiment investigated the response of the model to 300 angled wind, and measurements were made of the buffeting response and torsional instability response of the full bridge. The turbulence intensities at deck level were given in Table.2.
Table 2
S.
No. Simulation u'/ v w'/v
1. Highly
Turbulent
0.70 0.06
2
2. Smooth 0.005 ___
The vertical buffeting response of the full and half bridge decks as a function of model wind speed at 0 0 and 30 0 angles of wind attack is shown in Fig.4.
0.00 4.00 8.00 12.00 16.00
Wind Speed (m/s) 0.00
0.10 0.20 0.30 0.40 0.50
R
M
S
R
e
s
p
o
n
s
e
(
D
e
g
re
e
s
)
Full Bridge at Zero Degrees of Angle of Wind Attack
Full Bridge at 30 Degrees of Angle of Wind Attack
Half Bridge at 30 Degrees of Angle of Wind Attack
2.00 4.00 6.00 8.00 10.00 12.00
Wind Speed (m/s) 0.00
0.40 0.80 1.20 1.60
R
M
S
R
e
s
p
o
n
s
e
(
m
m
)
Full Bridge at Zero Angle of Wind Attack Full Bridge at 30 Degrees of Angle of Wind Attack Half Bridge at Zero Degrees of Angle of Wind Attack
Copyright to IJIRSET DOI:10.15680/IJIRSET.2016.0507092 13265
V. CONCLUSIONS
The following conclusions are arrived at from the present study:
1) From the results of the flutter test on the bridge model, it is observed that the model showed oscillation mainly in the bending mode and relatively weaker in the torsional mode. The oscillation tended to belarger at positive wind angles and smaller at negative wind angles, without any significant effect on the critical speed of the wind. 2) The bridge deck is more susceptible to wind excited oscillations of high amplitudes under live loads. It is also
observed that a rolling mode of instability occurs for long span cable stayed bridges. Further, coverage of the bottom of the deck proved to be the most effective modification in increasing the stability of the bridge in bending and rolling.
3) While recording buffeting response of the bridge, it is observed that the torsional instability of a bridge is not affected by moderate turbulence. It is also observed that the component of wind, normal to the deck, governs the torsional instability and buffeting behaviour for the angled wind conditions.
VI. ACKNOWLEDGEMENTS
Support for this research was provided by the National Aerospace Laboratories, Bangalore; Indian Institute of Science, Bangalore; Department of Civil Engineering, Osmania Universitry, Hyderabad and Vasavi College of Engineering, Hyderabad is gratefully acknowledged.
REFERENCES
1. Anurag Jain, Nicholas P. Jones, and Robert H Scanlan., “Coupled Flutter and Buffeting Analysis of Long Span Bridges”, J. Structural Engg., ASCE : 716-723 (July 1996).
2. Zan S.J, Yamada H, and Janaka H ., “The Influence of Turbulence and Deck Section Geometry on the Aeroelastic Behaviour of a Cable-Stayed Bridge model”, National Research Council of Canada, NAE-AN-40 : (August 1986).
3. Tanaka H., Yamamura N, and Shiraishi, N., “Multi-mode Flutter Analysis and Two and Three Dimensional Model Tests on Bridges with Non-Analogous Model Shapes”, J. Struct. Mech. and Earthquake Engg., JSCE, 10(2): 35-46, (1993).
4. Jones N.P,, Jain A, and Scanlan R.H., “Comparison of Wind Cross – Spectral Data with Models”, Proc. Probability Mech. Spec. Conf., ASCE,
New York : (1992).
5. Miyata T, Tada H., Sato H, Katsuchi H, and Hikami Y., “New Findings of Coupled Flutter in Full Model Wind Tunnel Tests on the Akashi Kaikyo Bridge”, Proc. Symp. on Cable-Stayed and Suspension Bridges, Association francaise Pour la Construction, Deauville, France: 163-170 (1994).
6. Chen Z.Q., “The Three Dimensional Analysis of Behaviours Investigation on the Critical Flutter State of Bridges”, Proc. Symp. on Cable
Stayed Bridges, Shanghai, China:10-13 (1994).
7. Namini A, Abrecht P, and Bosch H., “Finite Element-Based Flutter Analysis of Cable-Suspended Bridges”, J. Struct. Engg. ASCE, 118(6) : 1509-1526 (1992).
8. Jones N.P, and Scanlan R.H., “Issues in the Multi-Mode Aeroelastic Analysis of Cable-Stayed Bridges”, Infrastructure’91, Int. Workshop on
Technol. for Hong Kong’s Infrastructure Devel. Commercial Press, Hong Kong : 281-290 (1991).
9. Bucher C.G, and Lin Y.K., “Stochastic Stability of Bridges Considering Coupled Modes”, J. Engg. Mech. Div., ASCE, 114(12) : 2055-2071 (1988).
10. Bucher C.G, and Lin Y.K., “Stochastic Stability of Bridges Considering Coupled Modes”, J. Engg. Mech. Div., ASCE, 115(2) : 384-400 (1989). 11. Lin Y.K, and Yank J.N., “Multi-Mode Bridge Response to Wind Excitation”, J. Eng. Mech. Div., ASCE, 109(2) : (1983).
12. Scanlan R.H, and Jones N.P., “Aeroelastic Analysis of Cable Stayed Bridges”, J. Struct. Engg., ASCE, 116(2) : 270-297, (1990).
13. Jain A, Jones N.P, and Scanlan R.H., “Computed Flutter and Buffeting Analysis of Long-Span Bridges”, J. Struct. Engg., ASCE, 122(7) : 716-725, (1996).
NO T AT IO NS
b: wi d t h of t h e d eck
L: Linear scale (Model: Prototype) l: Length of the model
Copyright to IJIRSET DOI:10.15680/IJIRSET.2016.0507092 13266
s , zs: Structural damping expressed as the natural logarithm of ratio of successive cycles of oscillation (logarithmic
decrement) in torsion and vertical motion respectively
f: Frequency (Hz)
u': Root mean square value of fluctuating component of stream-wise velocity w':Root mean square value of fluctuating component of vertical velocity v: Wind speed
v:Mean wind speed
v crit , vc: Mean wind speed at the onset of torsional instability