ABSTRACT
COUCH, CHARLENE REESE. Microsatellite DNA marker-assisted selective breeding of
striped bass. (Under the direction of Dr. Craig. V. Sullivan).
Although the hybrid striped bass (HSB; female white bass, Morone chrysops x male
striped bass, M. saxatilis) supports the fourth most valuable form of finfish aquaculture in the
United States, neither parental species has been genetically improved. Expansion of the HSB
industry is limited by culture inefficiencies associated with reliance on wild broodstock for
annual fingerling production. Domestication and selective breeding are expected to increase
production efficiency and to promote market expansion. Resource limitations currently
prohibit the individual rearing of multiple larval families for striped bass performance
testing, necessitating a breeding program that is based on communal rearing of progeny
groups with molecular markers as genetic tags for offspring identification. This dissertation
research addresses fundamental questions relevant to selective breeding of the male parental
species of the HSB, the striped bass, including:
(1) Evaluation of genetic variation within a captive striped bass broodstock population;
(2) Examination of the feasibility of communal rearing protocols based on microsatellite
markers for progeny identification during performance evaluations of striped bass;
(3) Assessment of paternal variation in performance traits of striped bass at both research
and commercial scale throughout the HSB production cycle.
genetic diversity, with an average allelic richness of 13.7 alleles per locus and an average
observed heterozygosity of 0.84. Crosses among the three differentiated strains should
provide a valuable starting point for establishing a highly variable base population for
selective breeding.
Twenty-four experimental families were produced from captive, genotyped broodstock
for communal evaluations of progeny survival and performance. Parentage was determined
by microsatellite genotyping at six loci and more than 99% of progeny were attributable to a
single sire-dam pair at each production phase and in all rearing environments. Application of
large-scale communal rearing trials based on microsatellite markers for progeny
identification should be a viable approach in a selective breeding program for striped bass.
There was limited evidence of family effects on early growth or survival to 35 days of
age; however, significant paternal effects on growth performance, body shape, and carcass
traits were detected at later culture stages and variation in antimicrobial peptide activity, a
measure of innate disease resistance, differed by strain within the research ponds. In general,
progeny of domesticated Santee:Chesapeake sires out-performed those of other strains both
at research-scale and in the commercial tank. In research ponds, performance of fish as
yearlings (Phase II) allowed prediction of performance at Phase III (18-20 months of age).
Performance in research ponds also was predictive of Phase III performance in the
commercial tank. Results from performance evaluations provide evidence of genetic
variation in economically important traits which may be exploited for selective breeding of
striped bass.
This research provides fundamental information needed to accelerate selective breeding
MICROSATELLITE DNA MARKER-ASSISTED SELECTIVE BREEDING OF STRIPED BASS
by
CHARLENE REESE COUCH
A dissertation submitted to the Graduate Faculty of North Carolina State University
in partial fulfillment of the requirements for the Degree of
Doctor of Philosophy
ZOOLOGY
Raleigh
2006
APPROVED BY:
____________________________________ ____________________________________ (Ronald G. Hodson) (Trudy F.C. Mackay)
____________________________________ ____________________________________ (Kenneth H. Pollock) (Craig V. Sullivan)
DEDICATION
This work is dedicated to the good people of the United States hybrid striped bass industry
BIOGRAPHY
Charlene Reese Couch was born on June 28, 1967 in Gastonia, NC and raised on a
small farm in Kings Mountain, NC by her parents, Robert and Joyce Ledford. Charlene
graduated from Kings Mountain Senior High School and pursued a Bachelor of Science
degree in Biology at the University of North Carolina-Wilmington where she was first
exposed to scientific research when offered an opportunity to study mammalian
zoogeography on North Carolina’s barrier islands. Shortly after graduation in 1989,
Charlene married Paul Couch and moved to Bethlehem, PA in order for Paul to pursue
seminary education. During this time, she became interested in genetics and returned to
school in 1995 in Richmond, VA, obtaining a Master of Science in Biology in 1998 from
Virginia Commonwealth University with an emphasis in population genetics. After applying
to the graduate program at North Carolina State University, Charlene was offered a position
in Dr. Craig Sullivan’s laboratory in the Department of Zoology where she was able to
integrate her interests in molecular biology and field work by using microsatellite markers to
support development of a striped bass breeding program. After completion of her doctoral
education, Charlene will further her training in quantitative and population genetics through
a postdoctoral position in the laboratory of Dr. Trudy Mackay in the Department of
Genetics. It is Charlene’s hope that the sum of these experiences and training will enable her
to develop a career in which she can use molecular methods to address issues relevant to
ACKNOWLEDGMENTS
Completion of this dissertation research would not have been possible without the
energetic participation and support of many individuals. It has been both an honor and a
pleasure to have worked alongside them.
I would first like to thank Dr. Craig Sullivan for his creativity and support as an
advisor and for his commitment to a thriving hybrid striped bass industry. His vision of
using modern molecular technologies for improvement of striped bass allowed me the
opportunity to exercise my interests in genetics, agriculture and field biology in a novel
project, and I am grateful to him for friendship, guidance and thorough training during the
course of this research. The project would not have been possible without his many long
hours in the hatchery over two spawning seasons. I also greatly appreciate the efforts of the
members of my Graduate Advisory Committee, Dr. Trudy Mackay, Dr. Kenneth Pollock,
and Dr. Ron Hodson, who provided much-needed advice in the planning of this project,
spent a great deal of time assisting with data analysis, and offered valuable insight into the
history and current realities of the hybrid striped bass industry.
The field portion of these studies was largely carried out at the Pamlico Aquaculture
Field Laboratory (PAFL) in Aurora, NC. Many thanks are owed to the staff of PAFL,
including Dr. Andy McGinty, Michael Hopper and Robert Clark for spawning fish, for
teaching me how to grow a striped bass, and for their enthusiastic involvement in the
project. Wade Gereats was tireless in sampling and grading fish, and Blake Martin devoted
out of a very cold pond, for which I am very grateful. Dr. Beth Chiddick cheerfully aided
with striped bass spawning activities in Spring 2000.
The generous support of the hybrid striped bass industry was critical to the success
of this project. In particular, Dr. James Carlberg, President of Kent SeaTech Corporation,
and Dr. Mark Westerman, Director of Molecular Biology at Kent SeaTech, assisted me in
obtaining a Sea Grant Industry Fellowship to support this research. The company not only
provided matching funds for a doctoral fellowship but also dedicated commercial tanks for
rearing striped bass families under intensive production conditions. Kent SeaTech also hired
a professional fish filleter from a seafood processing company in order that we might collect
data on fillet yield from hundreds of striped bass. Dr. Westerman and Jason Stannard
provided training in microsatellite marker enrichment methods, facilitated work at the
Mecca, CA farm, sampled hundreds of fish, and repeatedly served as terrific hosts in San
Diego. Steve Mitchell helped to coordinate Phase III sampling, spent a long three days
gutting fish and provided production data for striped bass. Dr. Vaughn Ostland, John Creek,
Alex Ma, Herñand Nuñez, Kim Nguyen and Greg Swartz all took part in the Phase III
sampling effort. At Keo Fish Farms, Mike Freeze dedicated a commercial fingerling
production pond for rearing striped bass Phase I fingerlings and ensured the success of this
project by producing fingerlings to stock the research ponds and commercial tanks. Both
Mike Freeze and Mike Clark provided assistance in receiving fry from NC and sampling
fingerlings. Keo Fish Farms’ trucks carried fingerling striped bass from Arkansas to
California and North Carolina in May 2001 and then transported broodstock from California
donated feed for Phase II-III pond rearing trials and marketed Phase III striped bass
foodfish.
The members of the Sullivan laboratory were a remarkably supportive community
and I am grateful to them for their kindness and skills. I am especially indebted to Amber
Garber for her friendship and determination. Amber arrived at NCSU during Phase II and
we completed our dissertation research projects at PAFL and in Raleigh as a team. She is
imaginative, fearless and generous, and without her participation this project would not have
been accomplished. Her family, Dr. Gary and Mrs. Tooie Garber and Niki Garber, came to
the rescue when we were shorthanded and helped with Phase III sampling. Dr. Naoshi
Hiramatsu spent many sleepless nights helping Dr. Sullivan to spawn striped bass for this
project (including one memorable 4:00 am pool seining in a cold spring rain for the “right”
genotypes) and, together with Kaori and Yuta Hiramatsu, made the dorm in Aurora a home.
The Hiramatsus were endlessly helpful and cheerful, providing many hours of assistance
with egg and fry counts, fingerling sampling, and laboratory techniques. Alanna Kennedy
and Cynthia Morton also assisted with spawning and sampling activities. Over the course of
the project, I was fortunate to work with many talented undergraduate researchers. In
particular, Blaire Keeling provided enthusiastic assistance with molecular biology laboratory
and field work. Blair, Dominique Donato, Josh Abrams, Rebecca Robbins and Carly
Durham were relentless extractors of DNA, and Kelly Britt, Marnie Broderick, Ben Davis,
Kelly Arey, David Deviney, Matt Haynes, Shonda Moore, Alisha Holzhauser and Heather
Harward also participated in molecular biology work. Paul Worthington and Ben Ricks
At the NCSU Genome Research Laboratory, Dr. Bryon Sosinski and his staff aided
in microsatellite genotyping of striped bass. Regina Ali offered invaluable assistance in
troubleshooting with the automated sequencers and she, Alex Roldan and Heather Aycock
kindly accommodated the unique needs and schedule demanded by this project. Early in the
project, assistance from Dr. Tarek Joubeur and Rita Carvalho in use of the ABI 377 was
very helpful. Dr. Bert Ely, Dr. Kaiping Han and Li Li of East Carolina University assisted
with broodstock genotyping and training on the ABI 377. Evaluation of antimicrobial
peptide activity depended on protocols, laboratory space and a great deal of bench-side
assistance from Dr. Edward Noga and members of his laboratory at the NCSU College of
Veterinary Medicine, including Dr. Heather Callahan and Dr. Umaporn Silphaduong. Also
at the vet school, Dr. Michael Dykstra and Laura Ruth in the Laboratory for Advanced
Electron and Light Optical Methods provided histological sectioning of striped bass gonad
samples.
Several people were persistent in reminding me that there is life outside of the lab.
For their support and unwavering belief in me, I would like to thank my parents, Joyce and
Robert Ledford, and my brother Derek. Vicky McGee has consistently “had my back”
throughout my tenure as a student. My dear friend Amber Stovall is a source of much joy.
She also rolled up her sleeves to help with preparation of the literature citations. Finally,
Paul Couch, whose generosity of spirit and good heart made the difficult parts bearable,
TABLE OF CONTENTS
Page
LIST OF TABLES... xv
LIST OF FIGURES... xx
CHAPTER 1. INTRODUCTION... 1
BACKGROUND AND RATIONALE... 2
ORGANIZATION OF THE THESIS... 13
CHAPTER 2. GENETIC ASSESSMENT OF A CAPTIVE STRIPED BASS (MORONE SAXATILIS) BROODSTOCK... 17
ABSTRACT... 18
INTRODUCTION... 19
MATERIALS AND METHODS... 25
Broodstock Strains... 25
DNA Sampling and Extraction... 26
Microsatellite Genotyping. ... 26
Statistical Analyses... 27
RESULTS... 30
Overall genetic diversity... 30
Genetic diversity by strain... 31
DISCUSSION... 33
Summary... 43
CHAPTER 3. COMMUNAL REARING OF STRIPED BASS LARVAE FOR EVALUATION OF
PHASE IFINGERLING SURVIVAL AND PERFORMANCE... 54
ABSTRACT... 55
INTRODUCTION... 56
METHODS... 66
Broodstock Genotyping. ... 66
Phase I Experimental Crosses. ... 66
Phase I Rearing Trials... 68
DNA Extraction. ... 70
Microsatellite Genotyping... 71
Statistical analyses—... 72
Assignment of parentage. ... 72
Paternal and strain effects on survival ... 73
Proportional contribution by strain and sire. ... 74
Paternal variation in body weight and total length and condition factor... 74
Paternal variation in incidence of deformities. ... 76
Population differentiation ... 76
Mendelian inheritance of microsatellite alleles ... 77
RESULTS... 77
Production of experimental families... 77
Genotyping and parentage assignment. ... 78
Proportional contribution to larval populations... 79
Sire-based phenotypic differences... 80
Dam 2E55 ... 80
Dam 512C... 82
Dam 152D... 82
Dam 5F4B... 83
Population differentiation... 83
DISCUSSION... 85
Efficacy of microsatellite genotyping for communal rearing of striped bass... 85
Survival... 86
Population differentiation... 92
Growth and deformities by sire. ... 94
Application of molecular markers for selective breeding of SB to support the hybrid striped bass industry... 97
ACKNOWLEDGMENTS... 103
CHAPTER 4. COMMUNAL REARING OF STRIPED BASS FOR EVALUATION OF GROWTH PERFORMANCE DURING PHASE IIPRODUCTION... 124
ABSTRACT... 125
INTRODUCTION... 125
METHODS... 130
Broodstock Genotyping... 130
Phase I Experimental Crosses... 131
Population differentiation... 139
Initial Phase II pond population... 139
Final Phase II populations, research ponds... 140
Final Phase II population, commercial tank ... 140
Estimated survival, research ponds... 141
Paternal variation in phenotypic traits... 141
Initial Phase II pond population... 142
Final Phase II population, research ponds ... 142
Final Phase II population, commercial tank ... 143
DISCUSSION... 143
Parentage assignment and conservation of genetic diversity... 144
Proportional contribution and survival... 145
Growth and shape-related phenotypic traits... 146
Recommendations for Phase II rearing trials for the National Breeding Program.... 148
Summary... 152
ACKNOWLEDGMENTS... 152
CHAPTER 5. PHASE IIIPERFORMANCE EVALUATIONS OF COMMUNALLY REARED STRIPED BASS AT RESEARCH AND COMMERCIAL SCALE... 164
ABSTRACT... 165
INTRODUCTION... 166
METHODS... 175
Broodstock Genotyping. ... 175
Production of Fingerlings for Phase III Performance Evaluations... 176
Research ponds ... 177
Commercial tank... 178
Phenotypic trait evaluations... 178
Growth, shape and energy allocation... 178
Antimicrobial peptide activity ... 180
DNA Extraction. ... 182
Microsatellite Genotyping. ... 182
Statistical analyses... 183
Assignment of parentage ... 183
Proportional contribution and survival by sire and strain... 183
Population differentiation. ... 184
Paternal variation in phenotypic traits ... 185
Family 2E55 Phase III research ponds ... 185
Family 2E55 Phase III commercial tank ... 188
12-family group Phase III research pond... 188
RESULTS... 188
Parentage assignment... 188
Population differentiation... 189
Proportional contribution and survival... 189
Proportional contribution, family 2E55 research ponds ... 190
Proportional contribution, 2E55 commercial tank... 190
Proportional contribution, 12-family group, research pond ... 190
Paternal variation in phenotypic traits... 192
Family 2E55 Phase III research ponds. ... 192
Family 2E55 Phase III Commercial tank... 196
Predictive value of Phase II for Phase III. ... 200
12-family Phase III research pond... 200
DISCUSSION... 204
Parentage assignment and communal rearing... 204
Population differentiation... 205
Proportional representation and survival... 206
Phenotypic variation... 207
Growth-related traits... 208
Condition factor... 211
Viscerosomatic index... 211
Fillet percent. ... 212
Antimicrobial peptide activity ... 212
Gonadosomatic index ... 216
Gender differences in performance traits ... 219
Sex ratios ... 221
Predictive value of Phase II for Phase III... 223
Use of research ponds for performance evaluations... 224
Sire-dam interactions... 224
CHAPTER 6. SUMMARY OF DISSERTATION RESEARCH FINDINGS AND RECOMMENDATIONS FOR FUTURE RESEARCH FOR SELECTIVE IMPROVEMENT OF STRIPED BASS... 270
LITERATURE CITED... 289
LIST OF TABLES
Page
CHAPTER 2
Table 1. Origin of sampled striped bass broodstock strains from Pamlico Aquaculture Field
Laboratory... 46
CHAPTER 3
Table 2. Microsatellite loci utilized in broodstock genetic analysis... 47
Table 3. Summary of genetic diversity measures for striped bass broodstock strains by locus
and over all loci. Measures include observed number of alleles (A), allelic richness (AR),
observed (HO) and expected (HE) heterozygosity, and inbreeding coefficient (FIS)... 48
Table 4. F-statistics for three striped bass broodstock populations. ... 49
Table 5. Unique (private) alleles and allele frequencies observed in three striped bass
broodstock strains. ... 50
Table 6. Pairwise genic differentiation among three striped bass strains... 51
Table 7. Genetic differentiation (FST; above diagonal) and genetic distance (1-PSA; below
CHAPTER 4
Table 8. Experimental crosses among striped bass broodstock to generate half-sibling
families. Each dam was mated with six sires, two each from three stocks. Stocks used
included a wild, Roanoke stock (R:F0-97), a domestic Santee:Chesapeake stock (SC:F1-94), a
domestic Chesapeake stock (C:F2-91). The (U) for dam 512C indicates strain of origin was
unknown... 104
Table 9. Polymorphic microsatellite loci utilized for genotyping striped bass for parentage
assignment with locus names, primer sequences, PCR annealing temperatures (TA), allele size
ranges in base pairs (bp), number of alleles observed and sources of loci. ... 105
Table 10. Estimated pond stocking rates, fingerling recovery rates and survival by dam and
pond; SE is the standard error for each estimate... 106
Table 11. Numbers (N) of larvae and fingerlings assigned parentage of those sampled by dam
for genotyping and estimated contribution (proportion) by sire for experimental crosses
among striped bass broodstock. For dams 152D and 5F4B only, fingerlings were sampled
within two size grades (categories <12 or >12) and numbers are reported by grade. ... 107
Table 12. Genotypes at six microsatellite loci for striped bass broodstock used to produce
experimental families. Alleles indicated in boldface type are unique within that group of six
Table 13. Log-likelihood ratio goodness of fit test results for Mendelian inheritance of six
microsatellite loci in two striped bass families. Dam was 2E55 crossed with sires listed in
table. Possible genotypes of progeny produced by these crosses, observed and expected (1:1
ratio) numbers of each genotype, and G-statistics with probabilities are shown in the table.
Degrees of freedom for each test were v=k-1. There was no evidence of departure from
Mendelian expectation for any locus in either family. ... 109
Table 14. Estimated survival by sire family (±SE). No standard error could be calculated for
the commercial pond (Keo Fish Farms) due to the method of fingerling harvest. ... 110
Table 15. Least squares means (±SE) by sire for phenotypic trait values for experimental
striped bass families... 111
Table 16. Least squares means (±SE) by strain for phenotypic trait values for experimental
striped bass families. The (U) after dam 512C indicates that strain of origin is unknown... 112
CHAPTER 5
Table 17. Estimated pond stocking rates, fingerling recovery rates and survival for three
research ponds (A4, 11, 14) and a commercial production tank (Tank40); fish were sampled
Table 18. Numbers (N) and estimated contributions by sire (proportions plus or minus
standard errors) of 2E55 fingerlings assigned parentage in the initial and final Phase II pond
sample and the final commercial tank sample. A4, 11 and 14 are designations for the research
pond samples at the end of Phase II, Tank 40 is the commercial tank sample... 155
CHAPTER 6
Table 19. Estimated pond stocking rates, fingerling recovery rates and survival for Phase III
five research ponds and a commercial production tank (Tank40); fish were sampled but not
fully harvested from Tank 40, thus survival could not be estimated... 229
Table 20. Numbers (N) and estimated contributions by sire (proportions plus or minus
standard errors) of fingerlings assigned parentage in the Phase III research pond samples for
dam 2E55 (ponds A4, A11, A14), dams 152D and 5F4B (pond A2) and the final 2E55
commercial tank sample (tank 40)... 230
Table 21. Estimated survival (SE) by sire and strain for progeny of dam 2E55 reared in three
Phase III research ponds, A4, A11 and A14... 231
Table 22. Least squares means (SE) for phenotypic trait values for Phase III experimental
striped bass families by dam and rearing unit. Missing values indicate that data were not
Table 23. Least squares means (SE) and sample sizes by sire for gonadosomatic index (GSI)
and antimicrobial peptide (AMP) activity for Phase III experimental striped bass families.
The missing value for antimicrobial peptide activity in pond A14 (--) is due to inadequate
sampling of fish (n=2) from the 4664 sire family in both ponds. Remaining missing values
indicate that trait data were not collected for a group... 234
Table 24. Numbers of male and female progeny for each sire family by rearing unit with
calculated Chi-square values and P-values. Gender ratios are different at P<0.05... 235
CHAPTER 6
Table 25. Number, proportion and trait means (body weight) by sire for three ponds using a
mass selection versus a modified family selection protocol for choosing striped bass
broodfish from the 2E55 family for the next generation. Mean body weight for the pond
before selection (Avg. before selection) and mean for the selected individuals (Avg. after
LIST OF FIGURES
Page
CHAPTER 2
Figure 1. Trends in U.S. hybrid striped bass production (million pounds) through 2004. Data
are from state agriculture extension programs and a survey of 27 major producers conducted
by Kent SeaTech Corporation... 16
CHAPTER 3
Figure 2. Neighbor-joining tree constructed from the distance matrix of the transformed
proportion of shared alleles [-ln (1-PSA)] for the Chesapeake strain. The three groupings
(Groups 1-3) within the Chesapeake strain were analyzed as separate units after tests of HWE
showed deviation within the strain. ... 53
Figure 3. Proportional contribution (±) by sire to 2E55 larval groups reared at PAFL (top)
and Keo Fish Farms (bottom). Proportions with shared letters over the error bars are not
significantly different from one another after sequential Bonferroni adjustment... 113
Figure 4. Proportional contribution (±) by sire to 512C (top) and 5F4B (bottom) larval groups
reared at PAFL. Proportions with shared letters over the error bars are not significantly
Figure 5. Proportional contribution (±) by sire to 152D larval group reared at PAFL.
Proportions with shared letters over the error bars are not significantly different from one
another after sequential Bonferroni adjustment... 115
Figure 6. Estimated survival (±SE) by sire for PAFL 2E55 (top) and Keo 2E55 (bottom)
Phase I fingerlings Roanoke sires are indicated by (Roan), Chesapeake by (Ches) and
Santee:Chesapeake by (S:C). Standard errors could not be calculated for Keo Phase I
fingerlings. There were no pairwise significant differences detected by Z-tests for the PAFL
pond... 116
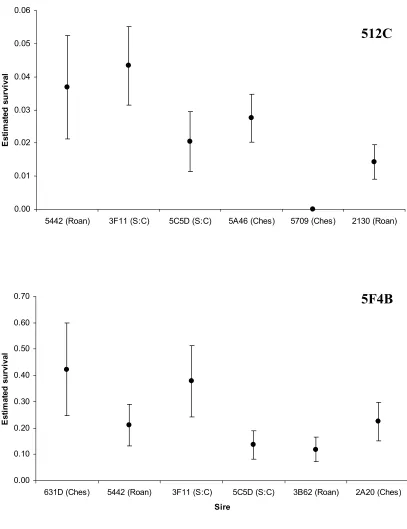
Figure 7. Estimated survival (±SE) by sire for dams 512C (top) and 5F4B (bottom) Phase I
fingerlings. Roanoke sires are indicated by (Roan), Chesapeake by (Ches) and
Santee:Chesapeake by (S:C). There were no significant differences pairwise differences
detected for the 512C progeny. Differences between sire pairs for the 5F4B progeny were not
significant after sequential Bonferroni correction. ... 117
Figure 8. Estimated survival (±SE) by sire for dam 152D Phase I fingerlings in two ponds
(A5 and A7). Roanoke sires are indicated by (Roan), Chesapeake by (Ches) and
Santee:Chesapeake by (S:C). Estimates with shared letters over the error bars are not
Figure 9. Least squares means for dam 2E55 PAFL progeny (±SE) for body weight, total
length, and condition factor. Means with shared letters over the error bars are not
significantly different. Roanoke sires are indicated by (Roan), Chesapeake sires by (Ches)
and Santee:Chesapeake sires by (S:C)... 119
Figure 10. Least squares means for dam 2E55 Keo Fish Farms progeny (±SE) for body
weight, total length, and condition factor. Means with shared letters over the error bars are
not significantly different. Roanoke sires are indicated by (Roan), Chesapeake sires by
(Ches) and Santee:Chesapeake sires by (S:C). ... 120
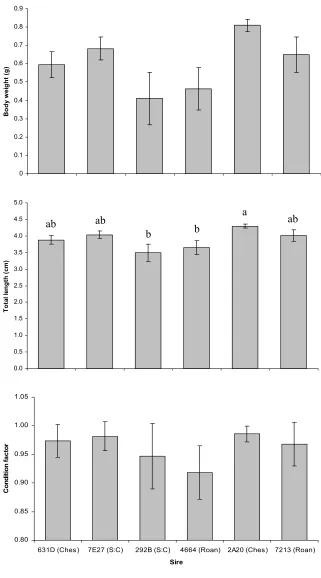
Figure 11. Least squares means for dam 512C progeny (±SE) for body weight, total length,
and condition factor. Roanoke sires are indicated by (Roan), Chesapeake sires by (Ches) and
Santee:Chesapeake sires by (S:C). There were no pairwise differences. ... 121
Figure 12. Least squares means for dam 152D progeny (±SE) for body weight, total length,
and condition factor. Roanoke sires are indicated by (Roan), Chesapeake sires by (Ches) and
Santee:Chesapeake sires by (S:C). There were no pairwise differences. ... 122
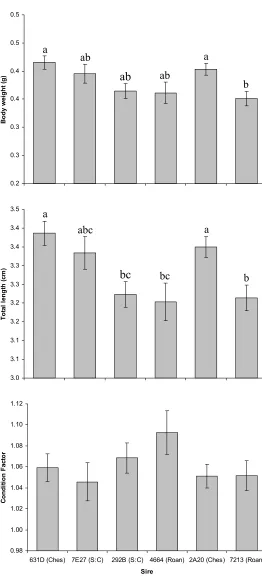
Figure 13. Least squares means for dam 5F4B progeny (±SE) for body weight, total length,
and condition factor. Roanoke sires are indicated by (Roan), Chesapeake sires by (Ches) and
CHAPTER 4
Figure 14. Estimated survival (±SE) by sire family for 2E55 Phase II final pond samples (top
to bottom: A4, A11, A14). Roanoke sires are indicated by (R), Chesapeake by (C) and
Santee:Chesapeake by (SC). Means with shared letters over the error bars are not
significantly different after sequential Bonferroni correction. ... 156
Figure 15. Estimated survival (±SE) by strain for 2E55 Phase II final pond samples (top to
bottom: A4, A11, A14). Roanoke sires are indicated by (R), Chesapeake by (C) and
Santee:Chesapeake by (SC). Means with shared letters over the error bars are not
significantly different (P>0.05). ... 157
Figure 16. Least squares means (±SE) by sire family for 2E55 Phase II initial pond sample
fingerling traits, including total length, body weight and condition factor. Roanoke sires are
indicated by (R), Chesapeake by (C) and Santee:Chesapeake by (SC). There were no
pairwise differences for total length and no overall difference for body weight. Means with
shared letters over the error bars are not significantly different. ... 158
Figure 17. Least squares means (±SE) by strain for 2E55 Phase II initial pond sample
fingerling traits, including total length, body weight and condition factor. Roanoke sires are
indicated by (Roan.), Chesapeake by (Ches.) and Santee:Chesapeake by (SC). Means with
shared letters over the error bars are not significantly different. No effect of strain was
Figure 18. Least squares means (±SE) by sire family for 2E55 Phase II pond fingerling traits,
including total length, body weight and condition factor. Roanoke sires are indicated by (R),
Chesapeake by (C) and Santee:Chesapeake by (SC). Means with shared letters over the error
bars are not significantly different. There was no effect of sire for condition factor. ... 160
Figure 19. Least squares means (±SE) by strain for 2E55 Phase II final pond sample
fingerling traits, including total length, body weight and condition factor. Roanoke sires are
indicated by (Roan), Chesapeake by (Ches) and Santee:Chesapeake by (S:C). The effect of
strain was not significant for any trait... 161
Figure 20. Least squares means (±SE) by sire family for 2E55 Phase II commercial tank
fingerling traits, including body weight, total length, and condition factor. Roanoke sires are
indicated by (R), Chesapeake by (C) and Santee:Chesapeake by (S:C). Means with shared
letters over the error bars are not significantly different... 162
Figure 21. Least squares means (±SE) by strain for 2E55 Phase II final commercial tank
sample fingerling traits, including body weight, total length, and condition factor. Roanoke
sires are indicated by (Roan), Chesapeake by (Ches) and Santee:Chesapeake by (SC). Means
CHAPTER 5
Figure 22. Estimated survival (±SE) by sire family for 2E55 Phase III pond samples.
Roanoke sires are indicated by (R), Chesapeake by (C) and Santee:Chesapeake by (SC).
Estimates with shared letters over the error bars are not significantly different. ... 236
Figure 23. Estimated survival (±SE) by strain for 2E55 Phase III pond samples. Strains are
Chesapeake (Ches.), Santee:Chesapeake (S:C), and Roanoke (R). Means with shared letters
over the error bars are not significantly different. ... 237
Figure 24. Least squares means (±SE) by sire family for 2E55 Phase III pond harvest traits,
including total length, body weight and condition factor. Roanoke sires are indicated by (R),
Chesapeake by (C) and Santee:Chesapeake by (SC). Means with shared letters over the error
bars are not significantly different. ... 238
Figure 25. Least squares means (±SE) by strain for 2E55 Phase III final pond harvest traits,
including total length, body weight and condition factor. Roanoke sires are indicated by
(Roan), Chesapeake by (Ches) and Santee:Chesapeake by (SC). Means with shared letters
over the error bars are not significantly different. ... 239
Figure 26. Least squares means (±SE) by pond for 2E55 Phase III final pond fingerling traits,
including total length, body weight and condition factor. Means with shared letters over the
Figure 27. Least squares means (±SE) by gender for 2E55 Phase III final pond fingerling
traits, including total length, body weight and condition factor. Means with shared letters
over the error bars are not significantly different. ... 241
Figure 28. Least squares means (±SE) by sire family for 2E55 Phase III pond fingerling
traits, including viscerosomatic index and antimicrobial peptide activity. Roanoke sires are
indicated by (R), Chesapeake by (C) and Santee:Chesapeake by (SC). Means with shared
letters over the error bars are not significantly different... 242
Figure 29. Least squares means (±SE) by strain for 2E55 Phase III final pond viscerosomatic
index and antimicrobial peptide activity. Roanoke sires are indicated by (Roan), Chesapeake
by (Ches) and Santee:Chesapeake by (SC). Means with shared letters over the error bars are
not significantly different... 243
Figure 30. Least squares means (±SE) by pond for 2E55 Phase III final pond viscerosomatic
index and antimicrobial peptide activity. Means with shared letters over the error bars are not
significantly different... 244
Figure 31. Least squares means (±SE) by gender for 2E55 Phase III final pond
viscerosomatic index and antimicrobial peptide activity. Means with shared letters over the
Figure 32. Least squares means (±SE) by gender for 2E55 Phase III pond harvest
gonadosomatic index. Roanoke sires are indicated by (R), Chesapeake by (C) and
Santee:Chesapeake by (SC). Means with shared letters over the error bars are not
significantly different... 246
Figure 33. Least squares means (±SE) by strain for 2E55 Phase III final pond gonadosomatic
index for females and males. Roanoke sires are indicated by (R), Chesapeake by (C) and
Santee:Chesapeake by (SC). Means with shared letters over the error bars are not
significantly different... 247
Figure 34. Least squares means (±SE) by gender for gonadosomatic indices of 2E55 Phase
III final pond. Means with shared letters over the error bars are not significantly different.248
Figure 35. Least squares means (±SE) by sire family for 2E55 Phase III commercial tank
harvest traits, including total length, body weight and condition factor. Roanoke sires are
indicated by (R), Chesapeake by (C) and Santee:Chesapeake by (SC). Means with shared
letters over the error bars are not significantly different... 249
Figure 36. Least squares means (±SE) by strain for 2E55 Phase III commercial tank harvest
traits, including total length, body weight and condition factor. Roanoke sires are indicated
by (Roan), Chesapeake by (Ches) and Santee:Chesapeake by (SC). Means with shared letters
Figure 37. Least squares means (±SE) by gender for 2E55 Phase III commercial tank harvest
traits, including total length, body weight and condition factor. Gender was not significantly
different for any trait... 251
Figure 38. Least squares means (±SE) by sire family for 2E55 Phase III commercial tank
harvest traits, including percent fillet, viscerosomatic index and antimicrobial peptide
activity. Roanoke sires are indicated by (R), Chesapeake by (C) and Santee:Chesapeake by
(SC). Means with shared letters over the error bars are not significantly different... 252
Figure 39. Least squares means (±SE) by strain for 2E55 Phase III commercial tank harvest
traits, including percent fillet, viscerosomatic index and antimicrobial peptide activity.
Roanoke sires are indicated by (Roan), Chesapeake by (Ches) and Santee:Chesapeake by
(SC). Means with shared letters over the error bars are not significantly different... 253
Figure 40. Least squares means (±SE) by gender for 2E55 Phase III final commercial tank
harvest traits, including percent fillet, viscerosomatic index and antimicrobial peptide
activity. There was no effect of gender on viscerosomatic activity or antimicrobial peptide
activity... 254
Figure 41. Least squares means (±SE) by gender for 2E55 Phase III commercial tank harvest
gonadosomatic index. Roanoke sires are indicated by (R), Chesapeake by (C) and
Santee:Chesapeake by (SC). Means with shared letters over the error bars are not
Figure 42. Least squares means (±SE) by gender for 2E55 Phase III commercial tank
gonadosomatic indices. Roanoke sires are indicated by (Roan), Chesapeake by (Ches) and
Santee:Chesapeake by (SC). Means with shared letters over the error bars are not
significantly different... 256
Figure 43. Interaction plots for least squares means of 2E55 Phase III traits by sire family
across two rearing Phases in research ponds. Roanoke sires are indicated by (Roan),
Chesapeake by (Ches) and Santee:Chesapeake by (SC)... 257
Figure 44. Least squares means (±SE) by sire family for Phase III harvest traits in the overall
12-family group, including total length, body weight and condition factor. Roanoke sires are
indicated by (R), Chesapeake by (C) and Santee:Chesapeake by (SC). Means with shared
letters over the error bars are not significantly different... 258
Figure 45. Least squares means (±SE) by sire strain for Phase III final pond harvest traits in
the overall 12-family group, including total length, body weight and condition factor.
Roanoke sires are indicated by (Roan), Chesapeake by (Ches) and Santee:Chesapeake by
(SC)... 259
Figure 46. Least squares means (±SE) by sire family for Santee:Chesapeake dam 152D
(12-family group) Phase III harvest traits, including total length, body weight and condition
factor. Roanoke sires are indicated by (R), Chesapeake by (C) and Santee:Chesapeake by
Figure 47. Least squares means (±SE) by sire strain for Santee:Chesapeake dam 152D
(12-family group) Phase III final harvest traits, including total length, body weight and condition
factor. Roanoke sires are indicated by (Roan), Chesapeake by (Ches) and Santee:Chesapeake
by (SC)... 261
Figure 48. Least squares means (±SE) by sire family for Roanoke dam 5F4B (12-family
group) Phase III harvest traits, including total length, body weight and condition factor.
Roanoke sires are indicated by (R), Chesapeake by (C) and Santee:Chesapeake by (SC).
Means with shared letters over the error bars are not significantly different. ... 262
Figure 49. Least squares means (±SE) by sire strain for Roanoke dam 5F4B (12-family
group) Phase III final harvest traits, including total length, body weight and condition factor.
Roanoke sires are indicated by (Roan), Chesapeake by (Ches) and Santee:Chesapeake by
(SC). Means with shared letters over the error bars are not significantly different... 263
Figure 50. Least squares means (±SE) for Santee:Chesapeake dam 152D and Roanoke dam
5F4B (12-family group) Phase III final harvest traits, including total length, body weight and
condition factor. Means with shared letters over the error bars are not significantly different.
Figure 51. Interaction plot of least squares means of total length for six sires crossed with
two dams, Santee:Chesapeake dam 152D and Roanoke dam 5F4B. Roanoke sires are
indicated by (Roan), Chesapeake by (Ches) and Santee:Chesapeake by (SC)... 265
Figure 52. Interaction plot of least squares means of body weight for six sires crossed with
two dams, Santee:Chesapeake dam 152D and Roanoke dam 5F4B. Roanoke sires are
indicated by (Roan), Chesapeake by (Ches) and Santee:Chesapeake by (SC)... 266
Figure 53. Interaction plot of least squares means of body weight for three strains of sires
crossed with two dams, Santee:Chesapeake dam 152D and Roanoke dam 5F4B. Roanoke
sires are indicated by (Roan), Chesapeake by (Ches) and Santee:Chesapeake by (SC)... 267
Figure 54. Interaction plot of least squares means of body weight for three strains of sires
crossed with two dams, Santee:Chesapeake dam 152D and Roanoke dam 5F4B. Roanoke
sires are indicated by (Roan), Chesapeake by (Ches) and Santee:Chesapeake by (SC)... 268
Figure 55. Least squares means for 2E55 sire family traits, including body weight and total
length, in PAFL research scale ponds and a commercial tank at Kent SeaTech Corporation.
Roanoke sires are indicated by (Roan), Chesapeake by (Ches) and Santee:Chesapeake by
CHAPTER 1
BACKGROUND AND RATIONALE
The striped bass, Morone saxatilis, is native to the Atlantic coast of North America,
occurring from the St. Lawrence River in Canada, south to the St. Johns River in Florida, and
disjunctly west into the Gulf of Mexico to Louisiana (Raney and Wolcott 1955). These top
predators are highly prized as foodfish and gamefish and have been widely stocked into
reservoirs throughout the United States and in rivers along the Atlantic coast, in tributaries of
the Gulf of Mexico, and along the California coast. Spawning grounds for striped bass have
been identified in the Miramichi and Shubenacadie Rivers in maritime Canada (Robinson
and Courtenay 1999; Robinson et al. 2004), the Hudson River and the Delaware River
(Waldman and Wirgin 1994), various tributaries of Chesapeake Bay (Laughlin and Turner ),
the Roanoke River (Trent and Hassler 1968), the Santee-Cooper river system (Bulak et al.
1993; Diaz et al. 1998), the St Johns River and the Apalachicola-Chattahoochee-Flint River
system (Wirgin et al. 1991). Populations from Maine to southern North Carolina, including
the Hudson, Chesapeake and likely the Roanoke (Berggren and Lieberman 1978; Waldman
and Fabrizio 1994), are anadromous and spawn in brackish to freshwater estuaries in spring.
Juveniles of these groups mature inshore and the adults engage in seasonal migrations along
the Atlantic Coast, comprising the Atlantic mixed stock fishery (Berggren and Liebermann
1978; Waldman et al 1988; Wirgin et al. 1993). Differentiation among spawning stocks
suggests natal fidelity of migrating striped bass to their rivers of origin (Chapman 1987).
Populations at the extreme ends of the range, from Maine north to the St. Lawrence River in
Canada (Raney and Wolcott 1955) and from southern North Carolina south to Florida are
Since colonial times, the striped bass has supported large commercial and recreational
fisheries (Pearson 1938), but overharvest and habitat degradation resulted in several severe
population declines, most recently in the mid-1970s (Koo 1970; Richards and Rago 1999).
During the mid-1980s, in response to the market void created by the striped bass population
crashes and regulatory limitations on the fisheries, commercial aquaculture of a hybrid
striped bass (hybrid striped bass; striped bass X white bass,and reciprocal cross) began. The
hybrids were hardier under culture conditions than either of their parental species, apparently
due to broader tolerances for temperature and dissolved oxygen and to increased tolerance of
stress (Smith et al. 1985; Hallerman 1994; Noga et al. 1994). Hybrid striped bass initially
were produced in earthen ponds in North Carolina but have since been successfully reared as
foodfish in intensive tank and raceway systems, as well as in both freshwater and marine
cages, throughout the United States (J. Carlberg, personal communication). Production of
hybrid striped bass is currently the fourth most valuable form of finfish aquaculture in the
United States (Pritchard 2005). Although the hybrids are fertile, direct perpetuation of
favorable traits in hybrid lines is not possible as the F2 offspring exhibit lower hatchability,
decreased larval viability, decreased growth (Smith and Jenkins 1984) and increased
incidence of deformities (Bosworth et al. 1997) compared to the F1 hybrids. The hybrid
striped bass farming industry remains largely dependent on wild broodfish for annual
fingerling production.
Following its development in the mid-1980’s, the hybrid striped bass industry grew
rapidly, expanding by more than 600% between 1988 and 1993 (Figure 1). Production has
since plateaued and remains static at approximately 12 million pounds per year. High costs of
markets in the United States and abroad where higher price points are acceptable. Private and
government marketing experts estimate that U.S. hybrid striped bass production could
rapidly increase five-fold to 50 million pounds and $100 million in annual revenue if market
prices could be decreased only moderately. Production costs have risen more than 7% per
year but the market price has increased only 0.2% per year since 1995 (J. Carlberg, personal
communication). A decrease in production cost of hybrid striped bass would allow sales of
hybrid striped bass directly to U.S. consumers in traditional retail markets, much like catfish
is marketed today. It is well recognized in the hybrid striped bass industry that genetic
improvement is necessary for realizing sustainable production and promoting industry
expansion. Economists at Kent SeaTech Corporation predict that production costs for hybrid
striped bass could be reduced by ~12% if selective breeding can yield just 20% faster growth
rates. Gains in growth rates of this magnitude have been achieved through only 1-2
generations of selective breeding of other aquaculture species, including salmon (Gjedrem
1979, Hershberger et al. 1990), trout (Kincaid et al. 1977), and catfish (Dunham 1987). Most
finfish for which selection trials have been made appear to respond with gains of 10-20% per
generation in traits such as growth rate (Refstie et al. 1997), as do shellfish (Calvo et al.
2003). Domestication, without directed selection, has resulted in 3-6% improvement in
catfish growth per generation (Dunham and Smitherman 1983). Knibb (2000) estimates that
even modest genetic gains of ~10% by breeding could double profits for marine aquaculture
companies, and these genetic gains will compound for each generation of selection. Selection
has proved successful for the Atlantic salmon industry, where a selective breeding program
produces a cost benefit ratio of 1:15 (Gjedrem 1997). For poultry, it has been estimated that
selective breeding and that very little was due to improved husbandry techniques (Havenstein
et al. 1994). Because the hybrid striped bass industry mainly utilizes wild broodfish for
spawning, there is much untapped genetic potential for development of a superior cultivar
and the potential economic returns from domestication and selective breeding may be equally
dramatic.
Research has revealed significant performance differences among geographic stocks
and families of captive striped bass (Brown et al. 1998; Woods et al. 1999, Jacobs et al.
1999) and white bass (White 2000; Kohler et al. 2001) and among geographic strains of wild
striped bass (Conover et al. 1997; Secor et al. 2000). With high reproductive output and
variation within and among stocks and strain of white and striped bass, it is expected that
these fish will respond strongly to selection (Hallerman and Beckmann 1988; Poompuang
and Hallerman 1997; Garber and Sullivan 2006). Hybrid striped bass growers, along with
university and government scientists, have recently initiated a National Program of Genetic
Improvement and Selective Breeding for the Hybrid Striped Bass Industry (hereafter,
National Breeding Program) that is committed to development of domesticated and
selectively improved Morone broodstocks. Domestication and selective breeding of these
economically important species will greatly reduce or eliminate dependence on unreliable
methods of wild capture as well as alleviate pressure on wild stocks. Access to reliable
sources of broodstock, application of efficient selective breeding designs, and successful and
predictable control of reproduction of captive fish will enable hybrid growers to maximize
the quality and quantity of fingerlings and foodfish for production. Domestication and
sustaining and improving growth of the hybrid striped bass industry and for enabling this
industry to better compete with producers of other wild and farmed food fish.
The commercial production cycle of hybrid striped bass begins with acquisition of
broodstock for spawning. Seedstock producers are largely dependent upon the annual capture
of wild white bass and striped bass broodstock directly from their spawning grounds. Gravid
female white bass are induced to ovulate with injections of human chorionic gonadotropin
(hCG; Kohler 1997) and then the eggs are manually stripped from females and fertilized in
vitro with milt from striped bass males. Fertilized eggs are incubated in McDonald hatching
jars for approximately 48 hours (Rees and Harrell 1990) and newly hatched fry swim up
from the jars into large aquaria where they are incubated for 2 to 5 days until their mouth
parts have developed and exogenous feeding can begin (Humphries and Cumming 1973).
The majority of fry produced by the hybrid striped bass industry are stocked into outdoor
earthen ponds which have been fertilized and prepared in order to stimulate phytoplankton
and zooplankton blooms. Small zooplankton such as rotifers, copepods and cladocerans serve
as the source of food for the young larvae for the first few weeks of life (Geiger 1983a,b,
1985). In intensive fry culture, larvae are stocked into tanks and zooplankton species are
supplied as a food source until the fry can be trained to accept artificial feeds. Prepared feeds
are introduced to pond-reared fry at 22 to 27 days of age (Ludwig 1994; Hodson 1995). The
fish are fed a high protein starter diet several times per day until their harvest at 30-45 days
after stocking. At the end of this Phase I rearing period, when fingerlings are approximately 1
gram or more in weight, the fish are seined from the ponds and graded to remove any
extraordinarily large individuals, which may become cannibalistic (Parker and Geiger 1984;
cause substantial mortality in intensive culture (Kerby et al. 1988). Fingerlings are generally
maintained in raceway or tank systems until they have been trained to accept artificial feeds,
after which time they are sold to producers for stocking into outdoor ponds or into
commercial tank or raceway systems for production of Phase II fingerlings (90-225g) and
subsequently for production of Phase III food fish (568-681g) (Hodson 1995).
Because the hybrid is a terminal cross, simultaneous improvement of the two parental
species of the hybrid will be necessary in the National Breeding Program. Efforts toward
domestication of both striped bass and white bass are underway at several university and
government facilities. The majority of hybrid striped bass culture relies on production of the
sunshine bass, a cross between a white bass female and a striped bass male. This cross has
been reported to have better growth performance and stress tolerance than the white bass,
palmetto bass (female striped bass x male white bass) or striped bass (Noga et al. 1994;
Rudacille and Kohler 2000; Myers and Kohler 2000); however, contradictory growth
performance has been demonstrated by several investigators (Smith et al. 1985; Bosworth et
al. 1997; Jenkins et al. 1998) for whom the palmetto bass and/or the striped bass showed
better performance characteristics. A definitive study to evaluate these crosses in a
well-replicated experiment remains to be completed, and thorough evaluation of the performance
of domesticated striped bass in comparison to the hybrid crosses is lacking. In any case,
sunshine bass presently constitute the bulk of hybrid striped bass production because the
fingerlings are much more readily available to fingerling and foodfish producers (Harrell
1997) owing to the fact that female white bass are smaller and are more easily housed,
handled and spawned than are striped bass females (Smith et al. 1996), particularly in a
then fertilize the eggs in vitro with striped bass sperm. Therefore, for a hybrid striped bass
breeding program, distribution of improved lines to fingerling producers and preservation of
various genetic lineages will be best accomplished by distributing gametes from the male
parent, the striped bass. Techniques have been developed for both short term storage and
long term cryopreservation of striped bass semen (Kerby et al. 1985; Jenkins-Keeran et al.
2001; Jenkins-Keeran and Woods, 2002a,b; He and Woods 2003; Thirumala et al. 2006). In
addition to the relative ease of preserving and distributing striped bass male gametes, striped
bass males become reproductively mature at an earlier age than do females (2-3 years rather
than 4-5 years) (Sullivan et al. 1997), and this shorter generation time should prove beneficial
in a breeding program since improved lines of males will be available for reproduction more
quickly than would females of their year class. Because distribution of male gametes is easily
accomplished and because rapid gains in a program of selective breeding are most likely to
be made using the male striped bass, efforts at North Carolina State University (NCSU) have
focused on selective improvement of the striped bass parent. Additionally, several authors
have suggested that striped bass as a cultivar may be superior to the current hybrid striped
bass product (Smith et al. 1985; Jenkins et al. 1988) and improved striped bass may be
desirable in some market sectors (Garber and Sullivan 2006). Use of selectively improved
striped bass would eliminate the need for maintaining two parental species and would reduce
environmental concerns about genetic contamination from hybrid striped bass escaping into
the wild. Selective improvement of striped bass will support the primary goals of the
National Breeding Program.
The largest and most genetically diverse collection of captive striped bass broodstock
Carolina. The broodstock group consists of a number of wild-caught strains collected
throughout the geographic range of the species, as well as several captive-bred lines
produced at PAFL or obtained from the University of Maryland or from commercial or
government researchers. Despite challenges associated with spawning striped bass in
captivity, recent improvements in broodstock husbandry techniques including improved
methods for detection of the onset and course of reproductive maturation (Weber et al. 2000),
staging of biopsied oocytes to identify female candidate spawners (Rees and Harrell 1990;
Sullivan et al. 1997), induction of gonadal maturation using implanted pellets that chronically
release synthetic hormones (Woods and Sullivan 1992, 1993; Hodson and Sullivan 1993),
and maturation of broodstock out-of-season by photothermal conditioning (Blythe et al.
1994; Smith and Jenkins 1988; Clark et al. 2005) have permitted researchers to successfully
close the reproductive cycle of striped bass. These advances set the stage for genetic
improvement of the fish in a program of domestication and selective breeding. Using these
new technologies, both striped bass and white bass have been reared through several
successive filial generations of domestication in captivity (Woods et al. 1992; Woods and
Sullivan 1993; Hopper 1999). NCSU researchers have repeatedly verified that domesticated
striped and white bass broodstock can be used to reliably produce hybrid striped bass
fingerlings with rates of fecundity, fertility, hatching and fry survival equal to or greater than
values observed for fully mature wild broodfish (Hodson et al. 2000). Such necessary
advances in control of reproduction make possible the selective breeding of these fish as it is
now technically feasible to generate numerous even-aged families for evaluation of the
Genotypic components of progeny performance traits have not been assessed for
captive striped bass during the commercial production cycle. This deficiency is due primarily
to the daunting logistical difficulty of maintaining numerous progeny groups in separate
rearing units until they are large enough to be physically tagged, a size reached well after the
Phase I rearing period. Not only is synchronous spawning of multiple striped bass families
difficult, rearing of numerous replicated families separately in outdoor ponds requires many
more ponds than are currently available to the National Breeding Program. Due to these
resource limitations, the use of communal pond rearing techniques offers promise for
selective breeding of striped bass and hybrid striped bass because multiple families can be
stocked into the same pond or tank environment and reared under identical environmental
conditions. Communal rearing techniques can thereby reduce the number of rearing units
necessary for production of many families and increase the number of families or groups that
can be compared (Moav and Wohlfarth 1974; McGinty 1987; Macbeth 2005). Additionally,
by rearing all families in the same environment, the environmental component of phenotypic
variation among families can be largely minimized, unmasking additive genetic contributions
to growth and other commercially important performance traits with greatly reduced tank or
pond effects.
Communal stocking of common carp in ponds (Moav and Wohlfarth 1974) and cages
(Wohlfarth and Moav 1991) has proven that mixed (as compared to separate) rearing is a
valuable and efficient method for performance testing of numerous family groups of fish.
This principle also has been demonstrated in catfish (Dunham et al. 1982) and tilapia
(McGinty 1983, 1987). Although competition among families may exist in mixed groups,
experiments was observed in the above studies of carp, catfish and tilapia. Similarly,
although not a stated goal of their study, Jacobs et al. (1999) reared several strains of striped
bass in two intensive culture facilities with one facility utilizing separate rearing and the
other utilizing communal rearing. Culture conditions were slightly different between the two
facilities but rank order of growth performance did not differ among strains, providing some
evidence that communal rearing of striped bass can produce results consistent with separate
rearing. Communal rearing techniques have been utilized for performance evaluations of
catfish (Dunham et al. 1982; Bosworth et al. 1998), various races of carp (Wohlfarth and
Moav 1990), coho salmon (Hershberger et al. 1990), African catfish (Volckaert and
Hellemans 1999), rainbow trout (Iwamoto et al. 1986; Herbinger et al. 1995, 1997),
European sea bass (Garcia de Leon et al. 1998), Atlantic salmon (O’Reilly et al. 1998;
Obedzinski and Letcher 2004) and brown trout (Glover et al. 2004). Use of communal
rearing techniques for striped bass is expected to permit efficient and meaningful
comparisons of performance among fish from numerous families during Phase I fingerling
production. Evaluation of communal rearing techniques and data from family performance
comparisons should provide valuable information for development of a selective breeding
program for striped bass.
For communal evaluation of Phase I phenotypic traits in striped bass, families of
larvae must be mixed and stocked into ponds only a few days after hatching, when they are
much too small to be physically tagged for individual identification. The challenge of
individually identifying offspring after communal rearing can be resolved through the use of
highly variable molecular markers as innate genetic tags. By genotyping all parents and
parentage of each communally reared individual can be determined. This technique has been
successfully applied in a number of communal rearing strategies for aquacultured species
(e.g., Herbinger et al. 1995; Garcia de Leon et al. 1998; O’Reilly et al. 1998). Microsatellites
are short (1-6 base pairs), tandemly repeated DNA sequences (Queller et al. 1993). Generally
considered selectively neutral, microsatellite repeat regions are fairly evenly distributed
throughout the animal genome (Tautz and Renz 1984). Due to high mutation rates (on the
order of 10-4 per generation; Edwards et al. 1992; Weber and Wong 1993; O’Reilly et al.
1998; Norris et al. 2000), microsatellite markers are often highly polymorphic. These loci can
be amplified from DNA from very small tissue samples by using the polymerase chain
reaction (PCR) (Queller et al. 1993). Microsatellite markers have proven useful in assessment
of population genetic variation and stock identification (Ruzzante et al. 1996b; Chapman et
al. 1999), for analysis of kinship and parentage (DeWoody et al. 1998; O’Reilly et al. 1998),
and for selective breeding (Waldbieser and Wolters 1999). Conservation of PCR priming
sites, sequences adjacent to the microsatellite repeat region, often serves to expedite studies
of organisms for which microsatellites have not been sequenced. Microsatellite markers
developed for striped bass have been shown to be polymorphic in both white bass and hybrid
striped bass (Couch et al. 2006), and those developed for the closely related European
seabass (Dicentrarchus labrax) have proven polymorphic in striped bass, white bass, white
perch and hybrid striped bass (Han et al. 2000; C.R. Couch, A.F. Garber and C.V. Sullivan,
unpublished data). As such, microsatellite markers should be useful for individual
identification and estimation of genetic variation in a program of selective breeding for these
The dissertation research described in the following chapters is directed at
examination of genetic variation within and among captive strains of striped bass broodstock
and at understanding potential genetic influences on survival and performance of
communally reared striped bass. These experiments provide necessary basic information for
selective improvement of striped bass. This information will be a critical first step toward
initiating long-term selective breeding efforts to genetically improve and further domesticate
Morone species for the hybrid striped bass industry.
ORGANIZATION OF THE THESIS
The six chapters of the dissertation outline the need for selective breeding for Morone species
and provide substantial information to support the goals of the National Program of Genetic
Improvement and Selective Breeding for the Hybrid Striped Bass Industry.
Chapter 1—Chapter 1 provides an introduction to the rationale for the dissertation research
and introduces information regarding the biology and distribution of wild striped bass, an
overview of the production cycle of the hybrid striped bass, and the need for domestication
and selective genetic improvement of the parent species of the hybrid to enable more
efficient and sustainable aquaculture production of these fish. The organization of the
dissertation is described.
Chapter 2—In Chapter 2, genetic variation within and among three captive striped bass
microsatellite DNA were utilized to estimate the genetic variability of the strains for a
program of domestication and selective improvement.
Chapter 3— Chapter 3 addresses the feasibility of using microsatellite markers for progeny
identification in order to support communal rearing protocols for performance evaluations of
striped bass. Utilizing the genotyped striped bass broodstock described in Chapter 2 as
parents, twenty-four experimental families were produced for examination of genetic
variation in growth-related phenotypic traits and in survival in communally reared families of
striped bass.
Chapter 4—In Chapter 4, variation in growth performance is evaluated for six families of
striped bass during Phase II rearing in research ponds at PAFL and in a commercial
production tank at Kent SeaTech Corporation. A microsatellite marker-assisted communal
rearing approach is utilized to examine paternal effects on progeny growth of fingerlings.
Chapter 5—In Chapter 5 of the dissertation, performance traits are examined for eighteen
half-sibling families reared in order to evaluate the genetic basis of commercially important
performance characteristics for Phase III, or market-size, striped bass. All families were
evaluated in research ponds and six of the families also were reared in a commercial tank
production system. Six microsatellite markers were utilized as innate genetic tags for
Chapter 6—A summary of the major findings of the dissertation research and a description
of relevant areas of future investigation are described in Chapter 6.
The four research chapters (Chapters 2-5) are prepared in general manuscript format and
therefore contain some necessary repetition of information. Tables and figures are numbered
in sequential order throughout the thesis and are inserted at the end of each chapter in which
they are referenced. In a few cases, tables and figures presented in earlier chapters are
referenced in later chapters but these figures and tables are not duplicated for each use. A
single list of literature citations follows Chapter 6 and appendices are sequentially numbered
CHAPTER 2
ABSTRACT
Genetic variation provides the raw material for evolution and is necessary for selective
breeding. In a program of selective breeding, a genetically variable founder population can
capture the scope of phenotypic variation which is available for selective improvement of the
species or strain. Maintenance of genetic variation during production of the broodstock
population and during subsequent generations of captive breeding and selection is critical for
avoidance of inbreeding and resultant inbreeding depression of fitness and performance
traits. In the present study, three captive striped bass broodstock strains, one wild (Roanoke
F0), and two domestic (Chesapeake F2 and Santee:Chesapeake F1), were genotyped at three
microsatellite DNA loci in order to estimate the genetic variability of the strains for a
program of domestication and selective improvement. All microsatellite loci were highly
polymorphic in the striped bass broodstock population. A total of 54 alleles was observed in
the population and average allelic richness was 13.7 alleles per locus. Within broodstock
strains, allelic diversity was generally high with the greatest average number of alleles per
locus observed in the wild Roanoke strain (15 alleles), and fewer alleles observed within
domesticated strains (10.3 alleles) or Santee:Chesapeake strains (8.9 alleles). Unique alleles
were detected in all strains and one domesticated lineage was distinguished by the presence
of a high frequency unique allele. Average observed heterozygosity (HO) over all loci was
0.84, with HO of 0.86 for the wild strain and 0.87 and 0.79 for the domesticated strains. Only
the Chesapeake strain failed to conform to Hardy-Weinberg expectations, possibly due to the
breeding history of this group. The inbreeding coefficient, FIS, was not significantly different
from zero for either the Roanoke or the Santee:Chesapeake strains but was less than zero for


![Figure 2. Neighbor-joining tree constructed from the distance matrix of the transformed proportion of shared alleles [-ln (1-PSA)] for the Chesapeake strain](https://thumb-us.123doks.com/thumbv2/123dok_us/1575008.1193757/86.612.92.483.68.564/figure-neighbor-joining-constructed-distance-transformed-proportion-chesapeake.webp)