Vertical Electron Cyclotron Emission Diagnostic for TCV
Plasmas
W. W. Eshetua, L. Porte, A. Fasoli, O. Sauter, S. Coda, T. P. Goodman, and The TCV Team
Ecole Polytechnique F´ed´erale de Lausanne (EPFL), Centre de Recherches en Physique des Plasmas, Association Euratom-Conf´ed´eration Suisse, CH-1015 Lausanne, Switzerland
Abstract. Electron cyclotron resonance heating (ECRH) and electron cyclotron current drive (ECCD) are used to heat the plasma, to tailor the current profiles and to achieve dif-ferent operating regimes of tokamak plasmas. Plasmas with ECRH/ECCD are character-ized by non-thermal electrons, which cannot be described by a Maxwellian distribution. Non-thermal electrons are also generated during MHD activity, like sawteeth crashes. Quantifying the non-thermal electron distribution is therefore a key for understanding EC heated fusion plasmas. For this purpose a vertical electron cyclotron emission (V-ECE) diagnostic is being installed at TCV. The diagnostic layout, the calibration, the analysis technique for data interpretation, the physics potentials and limitations are discussed.
1 Introduction
1.1 Principle of Vertical Electron Cyclotron Emission Diagnostic
An electron gyrating along a magnetic field emits radiation at a frequency given by:
ω= nω0 γ
1 1−βkcos (θ)
(1)
Hereθis the angle between the emission direction and the magnetic field, n is the harmonic number, γis the relativistic factor,ω0is the cold resonance frequency, andβkis the parallel component of the
velocity of the electron normalized by the speed of light. Viewing the emission along the perpendicular direction the equation reduces to:
ω= nω0
γ (2)
If the emission is viewed along a line of constant magnetic field, such as a vertical line of sight in a tokamak, there is one to one correspondence between the electron energy and the emission frequency, provided that the harmonic is identified. Assuming that the electrons are completely uncorrelated, the total spectral emissivity, which is the power per volume per solid angle and per angular frequency for perpendicular emission, is given by:
jXn(ω)= e 2
4πǫ0c ωp3m
Z 1
−1
1−y2J′n2 ω
ω0
pm
1−y2 1 2
!
f (pm, y) dy (3)
jOn (ω)= e 2
4πǫ0c ωp3m
Z 1
−1
y2Jn2 ω
ω0
pm
1−y2 1 2
!
f (pm, y) dy (4)
a e-mail:wonwub.eshetu@epfl.ch C
0 0.5 1 1.5 2 2.5 3 −0.5
0 0.5 1 1.5
x [m]
Z [m]
HE
11waveguide Ellipsoid
mirror
Telescope
Beam Dump
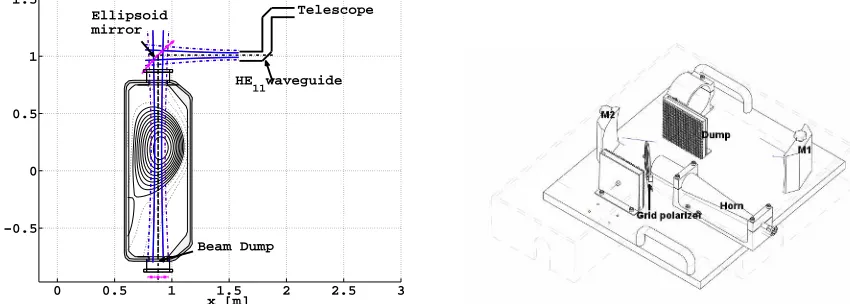
Fig. 1. Schematic diagram of the poloidal cross-section of V-ECE system at TCV and the telescope
for nthharmonic of the extraordinary(X) and ordinary (O) modes, respectively[1].
Hereyis the cosine of the pitch angle, and pmis momentum normalized to mec, corresponding to the emission frequencyω, with the relationω=nω0/
1+p2 m
1/2
. f is the distribution function defined so that the integral in the normalized momentum space is the density. Jnand J
′
nare the Bessel functions of the first kind of order n and its derivative with respect to the argument.
The principle of V-ECE is based on measuring emissions of the different harmonics and different modes, along a vertical chord, with which one can reconstruct the distribution function of non-thermal electrons. Note that V-ECE provides no information about the asymmetry of f along the magnetic field, and it also gives a line averaged quantity.
2 Vertical ECE Diagnostic on TCV
The vertical ECE system at TCV consists of a focusing ellipsoidal mirror , an HE11waveguide, and a telescope system with horn and focusing mirrors. At the bottom of the vacuum chamber a beam dump of reflectivity less than 0.1 % is installed to avoid spurious emission from wall reflections. The poloidal cross-section of the system in the plasma and the telescope are shown in Fig.1. The system forms a Gaussian antenna pattern of beam waist (1/e2drop in intensity) of 2.3-3.7 cm at the center of the vacuum vessel, in the frequency range of 65-114.5 GHz. The beam width changes by≈5%, with divergence of≈10within the plasma position, as estimated by a calculation done in vacuum, using the Gaussian beam propagation equation.
The signal collected by the antenna is transported by a circular waveguide of diameter of 2.5 cm to the radiometers, which can be used to measure second and third harmonics emission in the frequency range of 65-114.5 GHz, with bandwidth of either 750 MHz or 1.5 GHz[4]. The signals are digitized at a rate of 200 KHz.
3 Limitation of the V-ECE diagnostic and experimental plan on TCV
The main assumptions for the V-ECE diagnostic are that the emission can be attributed to a single harmonic,that the magnetic field is constant along the vertical line, that there is no Doppler shifted emission, that the beam path in the plasma is straight, and that all the radiation comes from direct plasma emission.
1.1 1.2 1.3 1.4 1.5 1.6 1.7 10
11 12 13 14 15 16 17 18 19
time [s]
Calib constant [KeV/V]
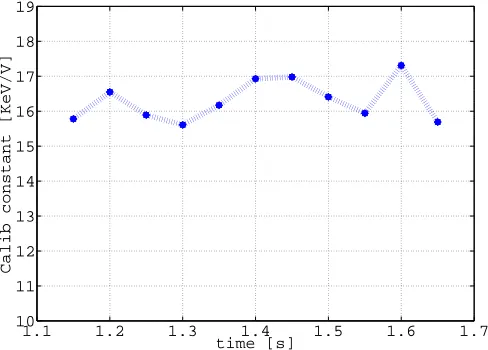
Fig. 2. The calculated calibration constants of one channel of the radiometer over each Thomson time
the total magnetic field in tokamaks. For a typical poloidal magnetic field strength in tokamaks of 10 % of the toroidal field, the total field varies only by 0.5 %.
The latter three assumptions are affected by refraction. The deviation of the beam path from straight line introduces ambiguity to the relation between emission frequency and electron energy. It also en-hances the Doppler shifted emission as the beam path deviates from the perpendicular direction. In addition, the refracted beam will be projected outside the beam dump causing spurious wall reflection to enter in to the system. For the TCV case the refraction effect will be minimal only for densities around 1019m−3or less for second harmonic X (X2) mode, making the diagnostic useful only for low density plasmas. The refraction effect is less severe for O-mode . However, O-mode emission is rela-tively weak compared to X-mode emission, and hence can easily be affected by the cross-polarization. For electrons with 30 KeV of energy the X2 emission is >60 times stronger than O2 (assuming isotropic distribution). Therefore, the plan is to measure X2 and X3 emissions simultaneously.
4 Calibration of the system
System calibration is performed treating the plasma as a known source. Ohmic plasmas with no saw-tooth crash and little fluctuations are used. The ray-tracing code TORAY is used to calculate the rays paths, and the radiation temperature along the rays is calculated using the radiative transfer equation assuming the plasma is in thermal equilibrium[2] . The average radiation temperature that fills the antenna pattern is calculated as an average over a bundle of rays, distributed so that they mimic the Gaussian antenna pattern. The ratio of the radiation temperature to the average ECE measurement of each Thomson time is calculated, and the mean of all such values in one shot is taken as the calibra-tion constant of the given channel. In order to calibrate all channels, different shots are used, with the magnetic field being varied so that the resonance at the particular frequency of a channel is within the antenna pattern. An example of the calibration of one channel of the radiometer is shown in Fig.2.
5 Analysis technique
1 5 10 15 20 24 0
0.05 0.1 0.15 0.2 0.25 0.3 0.35 0.4
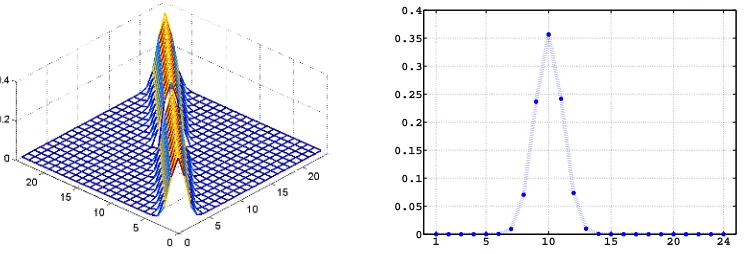
Fig. 3. A mesh of the elements (left) and a plot of one row (right) of the ”convolution matrix” calculated for TCV
radiometer frequencies in the second harmonic
measurement, using (3) and (4), one needs to fit the dependence of the distribution function on pitch angle. We write the distribution function as:
f (pm, y)= ρm 2πp2
m
Ψm(y) (5)
withR−11Ψm(y) dy=1. Hereρmrepresents the density per normalized momentum, andΨm(y) the pitch angle distribution at pm.
The form ofΨm(y) can be chosen based on a physical argument on the plasma scenario[3], or based on the results of theoretical codes , like CQL3D, that can simulate non-thermal electrons. For TCV case both methods will be tried. Since CQL3D uses ad-hoc diffusion constants that can be set manually[5], the diffusion constants that give reasonable agreement with the experimental result will be found first. Then, from the results of CQL3D electron distribution function, the form of pitch angle distribution with a free parameter will be deduced for a given momentum (energy). The free parameter will be determined from experimental results of X3 and X2 emissions.
5.1 Improving the Energy resolution
The energy resolution of the system is mainly limited by the width of the antenna pattern. For instance at a frequency of 77 GHz, the beam width is>3.5 cm which is equivalent to∆E >40 KeV on TCV. Since the magnetic field and the antenna pattern are known, a matrix is defined that relates how each momentum (determined by the bandwidth of the radiometer) contributes for different frequency. We referred to this matrix as ”convolution matrix”. This is because of the convoluted dependence of the emission frequency on the momentum, and the cold resonance frequency, which in turn depends on the spatial position. Hence the spatial dependence in (3) and (4) will be included in the matrix. Solving the inverse problem for the distribution function, the energy resolution of the system will be determined by the bandwidth of the radiometer. For TCV radiometers, this technique improves the energy resolution by a factor of up to 8 times. The mesh of the elements, and a plot of a row of the convolution matrix calculated for the TCV radiometer frequencies in the second harmonic are shown in Fig.3. From the figure it can be seen how a single momentum contributes for emission at different frequencies.
6 Conclusions
References
1. I. H. Hutchinson,Principles of Plasma Diagnostics (Cambridge,1987)(132-158) 2. George Bekefi, Radiation processes in plasmas (Wiley, New York, 1966) 3. K. Kato and I. H. Hutchinson, Phys. Rev. Lett.56, 340, (1986)
4. P.Blanchard et al, Plasma Phys. Control. Fusion 44,2231-2249 (2002)