Available Online atwww.ijcsmc.com
International Journal of Computer Science and Mobile Computing
A Monthly Journal of Computer Science and Information Technology
ISSN 2320–088X
IMPACT FACTOR: 6.017
IJCSMC, Vol. 6, Issue. 12, December 2017, pg.59 – 64
Analytical Hierarchy Process Algorithm
Approach for Determining Best Employee
(Case Study IT Company in Jakarta)
Indra Ranggadara
1, Riad Sahara
2¹Information System-Faculty of Computer Science, Mercu Buana University, Indonesia
²Information System-Faculty of Computer Science, Mercu Buana University, Indonesia
1
[email protected]; 2 [email protected]
Abstract— In the decision making process involving many criteria and many alternatives, the Analytical Hierarchy Process (AHP), method is often used as a problem-solving method. Decision making is done by giving the value of perception as weighted by a decision maker or expert. Employees in a IT company play a very important role in the survival of the company. However, having a professional employee is certainly not easy for the company, because not many employees are able to prioritize professionalism in work. Many employees are not committed to work until they stop in the middle of the road. To obtain professional workforce in accordance with the demands of office, a company needs to conduct coaching on its employees. Coaching is not only done only occasionally, but there needs to be continuity of coaching employees. Employees who have gained coaching certainly produce outstanding work performance that has an impact on the progress of the company. This work achievement is evidenced by excellent performance and the company can move forward rapidly.
Keywords— AHP, employee, works performance, decision-making
I. INTRODUCTION
employees. The appreciation and appreciation that the company provides to employees will of course have a positive effect on the improvement of employee performance for the better. From the background that has been described above, then got this research problem can be formulated as that is how to determine best employee use algorithm AHP (Analytical Hierarchy Process).
A. Research Problems
Based on the introduction described in the previous section, in this section the research problem is taken on how to determine best employee using Analytical Hierarchy Process algorithm.
B. Limitation of Research
Here on below, there are some limitations that need to be considered so that the discussion is not widespread or widened and so the discussion is not too far from relevance so that research can be more focused to do in this study are:
1) Objects of this study at IT Industry in Jakarta
2) This study used 3 criteria which are; Attitude, Work Quality, and Expertise 3) The sample used 3 employee which are; A,B, and C
C. Purpose and Objectives
The purpose of this research are for to determine best employee using Analytical Hierarchy Process algorithm.
II. STUDY LITERATURE
To support the making of this research, it should be mentioned matters or theories related to the problem and the scope of the discussion as a foundation in making this research.
A. Employee Definition
An employee is a worker who does the work and gives his work to an entrepreneur working on where his work is in accordance with the profession or work on the basis of his skill as his livelihood. In line with this according to the Law No.14 of 1969 on the Principal of Manpower, the employee is any person capable of carrying out work, both inside and outside the working relationship to produce services or goods to meet the needs of the community[3].
B. Job Performance
Job performance represents the key performance outcome at the individual level that an ES is expected to enhance and is thus our ultimate dependent variable of interest. Job performance is how well an employee performs his or her job and is often an external assessment (e.g., supervisor assessment) of an employee’s execution of his or her assigned job duties [4].
B. Decision Support System Definition
Decision Support System (DSS) is a computer based-system that can be used to make decision on the result of identification. DSS deals with making decision in terms of management, operation, and planning. In making decision, the support system is designed fully computerized, human, or combination of both systems. DSS is knowledge based in nature. It’s functions to help a decision maker to compile data and information, document, or business model as how to identify, solve problems, as well as make decisions [5].
III.METHODOLOGY
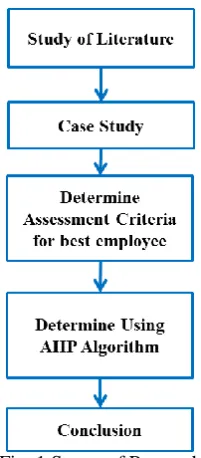
A. Research Steps
Fig. 1 Stages of Research
B. Analytical Hierarchy Process Algorithm
Analytical Hierarchy Process (AHP) was developed by Prof. Thomas Lorie Saaty (1998) from Wharston Business school to seek ranking or priority order of various alternatives in solving a problem. In everyday life, one is always faced with the choice of alternatives. Priority determination and consistency test are required on the options that have been made. In complex situations, decision-making is not influenced by just one factor but multi-factor and encompasses both levels and interests [6].
Basically AHP is a general theory of measurement used to find the scale of ratio of both discrete and continuous pairwise comparisons. These comparisons can be drawn from the actual size or base scale reflecting the strength of feelings and relative preferences [7]. Some principles in solving problems with Analytical Hierarchy Process (AHP):
1. Determining the hierarchy
2. Determining the priority of the elements by making pairwise comparisons 3. Synthesis
4. Measuring consistency 5. Calculate index consistency 6. Calculate the index ratios
IV.RESULT AND CALCULATION
A. Determining the hierarchy
Figure 1. Stages of Research
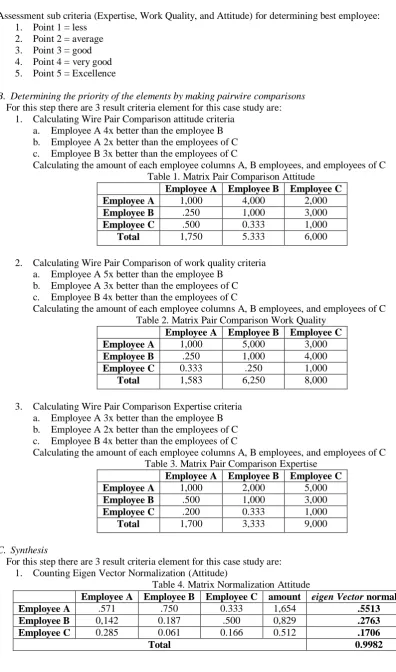
Assessment sub criteria (Expertise, Work Quality, and Attitude) for determining best employee: 1. Point 1 = less
2. Point 2 = average 3. Point 3 = good 4. Point 4 = very good 5. Point 5 = Excellence
B. Determining the priority of the elements by making pairwire comparisons
For this step there are 3 result criteria element for this case study are: 1. Calculating Wire Pair Comparison attitude criteria
a. Employee A 4x better than the employee B b. Employee A 2x better than the employees of C c. Employee B 3x better than the employees of C
Calculating the amount of each employee columns A, B employees, and employees of C Table 1. Matrix Pair Comparison Attitude
Employee A Employee B Employee C
Employee A 1,000 4,000 2,000
Employee B .250 1,000 3,000
Employee C .500 0.333 1,000
Total 1,750 5.333 6,000
2. Calculating Wire Pair Comparison of work quality criteria a. Employee A 5x better than the employee B
b. Employee A 3x better than the employees of C c. Employee B 4x better than the employees of C
Calculating the amount of each employee columns A, B employees, and employees of C Table 2. Matrix Pair Comparison Work Quality
Employee A Employee B Employee C
Employee A 1,000 5,000 3,000
Employee B .250 1,000 4,000
Employee C 0.333 .250 1,000
Total 1,583 6,250 8,000
3. Calculating Wire Pair Comparison Expertise criteria a. Employee A 3x better than the employee B b. Employee A 2x better than the employees of C c. Employee B 4x better than the employees of C
Calculating the amount of each employee columns A, B employees, and employees of C Table 3. Matrix Pair Comparison Expertise
Employee A Employee B Employee C
Employee A 1,000 2,000 5,000
Employee B .500 1,000 3,000
Employee C .200 0.333 1,000
Total 1,700 3,333 9,000
C. Synthesis
For this step there are 3 result criteria element for this case study are: 1. Counting Eigen Vector Normalization (Attitude)
Table 4. Matrix Normalization Attitude
Employee A Employee B Employee C amount eigen Vector normalization
Employee A .571 .750 0.333 1,654 .5513
Employee B 0,142 0.187 .500 0,829 .2763
Employee C 0.285 0.061 0.166 0.512 .1706
2. Counting Eigen Vector Normalization (Work Quality)
Table 5. Matrix Normalization Work Quality
Employee A Employee B Employee C amount eigen Vector normalization
Employee A .653 0,800 0,375 1,828 .6093
Employee B .130 .160 .500 .790 .2633
Employee C 0.215 0,040 0,125 .380 .1266
Total .9992
3. Counting Eigen Vector Normalization (Expertise)
Table 6. Matrix Normalization Expertise
Employee A Employee B Employee C amount eigen Vector normalization
Employee A 0.588 0,600 0.555 1,743 .5810
Employee B .294 .300 0.333 0.927 .3090
Employee C .117 0,100 .111 0.328 .1093
Total .9993
D.Measuring consistency
For this step there are 3 result criteria element for this case study are: 1. Calculating Maximum Eigen Vector (Attitude)
Λmaks = (1.750 x 0.5513) + (5.333 x 0.2763) + (6.000 x 0.1706) = 0.964775 + 1.472679 + 1.0236
= 3.461054
2. Calculating Maximum Eigen Vector (Work Quality)
Λmaks = (1,583 x 0.6093) + (6.250 x 0.2633) + (8.000 x 0.1266) = 0.9645219 + 1.645625 + 0,1,0128
= 3.6229469)
3. Calculating Maximum Eigen Vector (Expertise)
Λmaks = (1.700 x 0.5810) + (3.333 x 0.3090) + (9.000 x 0.1093) = 0.9877 + 1.029897 + 0.9837
= 3.001297
E. Calculate index consistency
For this step there are 3 result criteria element for this case study are: 1. Counting Consistency Index (Attitude)
CI = (Λmaks - n) / (n - 1) = (3.461054 - 3) The / (3-1) = 0.461054 / 2
= 0.230527
2. Counting Consistency Index (Work Quality) CI = (Λmaks - n) / (n - 1)
= (3.6229469 - 3) The / (3-1) = 0.6229469 / 2
= 0,31147345
3. Counting Consistency Index (Expertise) CI = (Λmaks - n) / (n - 1)
= (3.001297 - 3) The / (3-1) = 0.001297 / 2
= 0.0006485
F. Calculate the index ratios
2. Counting Consistency Ratio (Work Quality) CR = CI / IR
= 0.31147345 / 0.58 = 0,53702319
3. Counting Consistency Ratio (Expertise) CR = CI / IR
= 0.0006485 / 0.58 = 0.00111810345
G.Calculating Overall Composite
Table 7. Overall Composite
Overall Composite Weight Weight Employee A Employee B Employee C
Attitude .6232 .5513 .2763 .1706
Work quality .2387 .6093 .2633 .3090
Expertise .1372 .1706 .1266 .1093
Composite Weight 0.51241639 0.25240939 0.19507218
composite weight obtained from the column weight multiplied by the employee on each criterion. For example: the value of composite weight of the employee A is 0.51241639 obtained from (0.6232 x 0.5513) + (0.2387 x 0.6093) + (0.1372 x 0.1706)
V. CONCLUSION
From the calculation above it can be concluded that the best employee of the three employees of the above is an employee A value of composite weight 0.51241639 and that need to be considered for further research in this study is the determination of the best decision support system this employee should be able to apply the methods of other decision support system to get a better solution.
R
EFERENCES
[1] S. Bashir and F.M. Shah. Relationship Between Employee Coaching and Organizational Performance in Pakistan. RADS Journal of Social Sciences & Business Management., vol.4, no.1, pp.1-4. 2016.
[2] A.I. Virgolino, A. Coelho and N. Ribeiro. The Impact of Perceived Organizational Justice, Psychological Contract, and the Burnout on Employee Performance: The Moderating Role of Organizational Support, in the Portuguese Context. International Journal of Academic Research in Business and Social Sciences., vol.7, no.1, pp-241-263. 2017.
[3] K. Safitri, F. T. Waruwu and Mesran. Sistem Pendukung Keputusan Pemilihan Karyawan berprestasi dengan Menggunakan Metode Analytical Hierarchy Process (Studi Kasus : PT. Capella Dinamik Nusantara Takengon). Media Informatika Budi Darma., vol.1 no.1, pp.12-16. 2017.
[4] T.A Sykes and V. Venkatesh. Explaining Post-Implementation Employee System Use And Job Performance: Impact Of The Content And Source Of Social Network Ties. MIS Quarterly., vol.41, no. 3, pp. 917-936. 2017.
[5] The Application Of Decision Support System To Identify Children With Intellectual Disabilities. Proceeding of ICECRS., vol.1, pp.415-420. 2016.
[6] Saefudin and S. Wahyuningsih. Sistem Pendukung Keputusan untuk Penilaian Kinerja Pegawai Menggunakan Metode Analytical Hierarchy Pprocess (AHP) pada RSUD Serang. Information System Journal., vol.1, no.1. 2014.