Familial effects on the clinical course
of multiple sclerosis
A.E. Hensiek, MD, PhD; S.R. Seaman, PhD; L.F. Barcellos, PhD; A. Oturai, MD, PhD; M. Eraksoi, MD; E. Cocco, PhD; L. Vecsei, MD; G. Stewart, PhD; B. Dubois, MD, PhD; J. Bellman-Strobl, MD; M. Leone, MD; O. Andersen, MD; K. Bencsik, MD; D. Booth, MD, PhD; E.G. Celius, MD, PhD;
H.F. Harbo, MD, PhD; S.L. Hauser, PhD; R. Heard, MD; J. Hillert, MD, PhD;
K.-M. Myhr; M.G. Marrosu, PhD; J.R. Oksenberg, PhD; C. Rajda, MD; S.J. Sawcer, MD, PhD; P.S. Sørensen, PhD; F. Zipp, MD; and D.A.S. Compston, MD, PhD
Abstract—Background: Familial factors influence susceptibility to multiple sclerosis (MS) but it is unknown whether there are additional effects on the natural history of the disease.Method:We evaluated 1,083 families withⱖ2 first-degree relatives with MS for concordance of age at onset, clinical course, and disease severity and investigated transmission patterns of these clinical features in affected parent-child pairs. Results: There is concordance for age at onset for all families (correlation coefficient 0.14;p⬍0.001), as well as for affected siblings (correlation coefficient 0.15;p⬍0.001), and affected parent-child pairs (correlation coefficient 0.12;p⫽0.03) when each is evaluated separately. Concordance for year of onset is present among affected siblings (correlation coefficient 0.18; p ⬍ 0.001) but not the parent-child group (correlation coefficient 0.08; p ⫽ 0.15). The clinical course is similar between siblings (kappa 0.12; p⬍ 0.001) but not affected parents and their children (kappa⫺0.04;p⫽0.09). This influence on the natural history is present in all clinical subgroups of relapsing-remitting, and primary and secondary progressive MS, reflecting a familial effect on episodic and progressive phases of the disease. There is no concordance for disease severity within any of the considered family groups (correlation coefficients: all families analyzed together, 0.02, p ⫽ 0.53; affected sibling group, 0.02, p ⫽ 0.61; affected parent-child group, 0.02,p⫽0.69). Furthermore, there are no apparent transmission patterns of any of the investigated clinical features in affected parent– child pairs and no evidence for anticipation or effects of genetic loading.Conclusion:
Familial factors do not significantly affect eventual disease severity. However, they increase the probability of a progres-sive clinical course, either from onset or after a phase of relapsing remitting disease. The familial effect is more likely to reflect genetic than environmental conditions. The results are relevant for counseling patients and have implications for the design of studies seeking to identify factors that influence the natural history of the disease.
NEUROLOGY 2007;68:376–383
The clinical and paraclinical expression of multiple sclerosis (MS) differs between individuals. These patterns may merely reflect chance variations in CNS involvement. Alternatively, additional genetic or environmental factors could influence the core pathologic process and produce identifiable pheno-typic variations. A final possibility is that the entity MS could constitute more than one disease, the di-verse phenotypes representing true heterogeneity.
Epidemiologic and family studies implicate ge-netic and environmental factors in determining
sus-ceptibility to MS.1-5 Evidence that these risk factors also influence phenotypic expression is less secure. The recurrence risk in relatives of individuals with MS is significantly increased compared to the back-ground population. Knowledge of familial influences on disease expression therefore has significant impli-cations for counseling families with several affected family members.
Many investigators have assumed that phenotypic variations in MS depend on differences in genetic background and have therefore stratified samples in
From the Department of Clinical Neurosciences (A.E.H., S.J.S., D.A.S.C.), University of Cambridge Clinical School, UK; MRC Biostatistics Unit (S.R.S.), Institute of Public Health, University Forvie Site, Cambridge, UK; School of Public Health (L.F.B.), University of California, Berkley; Danish Multiple Sclerosis Research Centre (A.O., P.S.S.), Department of Neurology, University of Copenhagen, Rigshospitalet, Copenhagen, Denmark; University of Istanbul (M.E.), Turkey; Centro Sclerosi Multipla (E.C., M.G.M.), University of Caglieri, Sardinia, Italy; University of Szeged (L.V., K.B., C.R.), Albert Szent-Gyorgyi Medical and Pharmaceutical Center, Department of Neurology; Westmead Millennium Institute (G.S., D.B., R.H.), Sydney, Australia; University of Leuven (B.D.), Belgium; Institut fuer Neuroimmunologie (J.B.-S., F.Z.), Universitaetsklinikum Charite, Berlin, Germany; Clinica Neurologica (M.L.), Ospedale Maggiore della Carita`, Novara, Italy; Department of Neurology (E.G.C., H.F.H.), Ulleva˚l University Hospital, Oslo, Norway; Department of Neurology (L.F.B., S.L.H., J.R.O.), University of California at San Francisco; Department of Neurology (J.H.), Karolinska University Hospital-Huddinge, Karolinska Institute, Sweden; The Multiple Sclerosis National Competence Centre (K.-M.M.), Department of Neurology, Haukeland University Hospital and Depart-ment of Clinical Medicine Section for Neurology, University of Bergen, Norway; and DepartDepart-ment of Neurology (O.A.), Go¨teborg University Hospital, Sweden.
This work follows from the individual GAMES screens that were supported by the Wellcome Trust (grant 057097). The Nordic study was supported by the EU Commission (project number BMH4-CT97-2422), B.D. is supported by the University Research Council (University of Leuven, Belgium), and F.Z. is supported by grants from the Bundesministerium fu¨ r Bildung und Forschung, Germany.
Disclosure: The authors report no conflicts of interest.
Received February 20, 2006. Accepted in final form October 12, 2006.
order to search for disease modifying genes.6 How-ever, if stratifications are unnecessary or unin-formed, this maneuver will lead to loss of power during analysis.
If genetic risk factors do indeed influence aspects of the natural history, it follows that certain clinical characteristics of MS should cluster in families hav-ing several affected individuals. The available sur-veys provide conflicting results, due either to methodologic variations or the use of sample sizes that are too small for definitive analysis.7-11
Here we report the assessment of familial concor-dance for clinical features of MS in a large cohort comprising 1,083 multiplex families of European origin.
Methods. Clinical resource. We invited all groups participat-ing in the Genetic Analysis of MS in EuropeanS (GAMES)12 to
contribute clinical data from multiplex families. Any combination of first-degree relatives concordant for MS, but not more distant family members, was included in the analysis. The probands were 2,310 individuals from 1,083 families. A total of 564 of these families have been included in previously published surveys on intrafamilial clinical concordance in affected siblings.8,10,11 The
2,310 cases included probands selected on the basis that they met the McDonald diagnostic criteria13(n⫽1,293); fulfilled the Poser
criteria14 for clinically definite (n ⫽ 118), laboratory supported
definite (n⫽126), or clinically probable (n⫽121) MS; matched Goodkin’s diagnostic criteria15(n⫽ 416); had MS proven at
au-topsy (n ⫽ 3); or had the diagnosis confirmed by a neurologist, even though details of criteria used to support that opinion were not available (n⫽233). The clinical data were based on assess-ments made by a specialist in neurology. All the probands gave informed consent for participation; ethical approval for including individuals in the clinical assessments and obtaining blood sam-ples for previous genetic analyses11,12 was obtained from local
committees.
Clinical variables. In addition to basic demographic details, information was collected on the year of assessment, age at dis-ease onset (first symptom thought to be caused by MS), age at diagnosis, previous or current use of disease modifying therapies, clinical course, and Kurtzke expanded disability status scale (EDSS) scores.16
Disease severity was assessed using the Multiple Sclerosis Se-verity Score (MSSS).17Briefly, the MSSS uses an algorithm that
relates scores on the Kurtzke EDSS to the distribution of disabil-ity in patients with comparable disease durations in order to de-rive a rank-based score from 0 to 10 (with two decimal places). Thus, for any given disease duration, current disability can be ranked and allocated to a particular decile. Scores in the middle range represent average disabilities for that disease duration, whereas those with higher or lower scores have more or less accelerated rates of progression.
The clinical course was recorded in the categories relapsing-remitting, secondary progressive, and primary progressive MS, which were defined according to the criteria of Lublin and Rhein-gold.18The diagnosis of definite, probable, and possible primary
progressive MS incorporated findings from MRI and CSF exami-nation19; however, patients assessed before these new criteria
were introduced or in whom particular laboratory investigations were not available for review were included if, in all other re-spects, they fulfilled the criteria for primary progressive MS.
Statistical analysis. Kappa and intraclass correlation coeffi-cient (ICC) were used to measure pairwise concordance. The first was used for the categorical (disease course) and the second for continuous outcome variables (disease progression and age at on-set). A Kappa statistic or ICC close to 1 indicates that a pair of relatives is alike with respect to the outcome variable, whereas a value of 0 indicates that a pair is no more alike than random unrelated couples generated from the sample. Whenever a family contained ⬎2 affected members, all possible pairs were formed and then weighted according to the number of independent pairs
in that family; for example, a family containing three members would be considered as three pairs, each receiving a 2/3 weighting. Disease course was treated both as having three patterns (pri-mary progressive, secondary progressive, and relapsing remit-ting), and also as a binary variable in various combinations (primary progressive vs not primary progressive; relapsing re-mitting vs primary or secondary progressive; relapsing-remitting vs secondary progressive [excluding primary progressive]; primary progressive vs secondary progressive [excluding relapsing-remitting]).
Crude estimates of Kappa and ICC are subject to confounding.7
For example, subjects with more recent dates of birth recruited into the study will have early ages at onset. Since siblings are more likely to have close dates of birth than unrelated individuals, a spurious association for age at onset is created. Conversely, parents and children will have very different dates of birth, thereby reducing any association for age at onset. Individuals with primary progressive MS have a later age at onset and are more likely to be male than probands with bout onset disease.19
Furthermore, most individuals with relapsing-remitting MS will eventually develop secondary progressive disease and disease du-ration therefore has to be considered in the analysis. Kappa and ICC estimates were adjusted for these potential confounders using the method of Lipsitz et al.20 for categorical outcome variables,
and by regressing out the confounders before calculating the ICC for continuous outcome variables. All analyses were adjusted for gender, year of birth, and country. In addition, disease course was adjusted for age at onset and duration of disease. Year at onset was adjusted for disease course. Disease progression was adjusted for duration and course. CIs andpvalues were calculated using Bootstrapping.
The effects of inheritance patterns on the natural history, the influence of parent of origin, and evidence for genetic loading in families with multiple affected cases were examined by multiple regression analysis.
Results. Demographic features and family structures.
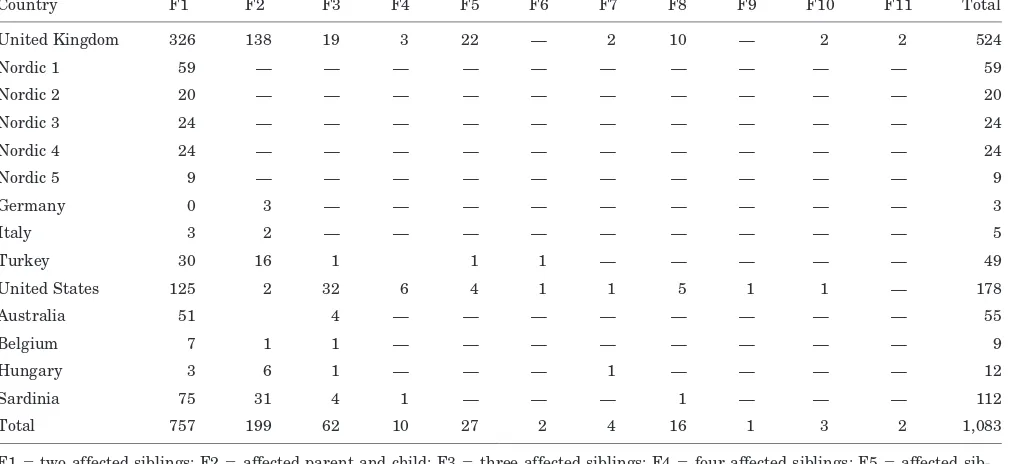
Fourteen groups from 11 countries contributed data relat-ing to 2,310 individuals from 1,083 MS multiplex families (table 1). There were 757 families with 2 affected siblings, 199 families with an affected parent and child, 72 families withⱖ3 affected siblings, and 55 families with more com-plicated structures (table 2).
Since most of the data were obtained retrospectively, some clinical information was not available. Details of age at onset were available for 2,158 individuals. Assessments of the clinical course and disease progression were made in 2,254 and 1,739 cases. Most of the missing data for disease progression were due to disability in the US cohort not having been measured in the standard ranked EDSS mea-surements, but rather in four grouped EDSS categories. Of the 302 index cases with primary progressive MS, 83 had definite, 80 probable, and 14 possible primary progressive disease; laboratory investigations were missing in 125 of these 302 cases. The exclusion of families from analyses requiring those clinical features that were missing reduced the sample size for some subgroup analyses.
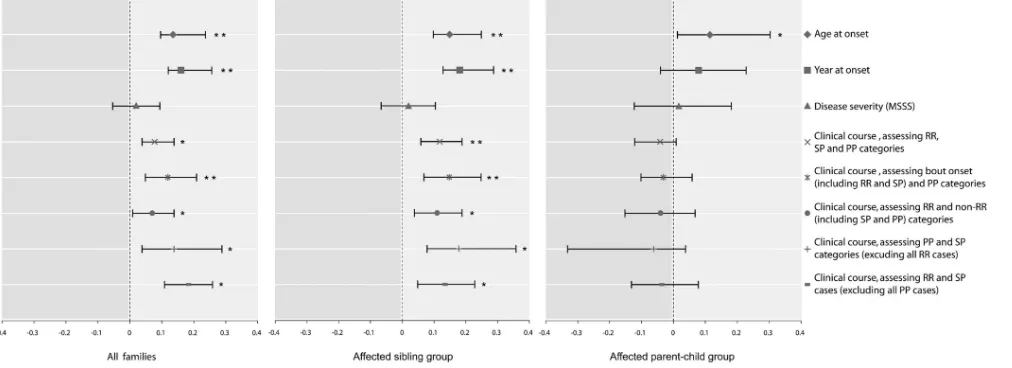
coefficient before adjustment⫺0.05: 95% CI⫺0.14 to 0.13,
p⫽0.96; and after adjustment 0.12: 95% CI 0.01 to 0.30,
p⫽0.03; figure).
In the year of onset analysis, adjusted for gender, year of birth, country, and disease course, we found significant concordance when all families (correlation coefficient 0.16, 95% CI: 0.12 to 0.26; p⬍ 0.001) and the affected sibling
group (correlation coefficient 0.18, 95% CI: 0.13 to 0.29;
p⬍0.001) were evaluated. However, concordance for year of onset was not observed in the affected parent-child group (correlation coefficient 0.08, 95% CI: ⫺0.04 to 0.27;
p⫽0.15; figure).
Clinical course. For the analysis of clinical course con-cordance, we first considered probands in three disease
Table 1Basic demographic and clinical details of included probands
Country N Age, y Male Female
Age at onset, y
Age at diagnosis, y
Mean
EDSS RR SP PP
United Kingdom 1,114 46.4 335 779 29.9 35.9 4.3 549 358 151
Nordic 1 118 47.6 51 67 29.1 35.1 4.9 36 58 24
Nordic 2 40 55.8 14 26 33.5 37.2 5.3 19 8 13
Nordic 3 48 44.3 19 29 28.3 34.6 3.8 28 14 6
Nordic 4 48 48.3 19 29 30.4 32.9 4.6 23 14 11
Nordic 5 18 49.6 7 11 31.5 36.8 3.2 13 3 2
Germany 6 38.9 5 1 24.6 28.3 3.9 3 2 1
Italy 10 37.8 5 5 26.6 27.7 3.6 5 3 2
Turkey 102 39.6 27 75 29 31.6 3.6 70 26 6
United States 416 45.4 115 301 30.3 34.4 N/A 233 145 36
Australia 114 50.5 26 88 N/A 36.9 N/A 74 19 20
Belgium 19 45.3 7 12 28.3 32.4 5.2 8 9 2
Hungary 26 40.5 7 19 26.2 29.5 2.7 20 2 4
Sardinia 231 43 73 158 29.4 34.1 3.9 152 53 26
Total 2,310 46 710 1,600 29.9 35.3 4.2 1,233 714 302
EDSS⫽Expanded Disability Status Scale; RR⫽relapsing-remitting; SP⫽secondary progressive; PP⫽primary progressive; Nordic 1⫽Denmark; Nordic 2⫽Sweden (Huddinge); Nordic 3⫽Norway (Bergen); Nordic 4⫽Norway (Oslo); Nordic 5⫽Sweden (Gøteborg); N/A⫽not available.
Table 2Family structures of included probands
Country F1 F2 F3 F4 F5 F6 F7 F8 F9 F10 F11 Total
United Kingdom 326 138 19 3 22 — 2 10 — 2 2 524
Nordic 1 59 — — — — — — — — — — 59
Nordic 2 20 — — — — — — — — — — 20
Nordic 3 24 — — — — — — — — — — 24
Nordic 4 24 — — — — — — — — — — 24
Nordic 5 9 — — — — — — — — — — 9
Germany 0 3 — — — — — — — — — 3
Italy 3 2 — — — — — — — — — 5
Turkey 30 16 1 1 1 — — — — — 49
United States 125 2 32 6 4 1 1 5 1 1 — 178
Australia 51 4 — — — — — — — — 55
Belgium 7 1 1 — — — — — — — — 9
Hungary 3 6 1 — — — 1 — — — — 12
Sardinia 75 31 4 1 — — — 1 — — — 112
Total 757 199 62 10 27 2 4 16 1 3 2 1,083
categories: relapsing-remitting (1,233 individuals), second-ary progressive (714 individuals), and primsecond-ary progressive (302 individuals). The observed and expected intrafamilial concordance rates within these three groups are summa-rized in table 3.
There was concordance for disease course when all fam-ilies withⱖ2 affected first-degree relatives were analyzed together, before and after adjusting for country of origin, age at onset, year of birth, gender, and disease duration (kappa 0.14: 95% CI 0.09 to 0.18,p⬍0.001; and 0.08: 95% CI 0.04 to 0.14, p⫽ 0.006). Stratification of families into affected sibling and parent-child groups showed that this effect was only derived from the affected siblings, where concordance was stronger than in all families analyzed together, with and without adjustment for potential con-founding factors (kappa 0.20: 95% CI 0.14 to 0.25, p ⬍
0.001; and 0.12: 95% CI 0.06 to 0.19, p ⬍ 0.001; see the figure). Conversely, no concordance for disease course was demonstrated when the affected parent-child group was analyzed separately (unadjusted analysis: kappa ⫺0.14: 95% CI ⫺0.25 to⫺0.02,p ⫽0.02; and adjusted analysis: ⫺0.04: 95% CI⫺0.12 to 0.01,p⫽0.09; see the figure).
The results of this global analysis leave open the ques-tion of whether the concordance in affected siblings is de-rived from all subgroups, defined on the basis of clinical course. We therefore reconsidered these groups in various
combinations, classified on the basis of bouts, and disease progression from onset or after a period of relapses. We first analyzed all relapsing-remitting and secondary pro-gressive case probands as a bout-onset group and com-pared these with primary progressive cases. We then grouped all progressive cases (primary and secondary) and compared these with the relapsing-remitting individuals in order to assess the independent effect of progression, what-ever its clinical context. We compared individuals with bout onset who continued to manifest a relapsing-remitting course with those who had developed secondary progressive MS (excluding primary progression). Finally, after excluding all relapsing-remitting cases from the anal-ysis, we compared only primary and secondary progressive disease courses. The results of these analyses are shown in the figure. Only data that were adjusted for the same covariables are described: however, no one of these adjust-ments did in fact influence the direction or significance of results.
Taken together, these analyses show that, although the intrafamilial correlation is strongest for the comparison of bout-onset vs primary progressive MS, concordance for the disease course in affected siblings is also observed when all cases with disease progression are compared with relaps-ing remittrelaps-ing MS that has not matured to the stage of secondary progression, and when those in whom the
pro-Figure. Intrafamilial correlation for various clinical features of all included families, as well as affected parent-child and sibling pairs analyzed separately. The analyses for age and year at onset are adjusted for gender, year of birth, country of origin, and disease course. The analyses for disease severity as measured by MSSS are adjusted for disease course, ease duration, year of birth, gender, and country of origin. The various analyses for disease course are adjusted for dis-ease duration, age at onset, year of birth, gender, and country of origin. The figure shows correlation coefficients kappa, with 95% confidence intervals.*p⬍0.05; **p⬍0.001.
Table 3Expected and observed concordance rates and number of concordant pairs (N) for clinical course in the considered family groups
All families Affected sibling group Affected parent-child group
Relapsing-remitting Observed; Expected 0.34 (N⫽146); 0.30 (N⫽117)
0.37 (N⫽351); 0.31 (N⫽293)
0.23 (N⫽53); 0.27 (N⫽63)
Secondary progressive Observed; Expected 0.12 (N⫽404); 0.10 (N⫽356)
0.13 (N⫽122); 0.09 (N⫽88)
0.10 (N⫽24); 0.13 (N⫽29)
Primary progressive Observed; Expected 0.032 (N⫽38); 0.017 (N⫽26)
0.038 (N⫽36); 0.018 (N⫽17)
gressive course was preceded by a period of relapses are compared with individuals having progression from dis-ease onset. When primary progressive cases not fulfilling criteria for definite or probable primary progressive MS are excluded, there was a slight increase in the strength of correlations observed for the bout onset vs primary pro-gressive category analysis (kappa 0.13: 95% CI 0.03 to 0.24 for all families; kappa 0.17: 95% CI 0.04 to 0.30 for the affected sibling group, data not shown in the figure), while the same maneuver led to a slight reduction of the correla-tion in the comparison primary vs secondary progressive cases (kappa 0.14: 95% CI⫺0.04 to 0.29; p⫽0.13 for all families analyzed together; and kappa 0.18: 95% CI 0.02 to 0.40; p ⫽ 0.03 for the affected sibling group: data not shown in the figure).
Severity. Since disease severity in MS is increased in individuals with a primary progressive clinical course, and in males, we adjusted our analysis of disease severity, measured by the MSSS, for the covariates clinical course and gender together with country, disease duration, and year of birth. There was no concordance for severity before and after adjustment when all families were analyzed to-gether (correlation coefficient 0.05: 95% CI⫺0.02 to 0.13,
p⫽0.14; and 0.02: 95% CI⫺0.05 to 0.10,p⫽0.53), in the siblings pairs (correlation coefficient 0.07: 95% CI⫺0.02 to 0.16,p⫽0.11; and 0.02: 95% CI⫺0.07 to 0.11,p⫽0.61), or in the parent-child group (correlation coefficient 0.03: 95% CI⫺0.14 to 0.17,p⫽0.86; and 0.02: 95% CI⫺0.12 to 0.18,p⫽0.69) providing no evidence for intrafamilial con-cordance of disease severity (figure).
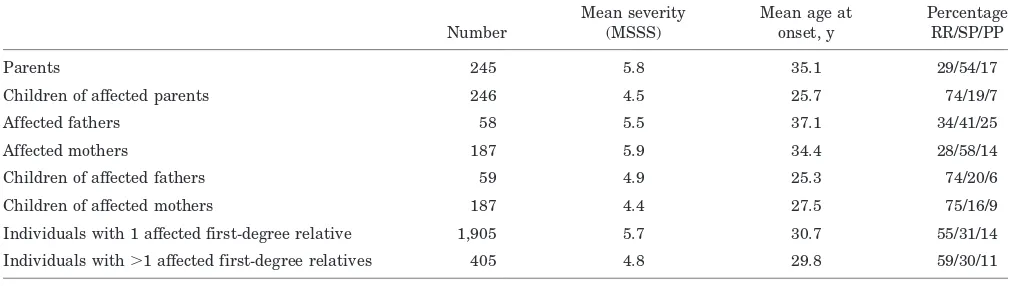
Comparison of parent-child pairs. After adjustment for year of birth, age at onset in children was on average 0.8 (95% CI: ⫺2.5 to 4.1) years earlier than in their af-fected parents but this was not significant (p⫽0.63: table 4). There was no significant difference in the delay be-tween age at onset and diagnosis in children compared to their parent(s) (p⫽0.87).
There was no significant difference in disease severity as measured with the MSSS when affected children were compared with their affected parents (p⫽0.26).
In the parent of origin analysis (adjusted for country, year of birth, and clinical course) we found no difference in disease severity or age at onset when children of affected mothers were compared to children of affected fathers (p⫽
0.08 for age at onset;p⫽0.73 for severity). There was no intrafamilial concordance for disease course when
father-child or mother-father-child pairs were analyzed separately (p⫽
0.72 andp⫽0.25).
Effects of multiple cases within families. Individuals from families with ⬎2 affected first-degree relatives tended to have slower disease progression than probands from families with only two affecteds (⫺0.18 MSSS points: 95% CI 0.02 to 0.34,p⫽0.02), but there was no difference for age at onset (p ⫽ 0.87) or disease course (p ⫽ 0.16: table 4).
Discussion. The aim of this study was to show, using 1,083 multiplex families withⱖ2 affected first-degree relatives, whether familial factors influence the natural history of MS. We confirm that age at onset is similar between all affected family members, with concordance for year of onset also being ob-served in sibling pairs but not parent-child combina-tions. The clinical course is concordant in affected siblings but not the subgroup of parents and their children, although this difference does not eliminate the effect on clinical course when all families are analyzed together. This familial influence on the nat-ural history can be attributed to an effect on disease progression, either from onset or after a period of relapsing-remitting MS. There is no family concor-dance for disease severity, and no evidence for a parent of origin effect or genetic loading.
Previous studies have reported clustering for age at onset in affected siblings8,21-23 or in families with more complex pedigrees.11,24 Others have not repro-duced this finding.10,25,26Concordance for severity be-tween affected family members has also been reported in some9,10,26 but not all series.8,11 Again, whereas course concordance between affected sib-lings is described,8,10 not all investigators have con-firmed this finding.9,27
A critical explanation for the ambiguity of these previous studies is that lack of power has signifi-cantly limited the ability to draw reliable conclusions from subgroup analysis. Previous investigators con-sidered cohorts ranging in size from 85 to 512 indi-viduals, derived from 40 to 250 families. Thus, even the subgroups we studied included significantly larger sample sizes than the totality of most previous
Table 4Clinical variables in the defined groups of affected relatives
Number
Mean severity (MSSS)
Mean age at onset, y
Percentage RR/SP/PP
Parents 245 5.8 35.1 29/54/17
Children of affected parents 246 4.5 25.7 74/19/7
Affected fathers 58 5.5 37.1 34/41/25
Affected mothers 187 5.9 34.4 28/58/14
Children of affected fathers 59 4.9 25.3 74/20/6
Children of affected mothers 187 4.4 27.5 75/16/9
Individuals with 1 affected first-degree relative 1,905 5.7 30.7 55/31/14
Individuals with⬎1 affected first-degree relatives 405 4.8 29.8 59/30/11
surveys. Furthermore, methodologic variation is likely to account for at least some of these inconsis-tencies. For example, in order to characterize disease severity, some investigators simply divide the EDSS score by disease duration to derive a progression in-dex,16whereas others use crude cross-sectional EDSS scores with no correction for disease duration.7,10
The vast majority of probands included in this survey are Caucasian and of European (particularly Northern European) descent. It is therefore possible that this sampling could have introduced genetic bias and that our findings cannot be universally ap-plied to MS families from other ethnic/racial groups. Our sample of families is not strictly population based, and so may be subject to recruitment bias. That said, the individual collections were obtained from investigators to whom notification of a high proportion of prevalent familial cases would be ex-pected, and without any obvious selection for cluster-ing of clinical characteristics. Although there may be a tendency for familial cases to more readily to seek medical attention, the demographic features of our sample are similar to published population-based cohorts.28-30 Nevertheless, in order to minimize the possibility of recruitment bias, we adjusted our anal-yses for country of origin.
Clinical assessments, particularly from multiple sites, can be subject to inter-rater variability, and it is possible that this could have influenced our results in either direction. As most of the data were collected retrospectively, it was not feasible to reassess a co-hort of probands in order to quantify this potential confounder for each group. However, we deliberately limited our clinical endpoints to include only very clearly defined features (age at onset, course, and severity) and used country of origin as a confounding factor in our analyses in order to minimize the ef-fects of inter-rater variability as best as possible.
Assessments of age at onset are limited by the exclusion of relatives who develop symptoms after the completion of data collection. Therefore, we also adjusted our analyses for year of birth in order to control for this potential confounding factor. Individ-uals in whom genetic susceptibility factors are loaded (i.e., familial cases) are expected to develop MS earlier in life, since fewer additional events are then needed for disease expression to manifest. How-ever, most large studies24,28have not shown a differ-ence in age at onset between sporadic and familial patients with MS (although one could speculate that familial cases who have an accumulation of genetic susceptibility risk factors should have a lower age at onset). It therefore seems likely that additional fa-milial risk factors which may not necessarily be linked to disease susceptibility influence age at on-set. It is possible that these additional familial risk factors could partly also influence the inflammatory component of the disease, as has been shown in HLA DR15 positive individuals, who are more likely to be younger at onset.31,32
Our analyses of concordance provide evidence that
familial factors influence the clinical course of MS. This conclusion has implications for the design of future genetic and epidemiologic studies, and in-forms concepts on the pathogenesis of MS.
The effect we observed on course concordance was strongest for the comparison of primary progressive vs bout-onset disease, and increased with the diag-nostic certainty of primary progressive MS. How-ever, there was also significant concordance between siblings when relapsing-remitting and secondary progressive groups were evaluated separately, when all progressive cases were compared with the relapsing-remitting group; and in direct comparison of the primary and secondary progressive cases, indi-cating that the categories of relapsing-remitting, sec-ondary progressive, and primary progressive disease each contributed to the effect on course concordance. Taken together, these data provide evidence for a familial effect on progression either from onset or following a period of relapsing-remitting disease. There are differences between primary progressive and bout-onset forms of MS in sex ratio, age at onset, rates at which disability accumulates, and paraclini-cal abnormalities; and a significant proportion of pa-tients whose illness is progressive from onset have superimposed relapses.19,33 While conversion to dis-ease progression often occurs later in patients with relapsing-remitting MS, some individuals never en-ter the secondary progressive stage. Since progres-sion is considered to reflect tissue atrophy and axonal degeneration in MS,34 it follows that these putative factors may predispose to the neurodegen-erative component. Our findings are best interpreted as indicating that primary progressive, relapsing-remitting disease, and secondary progressive MS represent a continuous spectrum of disease pheno-types in which risk factors drive the relative balance, at any one time, of inflammatory and degenerative contributions to tissue injury. Individuals with a low threshold for neurodegeneration would more proba-bly manifest disease progression, whereas individu-als with a lower risk of this component but more inflammatory activity would tend to the relapsing-remitting phenotype.
disease duration and corrects the EDSS for disease duration in cross-sectional studies.17
Disease progression is often considered to be the harbinger of severity, but we found no evidence that clinical severity is more likely to be similar between two affected family members than a pair of unre-lated individuals with MS. It is possible that an ef-fect on disease severity would have emerged with even larger sample sizes or other methods of severity assessment that include MRI data, upper limb, or cognitive function. However, within the limits of the current study where many data were collected retro-spectively it was not feasible to use these methods of severity assessments. Although we did observe in-trafamilial concordance for clinical course in affected sibpairs, the overall size of this effect is very modest and not associated with clustering of severity in af-fected siblings. Afaf-fected children were no more or less likely to experience severe disease than their affected parent. Furthermore, the gender of the af-fected parent did not influence disease severity in their affected children. These conclusions have sig-nificant implications for the counseling of patients: affected family members should not draw personal conclusions for their own prognosis and expected dis-ease severity from observing the condition of their affected relative(s).
It is important to resolve the issue of whether familial effects can be attributed solely to genetic risk factors or reflect the importance of a shared environment. Our position is that these familial pat-terns are more likely to implicate genetic than envi-ronmental risk factors in mediating predisposition to inflammatory and neurodegenerative aspects of the disease. However, two observations could be inter-preted as indicating a more important and indepen-dent contribution from environmental conditions. Previous investigators have argued that concordance for age at onset implies a genetic contribution to disease susceptibility, whereas exposure to a shared environment would result in concordance for year of onset between affected family members. In addition to the similar age at onset, we found significant con-cordance for year at onset in affected siblings. The evidence for course concordance only in sibling pairs, but not other first-degree relatives, could also be in-terpreted as indicating a contribution from environ-mental factors (which are effective in childhood/ teenage years) in determining course concordance. Siblings may have less genetic sharing than must occur between parents and their children, but they are more likely to share environmental exposure during development.
Overall, the results of this study provide evidence that familial factors significantly influence both sus-ceptibility and the clinical course, but not the even-tual severity, of MS. These data have significant implications for the counseling of patients with af-fected family members. They indicate that the anal-ysis of genetic studies should be stratified (according to clinical course rather than severity) in order to
separate effects that increase susceptibility to MS from those that determine the pattern of tissue in-jury and its clinical expression as disease progres-sion. The independent effect on disease progression further supports the concept that the natural history of MS depends on a complex interplay of inflamma-tory activity in the CNS and axon degeneration.
Acknowledgment
The authors thank the MS societies from the various countries involved for their support in the recruitment of families.
References
1. Robertson NP, O’Riordan JI, Chataway J, et al. Offspring recurrence rates and clinical characteristics of conjugal multiple sclerosis. Lancet 1997;349:1587–1590.
2. Ebers GC, Yee IM, Sadovnick AD, Duquette P. Conjugal multiple sclerosis: population-based prevalence and recurrence risks in off-spring. Canadian Collaborative Study Group. Ann Neurol 2000;48: 927–931.
3. Ebers GC, Sadovnick AD, Dyment DA, et al. Parent-of origin effect in multiple sclerosis: observations in half-siblings. Lancet 2004;363:1773– 1774.
4. Robertson NP, Fraser M, Deans J, et al. Age adjusted recurrence risks for relatives of patients with multiple sclerosis. Brain 1996;119:449– 455.
5. Willer CJ, Dyment DA, Risch NJ, et al. Twin concordance and sibling recurrence rates in multiple sclerosis. Proc Natl Acad Sci USA 2003; 100:12877–12882.
6. Kantarci OH, de Andrade M, Weinshenker BG. Identifying disease modifying genes in multiple sclerosis. J Neuroimmunol 2002;123:144– 159.
7. Robertson NP, Clayton D, Fraser MA, Deans J, Compston DA. Clinical concordance in sibling pairs with multiple sclerosis. Neurology 1996;47: 347–352.
8. Oturai A, Ryder L, Fredrikson S, et al. Concordance for disease course and age of onset in Scandinavian MS co-affected sib pairs. Mult Scler 2000;10:5–8.
9. Brassat D, Azais-Vuillemin C, Yaouanq J, et al. Neurology 1999;52: 1632–1636.
10. Chataway J, Mander A, Robertson N, et al. Multiple sclerosis in sibling pairs: an analysis of 250 families. J Neurol Neurosurg Psychiatry 2001; 71:757–761.
11. Barcellos L, Oksenberg JR, Green A, et al. Genetic basis for clinical expression in multiple sclerosis. Brain 2002;125:150–158.
12. Sawcer S, Compston A. The genetic analysis of multiple sclerosis in Europeans: concepts and design. J Neuroimmunol 2003;143:13–16. 13. McDonald WI, Compston A, Edan G, et al. Recommended diagnostic
criteria for multiple sclerosis: guidelines from the International Panel on the diagnosis of multiple sclerosis. Ann Neurol 2001;50: 121–127.
14. Poser CM, Paty DW, Scheinberg L, et al. New diagnostic criteria for multiple sclerosis: guidelines for research protocols. Ann Neurol 1993; 13:227–231.
15. Goodkin DE, Doolittle TH, Hauser SL, et al. Diagnostic criteria for multiple sclerosis research involving multiply affected families. Arch Neurol 1991;48:805–807.
16. Kurtzke JF. Rating neurological impairment in multiple sclerosis: an expanded disability scale status. Neurology 1983;33:1444–1452. 17. Roxburgh RH, Seaman SR, Masterman T, et al. Multiple Sclerosis
Severity Score: using disability and disease duration to rate disease severity. Neurology 2005;64:1144–1451.
18. Lublin FD, Rheingold SC. Defining the clinical course of multiple scle-rosis: results of and international survey. Advisory committee on clini-cal trials of new agents in multiple sclerosis. Neurology 1996;46:907– 911.
19. Thompson AJ, Montalban X, Barkhof F, et al. Diagnostic criteria for primary progressive multiple sclerosis: a position paper. Ann Neurol 2000;47:831–835.
20. Lipsitz SR, Williamson J, Klar N, Ibrahim J, Parzen M. A simple method for estimating a regression model for kappa between a pair of raters. J R Stat Soc A 2001;164:449–565.
21. Bulman DE, Sadovnick AD, Ebers GC. Age of onset in sibling pairs concordant for multiple sclerosis. Brain 1991;114:937–950.
22. Doolittle TH, Myers RH, Lehrich JR, et al. Multiple sclerosis sibling pairs: clustered onset and familial predisposition. Neurology 1990;40: 1546–1552.
24. AMSG, 1998. Clinical demographics of multiplex families with multiple sclerosis. Ann Neurol 1998;43:530–534.
25. Warren SA, Warren KG,. Influence of gender on susceptibility to multi-ple sclerosis and age of onset in concordant sibships. Int J Epidemiol 1996;25:142–145.
26. Weinshenker BG, Bulman D, Carriere W, Baskerville J, Ebers GC. A comparison of sporadic and familial multiple sclerosis. Neurology 1990; 40:1354–1358.
27. Sadovnick AD, Hashimoto LL, Hashimoto SA, et al. Heterogeneity in multiple sclerosis: clinical manifestations in relatives. Can J Neurol Sci 1990;17:387–390.
28. Ebers GC, Koopman WJ, Hader W. The natural history of multiple sclerosis: a geographically based study: 8: familial multiple sclerosis. Brain 2000;123:641–649.
29. Trojano M, Liguori M, Bosco Zimatore G, et al. Age-related disability in multiple sclerosis. Ann Neurol 2002;51:475–480.
30. Confavreux C, Aimard G, Devic M. Course and prognosis of multiple sclerosis assessed by the computerized data processing of 349 patients. Brain 1980;103:281–300.
31. Hensiek AE, Sawcer SJ, Feakes R, et al. HLA-DR 15 is associated with female sex and younger age at diagnosis in multiple sclerosis. J Neurol Neurosurg Psychiatry 2002;72:184–187.
32. Masterman T, Ligers A, Olsson T, et al. HLA-DR15 is associated with lower age at onset in multiple sclerosis. Ann Neurol 2000;48:211–219. 33. Tullman MJ, Oshinsky RJ, Lublin FD, Cutter GR. Clinical characteristics
of progressive relapsing multiple sclerosis. Mult Scler 2004;10:451–454. 34. Trapp BD, Peterson J, Ransohoff RM, Rudick R, Mork S, Bo L. Axonal
transection in the lesions of multiple sclerosis. N Engl J Med 1998;338: 278–285.
35. Hobart J, Freeman J, Thompson A. Kurtzke scales revisited: the appli-cation of psychometric methods to clinical intuition. Brain 2000;123: 1027–1040.
Neuro
Images
Neck pain and calcium deposition
Hiroyuki Nodera, MD; Shoichiro Takao, MD, PhD; and Ryuji Kaji, MD, PhD, Tokushima, Japan
A 43-year-old man had acute neck pain, sore throat, dysphagia, and low-grade fever upon awakening. His examination was unre-markable except for significantly limited cervical range of motion
due to pain. CT demonstrated calcification anterior to C1-C2 with thickened prevertebral soft tissues due to effusion (figure). Retro-pharyngeal calcific tendinitis is an uncommon condition caused by deposition of calcium hydroxyapatite crystal in the longus colli tendon which provokes local inflammation.1,2The pathophysiology
of the deposition is unknown. Retropharyngeal calcific tendinitis is often misdiagnosed as retropharyngeal abscess but the charac-teristic calcium deposition is diagnostic. It is self-limiting and the calcium deposition usually resolves completely.1
Copyright © 2007 by AAN Enterprises, Inc.
1. Chung T, Rebello R, Gooden EA. Retropharyngeal calcific tendinitis: case report and review of literature. Emerg Radiol 2005;11:375–380. 2. Eastwood JD, Hudgins PA, Malone D. Retropharyngeal effusion in acute
calcific prevertebral tendinitis: diagnosis with CT and MR imaging. Am J Neuroradiol 1998;19:1789–1792.
Figure. (A) The noncontrast CT of the cervical spine revealed amorphous cal-cification of the prevertebral space at the C1-C2 level (arrow) with the expan-sion of the retropharyngeal space (*). The axial and coronal non-contrast CT of the neck (B and C) showed calcifica-tion at the tendon of the longus colli muscle (arrows).
Disclosure: The authors report no conflicts of interest.
DOI 10.1212/01.wnl.0000246116.63050.30
2007;68;383
Neurology
Hiroyuki Nodera, Shoichiro Takao and Ryuji Kaji
Neck pain and calcium deposition
This information is current as of January 29, 2007
Services
Updated Information &
http://n.neurology.org/content/68/5/383.full
including high resolution figures, can be found at:
Supplementary Material
http://n.neurology.org/content/suppl/2007/07/27/68.5.383.DC1
Supplementary material can be found at:
References
http://n.neurology.org/content/68/5/383.full#ref-list-1
This article cites 2 articles, 1 of which you can access for free at:
Subspecialty Collections
http://n.neurology.org/cgi/collection/ct
CT
http://n.neurology.org/cgi/collection/all_spinal_cord
All Spinal Cord
http://n.neurology.org/cgi/collection/all_pain
All Pain
http://n.neurology.org/cgi/collection/all_imaging
All Imaging
following collection(s):
This article, along with others on similar topics, appears in the
Permissions & Licensing
http://www.neurology.org/about/about_the_journal#permissions
its entirety can be found online at:
Information about reproducing this article in parts (figures,tables) or in
Reprints
http://n.neurology.org/subscribers/advertise
Information about ordering reprints can be found online:
Online ISSN: 1526-632X.
1951, it is now a weekly with 48 issues per year. Copyright . All rights reserved. Print ISSN: 0028-3878. ® is the official journal of the American Academy of Neurology. Published continuously since