ABSTRACT
DEGAETANO, SHANE THOMAS. Field-Scale Evaluation of the Water Quantity and Quality Benefits of Blue Roofs Compared to Green and Conventional Roofs (under the direction of Dr. William Hunt)
Green roofs have shown promise in delaying and retaining stormwater, allowing
developers to meet low impact development standards. While research consistently
demonstrates the hydrologic and environmental benefits of green roofs, the expense of
implementation has limited their widespread application. Consequently, stormwater
professionals have developed a substitute, known as blue roofs, which potentially offer
similar hydrologic benefits at a minimized cost. Blue roofs are designed to temporarily detain
stormwater on the rooftop by regulating outflow. Unlike green roofs, blue roofs do not have
soil or vegetation, substantially decreasing construction and maintenance costs.
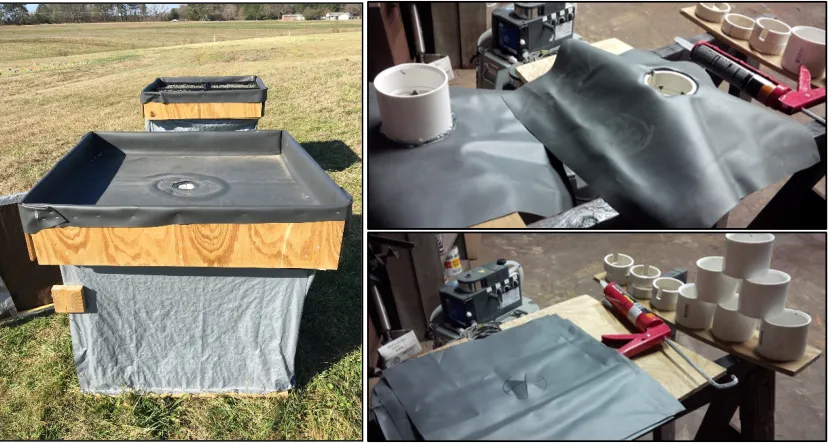
This study compared blue and green roof performance utilizing adjacent blue roof,
green roof and control roof plots. Nine plots (1.5m x 1.5m) were constructed: three of each
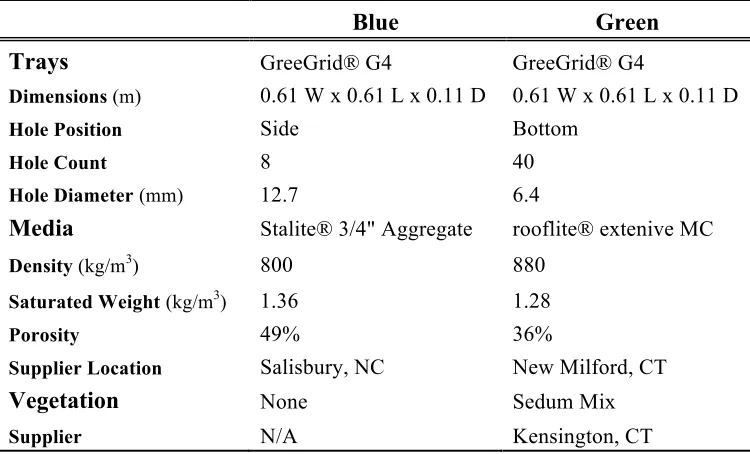
surface type. Blue and green roof treatments used modular trays. Green roof trays had
drainage holes on the bottom, and were filled with standard lightweight expanded shale
media. Green roof trays were vegetated with several types of Sedum selected for optimal growth in mid-Atlantic climates. Blue roof trays had holes drilled on the tray sidewalls, and
were filled with Stalite®, a lightweight, coarse, expanded slate aggregate. Internal drains
routed outflow into collection bins underneath the plots. Bins were outfitted with HOBO®
water level loggers to record water depth to ultimately compute outflow volume, peak flow
and peak flow delay. Water quality samples were manually collected from the bins after each
precipitation event. Samples were tested for total suspended solids (TSS), nitrate/nitrite-N
orthophosphate-P (OP), and total phosphorus (TP). Precipitation data were collected onsite
by both a manual and tipping bucket rain gauge. Additional climatological parameters
measured at a nearby weather station allowed for the calculation of potential
evapotranspiration.
Blue and green roof precipitation retention and peak discharge rates were similar.
Peak flow delay was also similar for blue, green and control roofs, probably due to the small scale of the plot design. Furthermore, blue roof evaporation rates were significantly greater than estimated crop coefficient evapotranspiration rates computed for the green roofs,
suggesting that blue roofs may be more effective at regenerating storage capacity. Blue roofs had lower nitrogen concentrations in outflow, than those of the green
roofs; average green roof TN = 5.9 mg/l and average blue roof TN = 2.9 mg/l. Similarly, TP concentrations in outflow were greater for the green roof (2.7 mg/L) compared to the blue roof (0.3 mg/l). Blue roof nutrient loadings and concentrations were not significantly
different from those of the control, while green roof nutrient loading and concentrations were significantly higher than those of the control and the blue roof.
The results of this study suggest that blue roofs may be a viable alternative to green roofs. The hydrologic benefits of blue roofs are comparable to those of green roofs, and blue roofs discharged lower nutrient loads. Additionally, material cost for blue roofs was
approximately one-third that of green roofs. Lower maintenance needs, reduced structural loading concerns, and ease of implementation further underscore why blue roofs are an
Field-Scale Evaluation of the Water Quantity and Quality Benefits of Blue Roofs Compared to Green and Conventional Roofs
by
Shane Thomas DeGaetano
A thesis submitted to the Graduate Faculty of North Carolina State University
in partial fulfillment of the requirements for the degree of
Master of Science
Biological and Agricultural Engineering
Raleigh, North Carolina 2017
APPROVED BY:
_______________________________ ______________________________
Dr. William F. Hunt III Dr. Richard A. McLaughlin
Committee Chair Committee Member
. ,
DEDICATION
BIOGRAPHY
Shane Thomas DeGaetano was born on July 16th, 1993 to Arthur and Margaret DeGaetano, and raised in Freeville, New York. Growing up, he was influenced by his
parent’s mathematical and scientific pursuits, ultimately leading him to pursue a degree in biological engineering at Cornell University. After receiving his Bachelor’s degree in 2015,
he continued his academic career at North Carolina State University under the direction of Dr. William F. Hunt, III. His work evaluated the treatment potential of an emerging rooftop stormwater control measure. He is excited to begin his professional career back in the greater
ACKNOWLEDGMENTS
There are many people and agencies that I would like to thank for making this project possible: The Clean Water Management trust fund via UNC-Chapel Hill for funding the
project, The Carolina Stalite Company for providing blue roof aggregate and The North Carolina Center for Applied Aquatic Ecology (Linda McKenzie, Jenny James and Zach
Thomas) for their help and flexibility with my water quality sample analysis.
Of course, I would like to thank Dr. Bill Hunt for giving me the opportunity to join the stormwater team. Working and learning with such a talented group was a pleasure; I am
very grateful to have been a part of it. I would like to thank Dr. Devendra Amatya and Dr. Richard McLaughlin for graciously serving on my committee, and providing feedback and
advice throughout the research process. Mr. Shawn Kennedy, thank you for all you help with project design, construction and monitoring; your expertise was instrumental in the project’s success. Next, I want to thank the entire stormwater team. Katy Conroy and Rebecca Purvis,
from recruitment weekend to completing my Master’s, you guys have been a big part of my experience at State. Charlie Stillwell, thank you for letting me ask questions all the time and
for letting me join your soccer team. Jeffery Johnson, Kevin Koryto and Bree Tillet, I appreciate your sage, weathered graduate student wisdom during my first year. Katy Mazer, Will Rogers and Simon Gregg, thank you for helping in the field when I was traveling the
world.
Thank you to my parents for all the support from afar during my time at State. Thank
TABLE OF CONTENTS
LIST OF TABLES ... viii
LIST OF FIGURES ... x
CHAPTER 1: REVIEW OF LITERATURE ... 1
1.1 Introduction ... 1
1.2 Stormwater ... 2
1.3 Green Roof Design and Function ... 5
Extensive Green Roofs ... 6
Intensive Green Roofs ... 7
Design ... 7
Function ... 9
1.4 Green Roof Benefits ... 9
Runoff Quantity Reduction ... 10
Peak Flow Reduction ... 12
Peak Flow Delay ... 13
1.5 Runoff Quality ... 15
1.6 Ancillary Benefits ... 16
Urban Heat Island ... 17
Air Pollution Reduction ... 18
Aesthetic Green Space ... 19
1.7 Green Roof Concerns ... 20
1.8 Water Quality ... 21
1.9 Blue Roofs ... 23
References ... 26
CHAPTER 2: FIELD SCALE EVALUATION OF THE WATER QUANTITY BENEFITS OF BLUE ROOFS COMPARED TO GREEN AND CONVENTIONAL ROOFS ... 33
2.1 Abstract ... 33
2.2 Introduction ... 34
2.3 Site Description ... 36
2.4 Materials and Methods ... 36
Project Setup ... 36
Data Processing ... 46
Statistical Analyses ... 47
2.5 Results and Discussion ... 48
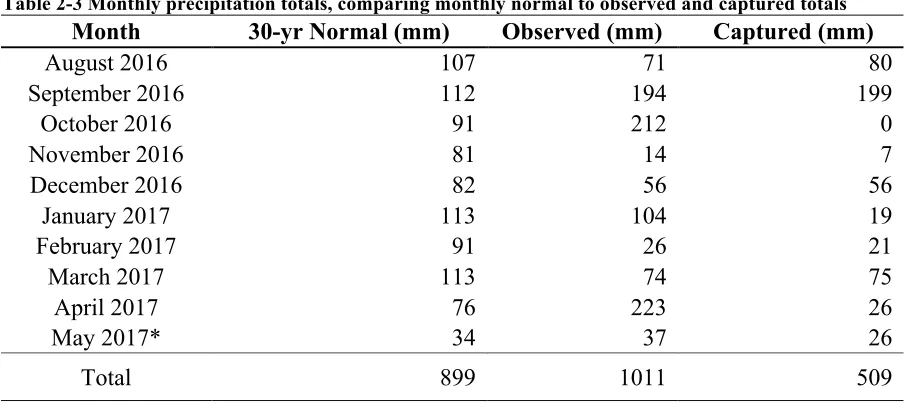
Precipitation ... 48
Runoff Volume ... 50
Peak Flow Mitigation ... 57
Peak Flow Delay ... 60
Blue Roof Evaporation ... 62
Blue Roof Potential ... 67
2.6 Summary and Conclusions ... 68
2.7 References ... 70
CHAPTER 3: FIELD SCALE EVALUATION OF THE WATER QUALITY BENEFITS OF BLUE ROOFS COMPARED TO GREEN AND CONVENTIONAL ROOFS ... 75
3.1 Abstract ... 75
3.2 Introduction ... 76
3.3 Site Description ... 78
3.4 Materials and Methods ... 78
Project Setup ... 78
Water Quality Monitoring ... 85
Climate Monitoring ... 87
Data Processing ... 88
Statistical Analyses ... 88
3.5 Results and Discussion ... 89
Precipitation ... 89
Nitrogen ... 90
Nitrogen Loading ... 95
Phosphorus ... 96
Total Suspended Solids ... 100
Annual Loading ... 103
Results in Context ... 105
3.6 Summary and Conclusions ... 108
3.7 References ... 110
4.2 Design Recommendations and Future Research ... 117
4.3 References ... 120
APPENDICES ... 122
Appendix A: Research Project Site ... 123
Appendix B: Green Roof Media Specifications ... 124
Appendix C: Blue Roof Aggregate Specifications ... 125
Appendix D: Stage-Storage Relationship ... 126
Appendix E: Summary of Climate Monitoring Equipment ... 127
Appendix F: Complete Water Retention Data ... 128
Appendix G: SAS Code ... 130
Water Quantity Analysis ... 130
Water Quality Analysis ... 132
Appendix H: SAS Model Verification ... 134
Water Quantity Analysis ... 134
Water Quality Analysis ... 138
Appendix I: Evaporation Data ... 142
Appendix J: Analytical Methods – Solid Sample Analysis ... 145
LIST OF TABLES
Table 1-1 Summary of commonly reported green roof hydrologic performance
measures ... 14
Table 1-2 Summary of reported green roof NPV compared to conventional roofs ... 21
Table 1-3 Summary of water quality results in green roof literature ... 22
Table 2-1 Treatment materials used to construct plots ... 43
Table 2-2 Treatment materials used to construct plots ... 45
Table 2-3 Monthly precipitation totals, comparing monthly normal to observed and captured totals ... 48
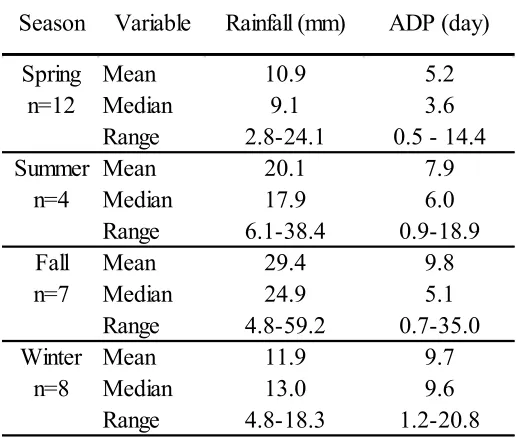
Table 2-4 Descriptive statistics of Seasonal storm distribution ... 49
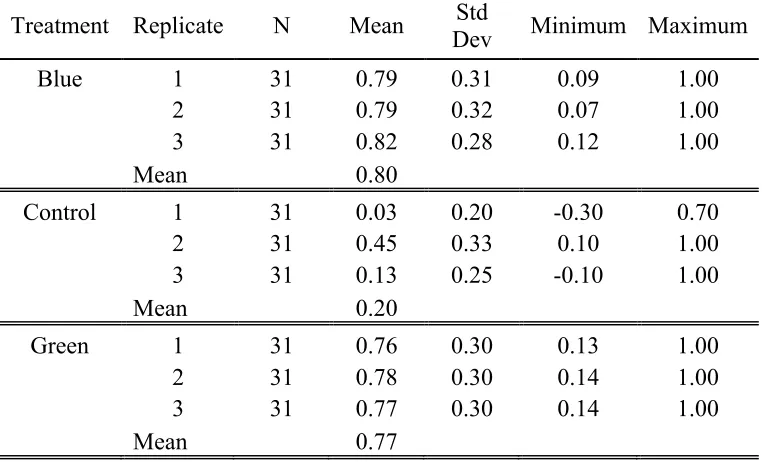
Table 2-5 Descriptive statistics describing retention data separated by treatment and replicate. ... 52
Table 2-6 Rainfall distribution by storm size for study period and 30-year normal. ... 55
Table 2-7 Summary of peak flow data separated by replicate and treatment ... 61
Table 2-8 Descriptive Statistics of evaporation rates for blue roof trays (mm/day) ... 63
Table 3-1 Summary of materials used to construct the three treatment plots ... 84
Table 3-2 Lab analytical methods and reporting limits ... 86
Table 3-3 Monitoring equipment ... 88
Table 3-4 Descriptive statistics for rainfall events resulting in water quality samples (mm) ... 90
Table 3-5 Water quality events ... 90
Table 3-6 Total Kjeldahl Nitrogen concentration descriptive statistics by treatment and replicate (mg/L) ... 92
Table 3-7 Nitrate-Nitrite concentration descriptive statistics by treatment and replicate (mg/L) ... 92
Table 3-8 Ammoniacal Nitrogen concentration descriptive statistics by treatment and replicate (mg/L) ... 93
Table 3-9 Total Nitrogen concentration descriptive statistics by treatment and replicate (mg/L) ... 93
Table 3-10 Average pollutant concentrations (B3 excluded). Superscripts indicate significant differences among treatments ... 95
Table 3-11 Total nitrogen loading from the plots ... 95
Table 3-12 Ortho-Phosphorus concentration descriptive statistics by treatment and replicate (mg/L) ... 97
Table 3-13 Total Phosphorus concentration descriptive statistics by treatment and replicate (mg/L) ... 98
Table 3-14 Average pollutant concentrations (B3 excluded). Superscripts indicate significant differences among treatments ... 99
Table 3-15 Total phosphorus loading from the plots ... 99
Table 3-16 Total Suspended Solids concentration descriptive statistics by treatment and replicate (mg/L) ... 101
Table 3-17 Average TSS concentrations and cumulative load from each treatment. Superscripts designate statically significant differences ... 103
Table 3-19 Comparison of previous green and control roof studies TN and TP
LIST OF FIGURES
Figure 1-1 (a) Extensive Green Roof in Muncie, IN. (b) Intensive Green Roof in
Houston, TX. (Retrieved from GreenGrid) ... 5
Figure 1-2 (a) Green Roof Layer schematic (Retrieved from Restoration Gardens Inc.) (b) Typical drainage layer (Retrieved from Urbanscape) ... 8
Figure 1-3 (a) Modular tray blue roof system (b) Typical blue roof layers (Retrieved from NYCDEP) ... 23
Figure 2-1 Constructed nine plot replicates with tarps for wind control ... 37
Figure 2-2 Roof plot layout showing three replicates of the three treatments ... 37
Figure 2-3 a) Control roof. b) PVC slip coupling and square liner pieces pre-and post-assembly ... 38
Figure 2-4 a) PVC affixed liner placed in plot surface hole prior to being covered with plot liner. b) Centralized PVC drain extended below the roof surface attached to PVC coupling extending through drainage hole ... 39
Figure 2-5 Shop drawings of GreenGrid G4 green roof modules (provided by GreenGrid ®) ... 39
Figure 2-6 Sedum at full maturity in Mid-July ... 40
Figure 2-7 Schematic drawing of modified drainage holes for blue roof application .... 41
Figure 2-8 Stalite® in blue roof trays ... 42
Figure 2-9 Central drain emptying into storage bin. HOBO® logger is stored in a 3.8 cm PVC resting at the bottom of the bin ... 43
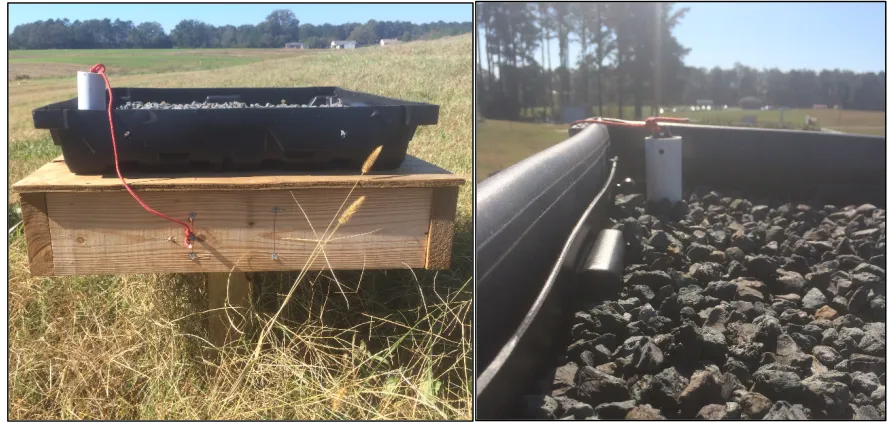
Figure 2-10 (a) Stand-alone blue roof tray equipped with Water level logger (Evap1) (b) Water level logger installed on blue roof plot (Evap2) ... 45
Figure 2-11 Green roof plot with manual and tipping bucket rain gauge in the background ... 46
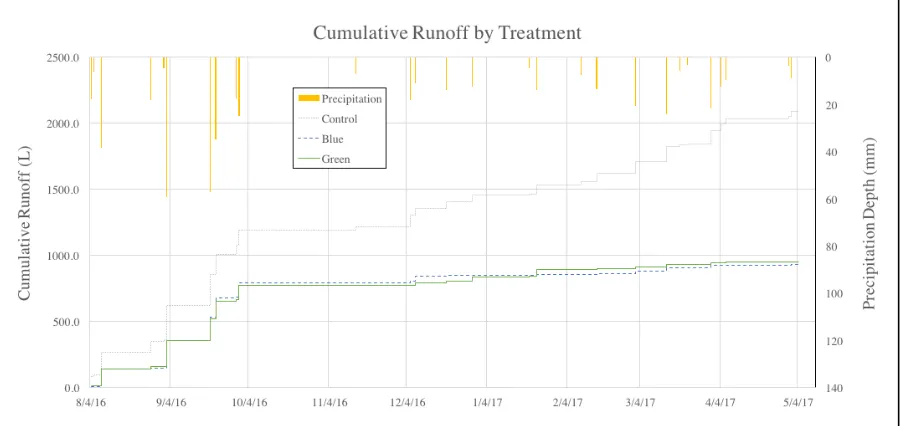
Figure 2-12 Cumulative outflow from each treatment over the sampling period ... 51
Figure 2-13 Outflow volume reduction plotted against precipitation volume, which is the precipitation depth multiplied by the plot surface area ... 53
Figure 2-14 Decreased rainfall retention resulting from short antecedent dry periods. Asterisk signifies significantly lower reduction than preceding event. ... 56
Figure 2-15 Seasonal precipitation retention of the three treatments ... 57
Figure 2-16 Average hydrograph from three replicates of each treatment. This 38-mm storm occurred on 8/8/16 ... 58
Figure 2-17 Distribution of peak discharge data separated by treatment type. B = Blue, G = Green and C = Control. Lines represent median of the data set, dots represent the mean ... 59
Figure 2-18 Water level over time Evap1, illustrating evaporative loss ... 62
Figure 2-19 Water level over time in Evap2, illustrating daily evaporation loss ... 63
Figure 3-1 Roof plot layout showing constructed replicates of the three treatments ... 79
Figure 3-2 Ariel view of roof plot layout showing three replicates of the three treatments ... 79
Figure 3-4 a) PVC affixed liner placed in plot surface hole prior to being covered with plot liner. b) Centralized PVC drain extended below the roof surface attached to PVC
coupling extending through drainage hole ... 81
Figure 3-5 Shop drawings of GreenGrid G4 green roof modules (provided by GreenGrid ®) ... 82
Figure 3-6 Sedum plant on green roof plot, shown at full maturity in Mid-July ... 83
Figure 3-7 Schematic drawing of modified drainage holes for blue roof application .... 83
Figure 3-8 Stalite® substrate in blue roof trays on a roof plot ... 84
Figure 3-9 Central drain, emptying into runoff storage bin ... 85
Figure 3-10 Green roof plot with manual and tipping bucket rain gauge in the background ... 87
Figure 3-11 TN cumulative load and concentrations over the course of the monitoring period (B3 included) ... 96
Figure 3-12 Treatment’s cumulative TP load and concentration over time ... 100
Figure 3-13 After construction in 8/16 G3 (background) shows significantly less sedum growth than G2 (foreground) ... 102
Figure 3-14 Green roof TSS load by storm ... 102
Figure 3-15 Control roof (left) and green roof (right) outflow color ... 103
Figure 3-16 Treatments TN concentration ranked in increasing order, with benthos based water quality thresholds ... 106
Figure 3-17 Treatment’s TP concentration ranked in increasing order, with benthos based water quality thresholds ... 107
Figure A-1 Research project site. Locations of roof plots and CRONOS station are emphasized... 123
Figure A-2 Green roof media specifications: extensive mc standard was used in this study ... 124
Figure A-3 Stalite ¾” aggregate specifications ... 125
Figure A-4 Sensor depth recording after known volume of water was added to runoff collection bin (trial 1) ... 126
Figure A-5 Sensor depth recording after known volume of water was added to runoff collection bin (trial 2) ... 126
Figure A-6 Summary of available weather monitoring equipment at the Lake Wheeler Rd. Field Lab CRONOS Station ... 127
Figure A-7 Distribution of concentrations for various nitrogen species, separated by treatment. ... 129
Figure A-8 Residual Distribution by treatment for outflow reduction model ... 134
Figure A-9 Modeled residuals vs. predicted residuals for outflow reduction model .... 134
Figure A-10 Outflow reduction boxplot separated by treatment type ... 135
Figure A-11 Residual Distribution by treatment for peak flow delay model ... 135
Figure A-12 Modeled residuals vs. predicted residuals for peak flow delay model ... 136
Figure A-13 Peak flow delay boxplot separated by treatment type ... 136
Figure A-14 Residual Distribution by treatment for peak flow model ... 137
Figure A-15 Modeled residuals vs. predicted residuals for peak flow model ... 137
Figure A-16 Peak flow boxplot separated by treatment type ... 138
Figure A-18 Predicted vs. modeled residuals for NO3-NO2 concentration and load .... 139
Figure A-19 Predicted vs. modeled residuals for TN concentration and load ... 139
Figure A-20 Predicted vs. modeled residuals for TN concentration and load ... 140
Figure A-21 Predicted vs. modeled residuals for Ortho-P concentration and load ... 140
Figure A-22 Predicted vs. modeled residuals for TSS concentration and load ... 141
Figure A-23 Predicted vs. modeled residuals for TP concentration and load ... 141
Figure A-24 T-tests for Evap1 testing for significant difference between BR evaporation and estimated GR evapotranspiration using two methods: crop coefficient (right) and reference crop (left) ... 144
Figure A-25 T-tests for Evap2 testing for significant difference between BR evaporation and estimated GR evapotranspiration using two methods: crop coefficient (right) and reference crop (left) ... 144
Figure A-26 Relationship between outflow volume a precipitation depth for rainfall events greater than 13 mm ... 146
Figure A-27 Summary of validation calculations for methods used to estimate June and July TN, TP loads ... 147
Figure A-28 TN concentration as a function of storm size, separated by treatment .... 148
Figure A-29 TP concentration as a function of storm size, separated by treatment .... 148
CHAPTER 1: REVIEW OF LITERATURE 1.1Introduction
It is well documented that urbanization adversely impacts the environment. Impervious
surfaces, like pavement and rooftops, constitute a particularly drastic alteration to the hydrological system. This coverage hinders drainage and transpiration, increases storm
runoff volume and rate, and increases nonpoint source (NPS) pollutant loads (Paul and Myer, 2001). Increasingly, stormwater professionals seek to improve water quality by designing stormwater control measures (SCMs) that simulate the natural conditions prior to
development. While these practices have been shown to effectively treat and reduce
stormwater, they take up a considerable amount of surface area -- posing difficulty in densely
populated urban areas where runoff issues are the most problematic. Stormwater engineers recognized that rooftops compose 40-50% of impermeable area in cities (Dunnett & Kingsbury, 2004). In response, rooftop SCMs, known as green roofs, were developed.
Green roofs are vegetated roof systems designed to detain and retain rainfall by regulating outflow and evaporating stored water (Czemiel Berndtsson, 2010). The overall
objective is to improve urban water balance to more closely mimic that of a natural
hydrologic system. The performance of a SCM is generally measured by its ability to reduce runoff volume and to delay and mitigate the peak flow. These components of runoff are
closely linked to numerous adverse impacts like channel widening, bank failure, habitat loss and pollution (Paul and Meyer, 2001); by controlling stormwater runoff, these impacts can be
Keeler, 2008; Clark et al., 2008), deterring potential consumers from implementing these systems. Some studies have attempted to calm economic concerns by showing that, despite high initial costs, the overall benefits associated with green roofs yield a positive net present
value (Clark et al., 2008; Niu et al., 2010). Contradictory studies have shown that despite the advantages of living roofs they are still more costly than conventional roofs (Bianchini et al.,
2012; Carter and Keeler, 2008; Sproul et al., 2012). Additional disagreement regarding water quality of green roof runoff further promotes the need for a green roof alternative (Berghage et al., 2009; Berndtsson et al., 2006; Gong et al., 2014; Hathaway et al., 2008).
Recently, blue roofs have emerged has a promising alternative to the well-studied benefits that green roofs provide over conventional roof systems (NYCDEP, 2011). While
blue roof design can vary slightly, the general principles remain constant: temporarily detain precipitation using flow control to regulate water leaving via roof drains. Blue roofs, like green roofs, have the potential for use in low impact development, as they appear to be able
to reduce runoff volumes and rates (NYCDEP, 2011). There are currently no peer-reviewed blue roof monitoring results. Although blue roofs cannot match the aesthetic appeal of green
roofs, less frequent maintenance and less expensive material may result in a cost effective substitute to green roofs.
1.2Stormwater
Global water quality has degraded severely since the onset of the industrial age. The importance of protecting national water resources was not recognized until the late 20th
Nevertheless, by the 1980's, professionals recognized that focusing solely on point source pollution insufficiently improved water quality; non-point source pollution (including stormwater runoff) needed treatment as well. This claim is supported by EPA studies that
found urban stormwater runoff to be the second leading source of water quality degradation in lakes and estuaries and the third leading source in streams and rivers (U.S. EPA. 1994).
Runoff is generated from precipitation falling on impervious surfaces. Considering urbanization and development increase impervious land cover, such land use changes have elevated concerns associated with stormwater runoff. As development rates trend upwards,
the resulting hydrologic alterations will cause dramatic increases in urban runoff. According to the United Nations Development Project (2014) the number of urban dwellers will rise
from 3.8 billion in 2014 to 7.4 billion in 2050. From 1950 to 2050, it is expected that the worldwide urban population will increase by 33% (UNDP, 2014). The resulting urban growth is expected to increase developed lands by 19%-23% by 2100 (Bierwagen et al.,
2010), promoting further hydrologic alteration and causing a myriad of stormwater related issues.
It is well documented that impervious land coverage disrupts the hydrologic regime in urban areas, ultimately impairing nearby water resources. (Arnold and Gibbons, 1996; Carlson and Arthur, 2000; Carlson, 2004). Elevated impermeable coverage diminishes water
quality through several functions. Traditional stormwater sewer system design emphasized commuter safety, routing stormwater away as quickly as possible. While this system may
and stormwater systems (Rowe, 2011). Rain events can trigger combined sewer overflows (CSO) when runoff volume exceeds sewer capacity. These events are relatively common -- they can be caused by precipitation events as small as 30 mm (Montalto et al., 2007). In New
York City, CSOs dump 40 billion gallons of untreated wastewater into surface waters every year (Cheney, 2005). The EPA designates CSOs as the leading cause of pollution in national
lakes rivers and estuaries, estimating an abatement cost of 44 billion dollars (U.S. EPA, 2002b).
Aside from CSOs, increased runoff from urbanization can deteriorate water quality
through several other functions. As the surface area covered by impermeable surfaces increases, the velocity and volume of surface runoff rises accordingly. Consequently,
receiving rivers and streams are subject to increased watershed flashiness causing faster rates of erosion coupled with crippling habitat loss (Paul and Meyer, 2001). Additionally, elevated concentrations of nutrients, metals and other contaminants are commonly linked to runoff
from urban areas (Dunne and Leopold, 1978; Paul and Meyer, 2001). Stormwater engineers developed SCMs to control runoff in highly impervious areas and combat the adverse
impacts of urban runoff.
When designing an SCM, the engineer’s goal is to address both water quantity and quality concerns. Water quality goals include reducing concentrations of known
environmental contaminants like nitrogen, phosphorus and heavy metals. Water quantity goals generally focus on not only reducing total runoff and peak flow volume but also
Large-scale stormwater control systems are land-intensive, posing a problem in dense urban areas where available land is already limited. In response, stormwater engineers turned to rooftops as potential SCM sites. In highly urbanized regions, rooftops compose a large
fraction of the total impervious area (Dunnett and Kingsbury, 2004); generally, these
rooftops are unutilized. Green roofs have recently emerged as the most common technology
to capitalize on the opportunity for stormwater control that rooftops offer. 1.3Green Roof Design and Function
Green roof practices are divided into two classifications, extensive and intensive. The
main difference between the treatments is the depth of the media layer: extensive roofs have shallower media relative to intensive roofs. The shallower media depth in extensive roofs
limits the type and biodiversity of vegetation that can be established. Therefore, an intensive treatment is the more aesthetically pleasing option, as it can support large plants like trees and shrubs. The visual differences between these two treatments can be seen in Figure 1-1 (a)
and (b). While both offer effective stormwater quantity and quality control, the magnitude of the benefits and cost effectiveness vary with each practice.
(a) (b)
Extensive Green Roofs
Of the two green roof designs, extensive green roofs are implemented more frequently than their intensive counterpart (Carson et al., 2013). A variety of factors can be attributed to
the relative ubiquity of extensive compared to intensive. Generally, extensive systems are used to retrofit existing roofs because of their lighter weight requirements (Voyde et al.,
2010).
The North Carolina State Department of Environmental and Natural Resources
(NCDENR) stormwater BMP manual specifies a minimum media depth of 4 in (NCDENR,
2007), which is consistent with alternative media depth specifications provided in other sources (Voyde et al., 2010; Carson et al., 2013; Gregoire and Clausen, 2011). A thinner
substrate layer substantially decreases the weight of the system, ultimately reducing loading concerns allowing for widespread implementation. The NCDENR limits extensive green roof loading to 35 psf (NCDENR, 2007). To meet this criterion, rooftop gardens use lightweight
substrate composed primarily of expanded shale.
Because of the thinner media layer, extensive green roofs feature short rooting depth,
drought resistant plants able to withstand the harsh rooftop conditions. Low-growing succulents, predominantly Sedums are the established vegetation for extensive vegetated roofs (Berghage et al., 2007; Durhman et al., 2006; Maclvor and Lundholm, 2011; Snodgrass
and Snodgrass, 2006). Sedums are ideal for green roof application because they exhibit crassulacean acid metabolism (CAM), allowing them to readily adapt to water stress
Lundholm (2011) stress the importance of not overusing sedum monocultures, claiming that overemployment may cause challenges with insects and disease. Additionally, overall ecosystem health would be affected by the limited diversity (Nagase and Dunnett, 2012).
Intensive Green Roofs
Converse to extensive green roofs, intensive systems have a deeper substrate allowing for
vegetated roofs with greater diversity and plant biomass (Speak et al., 2013). Larger plants and more substrate are accompanied by greater loading concerns. Intensive green roofs are almost exclusively built-in-place (Morgan et al., 2013), meaning the green roof is built as a
single unit on top of the roof membrane. Because of structural considerations, intensive green roofs are typically included in plans when a building is being constructed; retrofitting an
existing roof with an intensive system is rare. Although intensive green roofs can be more aesthetically pleasing, heightened structural concerns (80+ psf) coupled with high
maintenance costs make intensive systems the more expensive and less utilized option
(Bianchini and Hewage, 2012). Design
While structure and vegetation varies, the design of intensive and extensive roofs is relatively similar. A typical layering schematic can be seen in Figure 1-2 (a). The bottom layer of a green roof is the roof construction. The existing roof must have a waterproofing
layer so that water cannot penetrate into the roofing material. Above the membrane is the retention and protection layer, which acts as a root barrier. Protection layers often contain
rainwater, and then allow excess water to flow away once the cup capacity has been reached. Once precipitation has ceased, these cups act as water storage units allowing for uptake by vegetation during dry periods.
A filter fabric mat is placed on top of the drainage layer. This layer ensures that the drainage mat remains unclogged so water can flow freely from the system. Next is the media layer. Depending on the practice being used, the media thickness is typically less than 10 cm
(≈4 in) for extensive roofs and ranges up to 120 cm (≈50 in) for intensive practices (Kosareo and Ries, 2007); although there are not definitive criteria. Media is designed to be a suitable
physiochemical environment for root growth, and yet be sufficiently lightweight to meet rooftop-loading requirements (Berghage et al., 2007). Expanded shale is commonly used because it has a high volume of pore space, allowing inflowing rainfall to be retained within
the substrate (Berghage et al., 2007). The vegetation layer also differs between the two treatments. As discussed previously, extensive roofs can support shallow rooting plants,
mainly Sedums, while intensive roofs can support a larger array of vegetation.
(a) (b)
Function
The ideas behind green roof function are not complex. Outflow occurs when both the soil media reaches field capacity and the drainage layer has been filled. Depending on the design,
the amount of precipitation necessary to initiate outflow varies. In some cases, smaller storms will not generate any outflow as the entirety of the rain is retained in the roof layers (Carter
and Jackson, 2007). Conversely, when the precipitation event exceeds the system’s storage capacity, a few key benefits can be achieved: overall outflow and peak flow volume are reduced and the timing of peak flow is delayed (Denardo et al, 2005; Hathaway et al., 2008;
Voyde et al., 2010). By doing so, green roofs limit the adverse effects of an urbanized watershed (Carter and Jackson, 2007).
Precipitation that remains on the roof once rainfall has ceased either returns to the natural water cycle via evapotranspiration or becomes outflow at the onset of the next storm event (Berghage et al., 2007; Bliss et al., 2009; Hathaway et al., 2008). Evidently, the number of
days between rainfall events plays a considerable role in the hydrologic performance of green roofs (Wadzuk, 2013). Even a small rainfall event, closely following precipitation that
initiated outflow, will readily trigger outflow because the roof will be at (or close to) its water storage capacity. Systems that are able to quickly evaporate and transpire excess storm water will more readily store new water; bolstering their overall hydrologic performance
through higher rates of stormwater retention (Poë et al. 2015).
1.4Green Roof Benefits
Living roofs offer widespread environmental benefits ranging from stormwater
following section reviews currently available knowledge regarding the environmental benefits of green roofs.
Runoff Quantity Reduction
The hydrologic performance of a green roof is measured by the amount of precipitation it retains. Other hydrologic goals are also used to quantify green roof
performance, including peak flow volume reduction and peak flow delay. By achieving these objectives, green roofs can curb the negative hydrologic effects of urbanization and limit CSO occurrences.
Runoff Volume Reduction
The percent of annual rainfall retained is usually reported as the principal measure of
green roof performance. The more precipitation that is retained; the less roof runoff can occur. While the magnitude of retention varies, a majority of studies show that vegetated roofs are an effective method to reduce rooftop runoff (Czemiel Berndtsson, 2010,
Vijayaraghavan, 2016). Table 1-1 summarizes runoff reduction findings presented in reviewed literature. Annual retention ranges from 34% to 80.2%. The disparity among
reported values stems from experimental differences including climatological and design factors. Because project set-ups can be drastically different, direct study comparisons are difficult. Nevertheless, there is collective agreement among studies that green roofs do
reduce runoff.
Ability to retain moisture is closely linked to weather conditions and green roof
(Czemiel Berndtsson, 2010). If green roof layers are saturated from a previous storm, new precipitation will rapidly generate runoff. Conversely, during dry periods, smaller storms can be totally retained. It is accepted that as rainfall increases, the percent of stormwater retained
decreases (Carson et al., 2013; Carter and Rasmussen, 2006; Hathaway et al., 2008;
VanWoert et al., 2005). Therefore, green roofs with larger retention capacities (deeper media
and more pore space) that are able to effectively evapotranspire will perform better. Building on these fundamental ideas, researchers are exploring other sources of discrepancy among reported retentions in order to establish better models and more accurate results.
Some studies reported seasonal stormwater quantity reduction findings. The reviewed literature agrees that temporal rainfall reduction patterns exist: higher reduction in the
summer, lower reduction during the winter (Berghage et al., 2009; Carson et al., 2013; Hathaway et al., 2008, Stovin et al., 2012). The warm season has higher evapotranspiration rates and, therefore, regenerates roof retention capacity faster (Carter and Rassmussen, 2006;
Mentens et al., 2006; Speak et al., 2013). Evidently, seasonal trends influence reported annual retention rates – as sampling periods occur over different seasonal spans.
Similarly, Carson et al. (2013) introduced another climatological bias that contributes to disparity in stormwater volume reduction. This study illustrated the idea that differences in rainfall distributions during sampling would impact overall green roof rainfall retention.
During “wetter” years, compared to the normal, vegetated roofs would have a higher probability of saturation, and in these cases, would be unable to retain rainfall. Modeled
and should not only be accounted for when modeling green roof performance but also be considered when reporting measured results.
Peak Flow Rate Reduction
Peak flow rate is the largest flow rate on the hydrograph of a storm event. Peak flow is commonly used as a measure of stormwater impact because maximum erosion is typically
correlated to peak flow (Dunne and Leopold, 1978). High peak flows caused by intense precipitation can cause amplified stream flow velocities, which can increase stream bank erosion (Paul and Meyer, 2001). Numerous studies (Denardo et al., 2005; Hathaway at al.,
2008; Stovin, 2010; Voyde et al., 2010; Carpenter and Kaluvakolanu, 2011; Stovin et al., 2012; Fassman-Beck et al., 2013) have explored green roof ability to reduce peak flow rate;
the reported percent reductions can be seen in Table 1-1. Analogous to overall retention, although the magnitude of reduction varies, the reduction trend is consistent throughout the literature. By detaining rainfall, green roofs reduce collective downstream flow. Substantial
peak flow reduction curbs flash flooding events in highly impervious areas thereby aiding in lessening stream bank erosion due to decreased runoff flow velocities from green roofs.
Reported percent peak flow rate reduction ranges from 44% to 89%. Similar to rainfall retention, peak flow reduction is heavily dependent on the antecedent dry period (Stovin, 2010) and storm size (Carpenter and Kaluvakolanu, 2011). However, parameters
known to influence rainfall retention do not necessarily have a comparable impact on peak flow reduction. Voyde et al. (2010) showed that successive rainfall events do not influence
propose that a more flow resistant drainage media may promote better green roof performance in terms of peak flow reduction.
Bengtsson (2005) conducted a study in which green roofs with and without a drainage
layer were monitored to determine the effect that absence of a drainage layer has on peak flow rate. Interestingly, it was found that the roof without a drainage mat, actually generated
runoff more slowly resulting in a lower peak flow. From this Bengtsson (2005) suggested that green roofs without drainage layers could significantly reduce runoff peak flow rates. This result seemingly contrasts conclusions made by Fassman-Beck et al. This contradiction
underscores the need for further research into the dynamics of green of drainage layers pertaining to peak flow reduction.
Peak Flow Delay
In addition to peak flow rate reduction, green roofs can delay the occurrence of peak runoff, potentially helping to alleviate the negative impacts related to urbanized watersheds.
Green roofs act as detention basins by delaying the conveyance of water. As a result, green roofs are able to reduce the cumulative peak flow downstream effectively diminishing
erosional effects and minimizing the potential for CSOs (Li and Babcock, 2014). Several studies (Denardo et al., 2005; Carter et al., 2006; Voyde et al., 2010; Carpenter and Kaluvakolanu, 2011; Stovin et al., 2012; Speak et al., 2013) have explored green roof’s
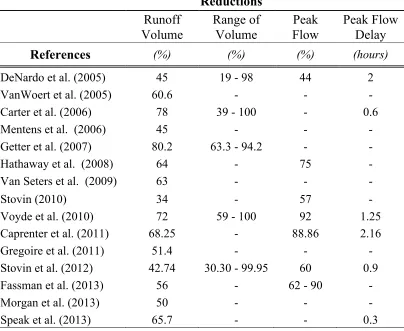
Table 1-1 Summary of commonly reported green roof hydrologic performance measures
Reductions
Runoff
Volume
Range of
Volume
Peak
Flow
Peak Flow
Delay
References
(%) (%) (%) (hours)DeNardo et al. (2005) 45 19 - 98 44 2
VanWoert et al. (2005) 60.6 - - -
Carter et al. (2006) 78 39 - 100 - 0.6
Mentens et al. (2006) 45 - - -
Getter et al. (2007) 80.2 63.3 - 94.2 - -
Hathaway et al. (2008) 64 - 75 -
Van Seters et al. (2009) 63 - - -
Stovin (2010) 34 - 57 -
Voyde et al. (2010) 72 59 - 100 92 1.25
Caprenter et al. (2011) 68.25 - 88.86 2.16
Gregoire et al. (2011) 51.4 - - -
Stovin et al. (2012) 42.74 30.30 - 99.95 60 0.9
Fassman et al. (2013) 56 - 62 - 90 -
Morgan et al. (2013) 50 - - -
Speak et al. (2013) 65.7 - - 0.3
Unsurprisingly, like overall runoff volume and peak flow rate reduction, the magnitude of peak flow delay varies among the studies. Despite the variation, all studies demonstrated that green roofs delay peak flow and, therefore, have the capability to address the concerns that accompany increased runoff. Seemingly, the factors that influence peak flow reduction and
peak flow delay should be interdependent. However, there is a lack of studies exploring the mechanisms of peak runoff delay (Li and Babcock, 2014). While many studies have shown
1.5Runoff Quality
Like hydrologic performance, reported water quality results vary among studies. Yet, in the case of water quality, there is no clear agreement on whether green roofs provide water
quality improvements. Numerous studies point to green roofs as a potential source of nutrient pollution (Czemiel Berndtsson, 2010). Elevated TP concentrations in green roof outflow is
commonly reported (Berghage et al., 2009; Berndtsson et al., 2009; Bliss et al., 2009; Berndtsson et al., 2006; Gong et al., 2014; Gregoire and Clausen, 2011; Harper et al. 2013; Hathaway et al., 2008; Razzagamanesh et al., 2014; Van Seters et al, 2009, Wang et al.,
2013). Reported TN concentrations are more variable. Of the eleven studies showing
elevated TP concentrations, Harper et al. (2013), Hathaway et al. (2008) and Razzaghmanesh
et al. (2014) reported higher TN concentrations in green roof outflow. However, some studies showed that while TN concentrations may be lower, outflow had elevated concentrations of other nitrogen species (Gregoire and Clausen, 2011). Moran et al. (2003), found that outflow
from green roofs had significantly higher TN and TP concentrations, 3.9 mg/l and 0.7 mg/l respectively.
In 2009, Berghage et al. published an EPA report demonstrating that although green roofs contributed more phosphorus, potassium, hardness, salts and other ions, they do not act as a nitrogen source. This report concluded that green roofs were beneficial for the removal
of atmospheric nitrate. It is important to note that the nitrogen results from the EPA study are different than TN, NH4-N, NO3-N published elsewhere. The EPA recognized the need for
these parameters to be studied in future research.
Concentrations of the following nutrients and metals were found to be higher in runoff than rainfall: Cd, Cr, Cu, Fe, K, Mn, Pb, Zn, PO4–P, and TP– leading to the conclusion that green roofs do not effectively treat rain water (Berndtsson et al. 2006). In a subsequent project,
Berndtsson et al. (2009) solidified previous findings establishing extensive green roofs as a sink for NO3-N and NH4-N.
Green roof nutrient leaching is closely linked to fertilizer application. While some systems did not require fertilization for maintenance, green roof substrate often contains organic matter to help establish plant cover. Authors that observed high nutrient
concentrations in runoff universally attribute it to fertilizer and media incorporated organic matter (Berndtsson et al., 2006; Berndtsson et al., 2009; Hathaway et al., 2008; Rowe, 2011).
It follows that overtime the magnitude of nutrient pollution will lessen as it is removed from the system, introducing green roof age as a necessary parameter to assess green roof water quality performance. Kohler et al. (2002) confirmed this idea, showing that phosphorus loads
in runoff were reduced by 26%, 61%, 64% and 81% in four consecutive years. While literature does not agree on the dynamics of nitrogen in green roofs,
phosphorus concentrations are consistently higher in green roof runoff. Elevated phosphorus concentrations coupled with increased concentrations of other heavy metals and nutrients, suggest that green roofs may be detrimental to water quality. Further research is necessary to
establish green roof contribution to water treatment and/or explore green roof alternatives. 1.6Ancillary Benefits
various publications and fields of study, green roof impacts can be grouped into the broad field of building sustainability (Berardi et al., 2014).
Energy Consumption Reduction
Multiple studies have shown that green roofs effectively lower indoor temperature variation in turn decreasing building energy demands for heating and cooling (Casetlton et
al., 2010; Jaffal et al, 2012; Niachou et al., 2001). Depending on the climate, the green roof function to promote energy savings will be different. In cold climates, vegetated roofs act as an additionally layer of insulation on the building, retarding the rate of heat loss through the
roof (Getter et al., 2014). Getter at al. (2014) showed that in the winter, extensive green roofs reduced heat flux by 13% on average. The same study further demonstrated that heat flux
was reduced by 167% on average during the summer. Other literature reports similar
temporal heat flux differences (Castleton et al., 2010; Jaffal et al, 2011). During the summer, green roofs act a passive cooling method, preventing solar radiation from hitting the roof
(Castleton et al., 2010), essentially shading the surface from the sun. Niachou et al. (2001) showed that protection from solar radiation resulted in a 2% - 48% reduction in energy used
for cooling. Another study performed in the hot-humid Mediterranean climate reported 60% reduced cooling consumption (Olivieri et al., 2013).
Urban Heat Island
Urban heat island (UHI) effect is a phenomenon where temperatures in densely populated urban areas are significantly warmer than surrounding ‘non-city’ areas. Higher
to curb UHI. Susca et al. (2011), showed that temperature on vegetated roofs in New York City could be up to 2 °C cooler than conventional roofs. Other studies apply micro-scale findings to determine macro-scale effects. One such study, performed by Santamouris
(2012), claims that large-scale application of green roofs in Chicago, IL could reduce
ambient temperatures by 0.3°C - 3°C. Smith and Roeber (2010) also reported 3°C reductions
when modeling green roof’s UHI mitigation potential in Chicago. Curbing the effects of UHI will provide additional reductions in energy consumption, indirectly reducing citywide energy demand on top of the direct savings associated with green roof implementation. At
current rates of vegetated roof construction and retrofits, UHI mitigation benefits will be limited to the distant future. Ambient temperature decreases will not be measured until green
roof use is widespread. For this to happen, living roofs must overcome complexity and economic barriers currently preventing ubiquitous application.
Air Pollution Reduction
Intensive green roof’s ability to reduce air pollution is well studied. Air pollution impacts are more substantial from intensive systems, compared to extensive roofs, as trees
have the biggest impact on reducing air pollution (Currie and Bass, 2008). Yang et al. (2008) modeled contaminant (Ozone, NO2, PM10 and SO2) removal in Chicago; they found that green roofs removed 85 kg ha-1yr-1. In Washington D.C. assuming macro-scale extensive
green roof implementation, Duetsch et al. (2002) reported contaminant reductions of 83 kg ha-1yr-1, which is remarkably close to the findings of Yang et al. (2008). Comparable results,
that green roofs are not an economically feasible option for regulating air pollution citing a $35.2 billion cost to remove 2047 metric tons of air pollution in Washington D.C. Yet, considering the multiple drivers that motivate green roof use may lessen the economic
concerns.
To fully evaluate the impact of vegetated roofs on air pollution mitigation, their
capability to reduce building energy consumption and UHI must be considered. As
previously discussed, green roof practices can reduce building heat flux, ultimately lowering energy demands (Casetlton et al., 2010; Jaffal et al, 2012; Niachou et al., 2001).
Additionally, by lowering roof surface temperatures, green roofs have shown ability to reduce the effects of UHI, which would further decrease building energy consumed for
heating and cooling (Santamouris, 2012; Smith and Roeber, 2010). These combined
influences on energy demand, could significantly reduce emissions associated with fossil fuel burning (Rowe, 2011). Castleton (2010) outlines building energy benefits, but does not link
consumption reductions to pollution mitigation. Aesthetic Green Space
The social and aesthetic benefits of green roofs are challenging to empirically measure. Nonetheless, proponents of green roofs often point to the visual appeal and other amenities when describing the advantages of living roofs. Czemiel Berndtsson (2010)
remarked that green roofs are regularly viewed as art, and sometimes are established for purely aesthetic reasons. Because intensive roofs can support a diversity of larger and more
2011). Living roofs also create amenity value by providing habitats that increase urban biodiversity, adding recreational space and improving work environments (Rowe, 2011). 1.7Green Roof Concerns
Despite the numerous benefits, green roofs are not a panacea for the issues facing an urbanizing world. Currently economic concerns are the primary factor preventing widespread
green roof use (Berghage et al., 2007). Other barriers stem from discrepancy among the published quantifiable benefits of vegetated roofs on outflow water quality.
Economics
Several studies have attempted to determine whether green roofs are economically feasible compared to conventional roofs. The objective of green roof economic analysis is
generally to calculate the net present value (NPV) of the living system, and compare it to that of a conventional roof. Studies rely on environmental benefits to offset high construction costs, reducing the NPV to a level more comparable to conventional roofs. Accurately
determining the net present value requires consideration of a myriad of factors and therefore is inherently complex. For instance, Carter and Keeler (2008) used a benefit cost analysis that
accounted for benefits including improved air quality, reduced energy consumption and stormwater management. Clark et al. (2008) used a similar set of benefits in their economic models. In addition to the core three benefits used by Carter and Keller (2008) and Clark
(2008), Sproul et al. (2014) included white roofs in their economic comparison and introduced carbon offsets, and disposal costs into the benefit analysis. Bianchini and
authors choose to incorporate in their analysis. The large number of economic considerations associated with green roof operation makes it nearly impossible to develop a full
understanding of green roof economics. Consumer uncertainty over receiving a return on
their investment slowed green roof implementation. In many cases, economically beneficial impacts are not directly felt by the private or public entity building the roof. So, although
economically the green roof may be more cost effective, the savings are seemingly intangible to the consumer. High implementation costs combined with consumer hesitation emphasize the need to find less expensive rooftop SCMs that offer comparable benefits.
Table 1-2 Summary of reported green roof NPV compared to conventional roofs
Net Present Value
Green Roof
Conventional Roof
References
(%) $/m2 $/m3Carter et al. (2008) 10 to 14 145.04 122.02
Clark et al. (2008) -24.5 to -25.2 234.18 306.98
Sproul et al. (2014) 26.5 369.00 291.00
Niu et al. (2010) -30 to -40 416.66 311.81
Wong et al. (2003) 8.5 289.56 316.56
*Negative NPV represents overall savings
1.8Water Quality
Many studies have shown that green roofs function as a source of pollution (Berghage et al., 2009; Berndtsson et al., 2006; Berndtsson et al., 2009; Gong et al, 2013; Hathaway et al.,
2008). While the extent of contamination and the type of pollutant vary, there is a clear trend that links green roofs to water quality degradation. A summary of published water quality findings can be seen in Table 1-3. Elevated nutrient concentrations in green roof runoff pose
achieving aesthetic objectives comes at the expense of runoff quality. Green roof runoff pollution further highlights the demand for two paths for future research: addressing vegetated roof runoff and exploring alternative rooftop SCMs.
Table 1-3 Summary of water quality results in green roof literature
Reference Water Quality Result
Berghage et al, (2009) Pennsylvannia, USA
Green roofs act as a source of metals and nutrients except for nitrogen.
Berndtsson et al. (2009) Japan and Sweden
Intensive roofs acted as sinks for nitrate, ammonium and TN. Extensive roofs did not significantly reduce TN and released phosphorus. Conversely, intensive roofs showed no phosphorus leaching. Green roofs were determined to not be a significant source of heavy metals.
Bliss et al. (2009) Pittsburgh, USA
Green roof had higher phosphorus. No significant difference was observed between the control and the green roof outflow with respect to sulfate, nitrogen or heavy metals.
Carpenter & Kaluvakolanu (2011) Michigan, USA
No significant difference in TP or TN concentrations among the control and green roof; results deemed runoff results to be inconclusive due to small number of sampled storms
Czemiel Berndtsson et al. (2006) Southern Sweden
Green roofs acted as source of Cd, Cr, Cu, Fe, K, Mn, Pb, Zn, PO4-P and TP. Conversely, the roofs acted as nitrogen sinks. Nitrate it retained by the vegetation and/or soil.
Gong et al. (2014) Tianjin, China
Elevated TP concentrations from all plots. All treatments acted as ammonia sinks. The two treatments with shallower substrate acted as nitrate sources, while the two deeper treatments sunk nitrate. Outflow TN was lower from all but one plot.
Gregoire & Clausen (2011) Connecticut, USA
Green roof outflow TP and phosphate Concentrations were higher than rainfall but lower than the control. The green roof acted as a sink for TN, TKN, and NH3. Nitrate-Nitrite concentrations were higher in green roof outflow.
Harper et al. (2015) Missouri, USA
Reported very high TN and TP concentrations well outside the range established in literature: >60 mg/L and >30 mg/L respectively. These concentrations decreased over the course of the study, consistent with previously reported trends
Hathaway et al. (2008) North Carolina, USA
TN concentrations significantly greater than rainfall, but not control. TP concentrations significantly higher in green roof outflow than rainfall and control. Researchers concluded that media acted as contaminant source.
Razzaghmanesh et al. (2014) Adelaide, Australia
Significantly higher Nitrate and phosphorus concentrations in extensive and intensive green roof outflow compared to asphalt and aluminum control roofs.
Teemusk& Mander (2007) Tartu, Estonia
Table 1-3 continued
Van Seters (2009) Toronto, Canada
Reported phosphorus and nitrate concentrations were lower than those of Hathaway et al. (2008). Nitrate concentrations were very low. Conversely, phosphorus concentrations in green roof outflow were significantly higher than the control roof resulting phosphorus loads exceeding regulated water guidelines.
Wang et al. (2013) Tianjin, China
Green roofs acted as a source for TP and as a sink for TN and NH3. Authors concluded that the larger the media depth the better water quality treatment achieved.
1.9Blue Roofs
Blue roofs are a newly introduced rooftop SCM that function similarly to green roofs.
Like green roofs, blue roofs can be built in place or modular and layering in the system also contains filter fabric and a drainage mat. The main difference between green and blue roofs is
that blue roofs contain no vegetation (Figure 1-3(a)). In place of the vegetation and media layer, blue roofs have a thin layer of gravel that acts as ballast, keeping the layers below in place. The schematic is illustrated in Figure 1-3 (b).
Without vegetation, blue roof construction and maintenance costs are considerably lower (NYCDEP, 2011). Blue roof advantages are limited compared to green roofs. Without vegetation, blue roofs lack the aesthetic appeal and amenity value provided by green roofs.
Additionally, blue roofs cannot offer the environmental benefits like air pollution mitigation
(a) (b)
and increase urban biodiversity demonstrated by green roofs. Currently, it appears that the advantages of blue roofs are solely hydrologic.
Stormwater control function in blue roofs is relatively simple: small outlet orifices
slow the rate of release, forcing rainwater water to pond on the roof. Outlet control can be achieved through several methods. The New York City Department of Environmental
Protection (NYCDEP) conducted a study that explored three blue roof setups. On one roof, 4 plots were established: one control, and three different blue roof treatments. The first blue roof plot, has no roof alterations but the roof drain was altered to slow water drainage. The
second blue roof plot contained a series of check dams that slowed runoff flow to the drain. The third plot was outfitted with modular blue roof trays, shown previously in Figure 1-3(a).
The hydrologic performance of each practice varied substantially. The modified drain plot effectively slowed drainage at the beginning of storm events, but was overwhelmed when precipitation became heavy. Likewise, the check dams, which had a large storage volume,
performed well at the onset of storms but became ineffective during intense rainfall. In this case, runoff was able to flow over the check dams, rendering the small flow regulating
orifices useless. Ultimately, the modular trays showed the best hydrologic performance relative to the other systems. Most significantly, the NYCDEP found that blue roof tray systems not only delayed peak runoff but also reduced runoff volume; these reductions were
“comparable” to reductions observed in green roofs (NYCDEP, 2011). The capability of blue roofs to reduce runoff volume was unexpected. While green roofs are designed to detain and
evapotranspiration could also produce previously observed runoff volume reduction. The authors emphasize that further research into rooftop microclimate’s role in evapotranspiration from the blue roof trays is necessary.
Accordingly, the NYCDEP (2011) performed a green/blue roof comparison study to build upon their previous findings. Both treatments significantly delayed peak runoff, and the
green roof reduced runoff volume. However, in this study, the blue roof did not reduce runoff volume, directly contradicting the previous results. Isolating the cause of volume reduction differences and establishing blue roof volume reduction capabilities is imperative to
determine whether blue roofs are a plausible green roof alternative. These apparent knowledge gaps must be filled for blue roofs to become an established SCM.
No published data or peer-reviewed literature exists to determine the hydrologic benefits of blue roofs. Additionally, the NYCDEP did not monitor runoff water quality from the blue roofs. While their results are encouraging, the limited data stress the need for
References
Arnold, C. L., & Gibbons, C. J. (1996). Impervious surface coverage: The emergence of a key environmental indicator. Journal of the American Planning Association 62(2):243 258.
Bengtsson, L. (2005). Peak flows from thin sedum-moss roof. Nordic Hydrology 36(3): 269–280.
Berardi, U., GhaffarianHoseini, A., & GhaffarianHoseini, A. (2014). State-of-the-art analysis of the environmental benefits of green roofs. Applied
Energy 115(2014): 411-428.
Berghage, R., Beattie, D., Jarrett, A., Thuring, C., Razaei F., & O’Connor T. (2009). Green roofs for stormwater runoff control. EPA/600/R-09/026.
Berghage, R., Jarrett, A., Beattie, D., Kelley, K., Husain, S., Rezai, F., Long, B., Negassi, A., Cameron, R., & Hunt, W. (2007). Quantifying evaporation and transpirational water losses from green roofs and green roof media capacity for neutralizing acid rain. 1-94. Berndtsson, J. C., Bengtsson, L., & Jinno, K. (2009). Runoff water quality from intensive and
extensive vegetated roofs. Ecological Engineering 35(3): 369-380.
Berndtsson, J. C., Emilsson T., & Bengtsson L. (2006). The influence of extensive vegetated roofs on runoff water quality. The Science of the Total Environment 355(1-3): 48-63. Bianchini, F. & Hewage, K. (2012). Probabilistic social cost-benefit analysis for green
roofs: A lifecycle approach. Building and Environment 58(2012): 152-162. Bierwagen, B. G., Theobald, D. M., Pyke, C. R., Choate, A., Groth, P., Thomas, J. V., &
Morefield, P. (2010). National housing and impervious surface scenarios for integrated climate impact assessments. Proceedings of the National Academy of Sciences 107(49): 20887-20892.
Bliss, D. J., Neufeld, R. D., & Ries, R J. (2009). Storm Water Runoff Mitigation Using a Green Roof. Environmental Engineering Science 26(2): 407-418.
Carlson, T. (2004). Analysis and prediction of surface runoff in an urbanizing watershed using satellite imagery. Journal of the American Water Resources Association 40(4): 1087-1098.
Carpenter, D., & Kaluvakolanu, P. (2011). Effect of roof surface type on storm-water runoff from full-scale roofs in a temperate climate. Journal of Irrigation and Drainage Engineering 137(3): 161-169.
Carson, T. B., Marasco, D. E., Culligan, P. J., & McGillis, W. R. (2013). Hydrological performance of extensive green roofs in New York City: observations and multi-year modeling of three full-scale systems. Environmental Research Letters 8(2): 24-36.
Carter, T., & Jackson, C. R. (2007). Vegetated roofs for stormwater management at multiple spatial scales. Landscape and Urban Planning 80(1-2): 84-94.
Carter, T., & Keeler, A. (2008). Life-cycle cost-benefit analysis of extensive vegetated roof systems. Journal of Environmental Management 87(3): 350-363.
Carter, T. L., & Rasmussen, T. C. (2006). Hydrologic Behavior of Vegetated
Roofs. JAWRA Journal of the American Water Resources Association 42(5): 1261-1274.
Castleton, H. F., Stovin, V., Beck, S. B. M., & Davison, J. B. (2010). Green roofs; building energy savings and the potential for retrofit. Energy and Buildings 42(10): 1582 1591.
Cheney, C. (2005). New York City: greening Gotham’s rooftops. In: Earth Pledge (Ed.), Green Roofs: Ecological Design and Construction. Schiffer Books, Atglen, PA. 30-133.
Clark, C., Adriaens, P., & Talbot, F. B. (2008). Green roof valuation: a probabilistic economic analysis of environmental benefits. Environmental Science & Technology 42(6): 2155-2161.
Currie, B. A. & Bass, B. (2008). Estimates of air pollution mitigation with green plants and green roofs using the UFORE model. Urban Ecosystems: 1-14.
Czemiel Berndtsson, J. (2010). Green roof performance towards management of runoff water quantity and quality: A review. Ecological Engineering 36(4): 351-360. Denardo, J. C., Jarrett, A. R., Manbeck, H. B., Beattie, D. J., & Berghage, R.D. (2005).
Stormwater mitigation and surface temperature reduction by green roofs. In Proc. 2003 ASAE Annual Meeting 48(4): 1491-1496.
Deutsch, B., Whitlow, H., Sullivan, M., & Savineau, A. (2005). Re-Greening Washington, DC: a green roof vision based on environmental benefits for air quality and
storm water management. In Proc. 3rd North American Green Roof
Dunne, T., & Leopold, L. B. (1978). Water in Environmental Planning. San Francisco. CA: W. H. Freeman and Company
Dunnett, N., & Kingsbury, N. (2004). Planting Green Roofs and Living Walls. Timber Press, Portland.
Durhman, A. K., Rowe, D. B., & Rugh, C. L. (2006). Effect of watering regime on chlorophyll fluorescence and growth of selected green roof plant
taxa. HortScience 41(7): 1623-1628.
Fassman-Beck, E., Voyde, E., Simcock, R., & Hong, Y. S. (2013). 4 Living roofs in 3 locations: Does configuration affect runoff mitigation? Journal of
Hydrology 490(2013): 11-20.
Getter, K. L., Rowe, D. B., & Andresen, J. A. (2007). Quantifying the effect of slope on extensive green roof stormwater retention. Ecological Engineering 31(4): 225-231.
Gong, K., Wu, Q., Peng, S., Zhao, X., & Wang, X. (2014). Research on the characteristics of the water quality of rainwater runoff from green roofs. Water Science &
Technology 70(7): 1205-1205.
Gregoire, B. G., & Clausen, J. C. (2011). Effect of a modular extensive green roof on stormwater runoff and water quality. Ecological Engineering 37(6): 963-969. Harper, G. E., Limmer, M. A., Showalter W. E., & Burken, J. G. (2013). Nine-month
evaluation of runoff quality and quantity from an experiential green roof in Missouri, USA. Ecological Engineering 78127-133.
Hathaway, A. M., Hunt, W. F., & Jennings, G. D. (2008). A field study of green roof hydrologic and water quality performance. American Society of Agriculture and Bioengineers. 51(1): 37-44.
Jaffal, I., Ouldboukhitine, S. & Belarbi, R. (2012). A comprehensive study of the impact of green roofs on building energy performance. Renewable Energy 43(2012): 157-164.
Kohler, M., Schmidt, M., Wilhelm Grimme, F., Laar, M., Assuncao Pavia, V. &
Tavares, S. (2002). Green roofs in temperate climates and in the hot-humid tropics - far beyond the aesthetics. Environmental Management and Health 13(4): 382-391. Kosareo, L., & Ries. R. (2007). Comparative environmental life cycle assessment of
green roofs. Building and Environment 42(7): 2606-2613.
Liu, K., & Baskaran, B. (2003). Thermal performance of green roofs through field
evaluation. Proceedings of the First Annual International Green Roofs Conference: Greening Rooftops for Sustainable Comunities.10-10.
Maclvor, J. S., & Lundholm, J. (2011). Performance evaluation of native plants suited to extensive green roof conditions in a maritime climate. Ecological Engineering 37(3): 407-417.
Mentens, J., Raes D., & Hermy, M. (2006). Green roofs as a tool for solving the rainwater runoff problem in the urbanized 21st century? Landscape and Urban Planning 77(3): 217-226.
Montalto, F., Behr, C., Alfredo, K., Wolf, M., Arye, M., & Walsh, M. (2007). Rapid assessment of the cost-effectiveness of low impact development for CSO control. Landscape and Urban Planning 82(3): 117-131
Moran, A., Hunt, B., & Jennings, G. (2003). A North Carolina field study to evaluate greenroof runoff quantity, runoff quality, and plant growth. ASCE Conference Proceedings 118, 335
Morgan, S., Celik, S. & Retzlaff, W. (2013). Green roof storm-water runoff quantity and quality. Journal of Environmental Engineering 139(2): 471-478.
Nagase, A. & Dunnett, N. (2012). Amount of water runoff from different vegetation types on extensive green roofs: Effects of plant species, diversity and plant structure. Landscape and Urban Planning 104(3-4): 356-363.
NCDENR. (2007). NCDENR stormwater BMP manual –rooftop runoff management. Raleigh, NC.: Department of Environment and Natural Resources, Division of Water Quality.
Niachou, A., Papakonstantinou, K., Santamouris, M., Tsangrassoulis, A., & Mihalakakou, G. (2001). Analysis of the green roof thermal properties and investigation of its energy performance. Energy and Buildings 33(7): 719- 729.
Niu, H., Clark, C., Zhou, J. & Adriaens, P. (2010). Scaling of economic benefits from green roof implementation in Washington, DC. Environmental Science and Technology 44(11): 4302-4308.