I
nternational
J
ournal of
I
nnovative
R
esearch in
C
omputer
and
C
ommunication
E
ngineering
(An ISO 3297: 2007 Certified Organization)
Vol. 4, Issue 2, February 2016
ISSN(Online): 2320-9801 ISSN (Print): 2320-9798
Image De-Noising Based on Simple Total
Least Square
Nidhal K. El Abbadi, Naseer R. M. AlBaka, Ghadeer Hakim
Dept. of Computer Science, University of Kufa, Najaf, Iraq Dept. of Computer Science, University of Kufa, Najaf, Iraq
Dept. of Mathematical, University of Kufa, Najaf, Iraq
ABSTRACT: Noise is a random variation of image intensity and appear as grains in the image. There are many methods suggested for de-noising.Image de-noising involves the manipulation of the image data to produce a visually high quality image. In this paper we suggested new filterfor de-noise based on simple total least square. The simple total least square is the process of finding the smallest difference between the square of pixel and the square of 8- neighbors pixels. The proposed algorithm tested with (Salt and pepper , Speckle, Gaussian and Poisson noise) with different concentration of noise and gives promised results. Also proposed algorithm compared with other de-noising algorithms and the results were better.
KEYWORDS: de-noising, STLS, noise filter, image processing
I. INTRODUCTION
Image de-noising is an important image processing task, both as a process itself, and as a component in other processes. Very many ways to de-noise an image or a set of data exists. The main properties of a good image de-noising model is that it will remove noise while preserving edges. The goal of the noise reduction is how to remove noise while keeping the important image features as much as possible [1].
Image de-noising is a hot research issue in the field of digital image processing. Image de-noising is very important on guaranteeing the effectiveness and robustness of other image processing algorithms in the industry image process procedures, such as image registration, image segmentation.[2].
Image de-noising problems arise when an image is corrupted by additive white Gaussian noise which is common result of many acquisition channels, whereas image in-painting problems occur when some pixel values are missing or when we want to remove more sophisticated patterns, like superimposed text or other objects, from the image [3].
It has proved that the spatial domain smoothing is effective to remove the additive Gaussian noise in the noisy image. The key idea is to replace the intensity value of each pixel by a weighted average of all intensity values of its neighborhood. The weight can be computed via the Gaussian filter or the box filter. The basic idea of the Gaussian filter is that the value of the pixels of its neighborhood is given different weighting which is defined by a spatial Gaussian distribution.[4]
Removing noise from the original signal is still achallenging problem for researchers. There have beenseveral published algorithms and each approach hasits assumptions, advantages, and limitations.
Estrada suggested probabilistic algorithm for image noise removal. He showed thatsuitably constrained random walks over small image neighborhoods provide a goodestimate of the appearance of a pixel, and that a stable estimate can be obtained witha small number of samples. [5]
I
nternational
J
ournal of
I
nnovative
R
esearch in
C
omputer
and
C
ommunication
E
ngineering
(An ISO 3297: 2007 Certified Organization)
Vol. 4, Issue 2, February 2016
ISSN(Online): 2320-9801 ISSN (Print): 2320-9798
Firasproposed approach to suppress noise from the image is conducted by applying the interquartile range (IQR) which is one of the statistical methods used to detect outlier effect from a dataset. A window of size kxk was implemented to support IQR filter. Each pixel outside the IQR range of the kxk window is treated as noisy pixel. The estimation of the noisy pixels was obtained by local averaging. The essential advantage of applying IQR filter is to preserve edge sharpness better of the original image.[7]
II. IMPLEMENTING SIMPLE TOTAL LEAST SQUARE (STLS)
Suppose that we have a window of nine holes as in Fig. 1. this window moving on the entire image from left to right and top to down. At each time the STLS will be determined, according to its result the value at the center of the window will be change.
A B C
D S E
F G H
Fig. 1: STLS mask
The STLS determined by the following relation according to the mask in Fig. 1:
R = (E−S) + (H−S) (G−S) + (F−S) + (D−S) + (A−S) + (B−S) + (C−S)
such that (R) represent the value of the simple total square differences.
We start to increase the value at the center by one and then check the value of (R) if this value (R) become less than its previous value then we continue to increase the center value at each step with one until we get value of (R) equal to zero or greater than the previous one, at this step we get the final value of the (S) and we have to change the old value of (S) with new one. Otherwise, if from the first step when increasing (S) with one we get value of (R) greater than its previous value, at this case we change the process to decrease the (S) value by one and continue to decreases (S) with one at each step until we get (R) value greater than the previous, which mean end of process and get the final value to (S). The best result is when we get (R) equal to zero.
III. THE RESULTS
A. Visual Results
I
nternational
J
ournal of
I
nnovative
R
esearch in
C
omputer
and
C
ommunication
E
ngineering
(An ISO 3297: 2007 Certified Organization)
Vol. 4, Issue 2, February 2016
ISSN(Online): 2320-9801 ISSN (Print): 2320-9798
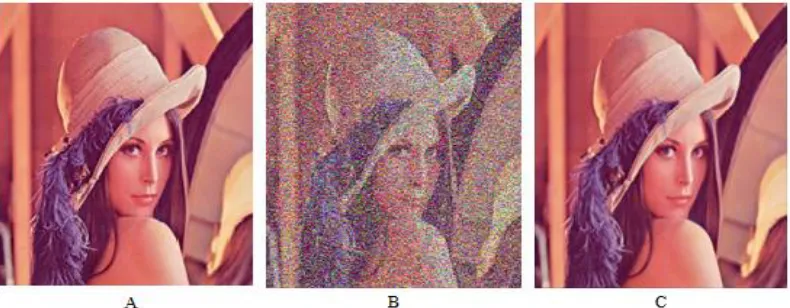
Fig. 3: A. origin image. B. noisy image with Gaussian noise. C. image after de-noising using STLS.
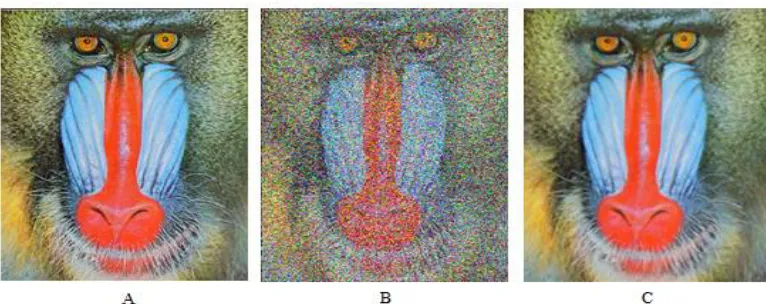
The images in Fig. (4 and 5) are pepper image and Baboon image both noisy with salt and pepper and the results were highly similar to origin images.
Fig. 4: A. origin image. B. noisy image with salt & pepper noise. C. image after de-noising using STLS
I
nternational
J
ournal of
I
nnovative
R
esearch in
C
omputer
and
C
ommunication
E
ngineering
(An ISO 3297: 2007 Certified Organization)
Vol. 4, Issue 2, February 2016
ISSN(Online): 2320-9801 ISSN (Print): 2320-9798
B. Compare (STLS) with other methods
The PSNR for STLS algorithm compared with PSNR for other noise removing methods such as (Median, Gaussian,Morphology, Average, Motion, Disk). The following tables showed the PSNRwhen application suggested method on RGBimages (Lena, Baboon and Pepper images) compared with PSNR for other methods with different typesof noise (Salt and pepper, Speckle, Gaussian and Poisson ) and different density of noise.
Table1:comparing PSNR for different filters(Median, Gaussian ,Morphology, Average, Motion, Disk, STLS), at different salt and pepper noise density, using Lean image.
Noise density
PSNR
Median Gaussian Morphology Average Motion Disk STLS
0.01 60.57 64.20 60.93 60.45 59.66 59.23 73.22
0.001 64.09 67.38 65.13 63.17 61.11 60.511 82.99
0.0001 65.47 68.26 66.96 63.88 61.32 60.71 94.94
Table2:comparing PSNR for different filters (Median, Gaussian,Morphology, Average, Motion, Disk, STLS), at different speckle noise density, using Lean image.
Noise density
PSNR
Median Gaussian Morphology Average Motion Disk TLS
0.01 60.63 64.26 63.01 60.55 59.70 59.28 73.46
0.001 64.22 67.38 66.22 63.21 61.11 60.52 83.26
0.0001 65.46 68.27 67.21 63.85 61.32 60.70 93.10
Table3:comparing PSNR for different filters (Median, Gaussian,Morphology, Average, Motion, Disk, STLS), at different Gaussian noise density, using Lean image.
Noise density
PSNR
Median Gaussian Morphology Average Motion Disk TLS
0.01 58.27 61.93 59.97 58.32 57.98 57.67 68.33
0.001 62.63 66.05 64.51 62.14 60.64 60.12 78.14
0.0001 65.07 68.91 66.88 63.67 61.27 60.65 88.05
Table4:comparing PSNR for different filters (Median, Gaussian,Morphology, Average, Motion, Disk, STLS), at Poisson noise, using Lean image.
PSNR
Median Gaussian Morphology Average Motion Disk STLS
I
nternational
J
ournal of
I
nnovative
R
esearch in
C
omputer
and
C
ommunication
E
ngineering
(An ISO 3297: 2007 Certified Organization)
Vol. 4, Issue 2, February 2016
ISSN(Online): 2320-9801 ISSN (Print): 2320-9798
Table5:comparing PSNR for different filters (Median, Gaussian,Morphology, Average, Motion, Disk, TLSS), at different salt and pepper noise density, using Pepper image.
Noise density
PSNR
Median Gaussian Morphology Average Motion Disk TLS
0.01 60.38 63.99 60.69 60.41 59.79 59.18 73.18
0.001 63.84 67.02 64.79 63.08 61.51 60.50 82.89
0.0001 65.02 67.75 66.55 63.68 61.78 60.67 93.65
Table6:comparing PSNR for different filters (Median, Gaussian,Morphology, Average, Motion, Disk, STLS), at different Spackle noise density, using pepper image.
Noise density
PSNR
Median Gaussian Morphology Average Motion Disk TLS
0.01 60.85 64.41 63.21 60.73 60.06 59.40 74.07
0.001 64.13 67.12 66.14 63.19 61.56 60.53 84.04
0.0001 65.07 67.75 66.84 63.70 61.78 60.68 93.88
Table7:comparing PSNR for different filters (Median, Gaussian,Morphology, Average, Motion, Disk, STLS), at different Gaussian noise density, usingPepper image.
Noise density
PSNR
Median Gaussian Morphology Average Motion Disk TLS
0.01 58.32 61.91 60.07 58.38 58.14 57.73 68.44
0.001 62.56 65.89 64.47 62.11 60.99 60.12 78.24
0.0001 64.74 67.54 66.57 63.53 61.71 60.63 88.15
Table8:comparing PSNR for different filters (Median, Gaussian,Morphology, Average, Motion, Disk, STLS), at Poisson noise, using Lean image.
PSNR
Median Gaussian Morphology Average Motion Disk TLS
I
nternational
J
ournal of
I
nnovative
R
esearch in
C
omputer
and
C
ommunication
E
ngineering
(An ISO 3297: 2007 Certified Organization)
Vol. 4, Issue 2, February 2016
ISSN(Online): 2320-9801 ISSN (Print): 2320-9798
Table9:comparing PSNR for different filters (Median, Gaussian,Morphology, Average, Motion, Disk, STLS), at different salt and pepper noise density, usingBaboon image.
Noise density
PSNR
Median Gaussian Morphology Average Motion Disk TLS
0.01 60.02 63.85 60.58 59.93 58.69 57.90 73.40
0.001 62.03 66.05 62.85 61.63 59.48 58.46 83.49
0.0001 62.40 66.47 63.32 61.89 59.57 58.52 92.72
Table10:comparing PSNR for different filters (Median, Gaussian,Morphology, Average, Motion, Disk, STLS), at different Speckle noise density, usingBaboon image.
Noise density
PSNR
Median Gaussian Morphology Average Motion Disk TLS
0.01 60.12 63.97 63.37 60.04 58.75 57.92 73.79
0.001 62.06 66.05 63.16 61.62 59.47 58.45 83.58
0.0001 62.40 66.45 61.77 61.88 59.57 58.52 93.38
Table11:comparing PSNR for different filters (Median, Gaussian,Morphology, Average, Motion, Disk, STLS), at different Gaussian noise density, usingBaboon image.
Noise density
PSNR
Median Gaussian Morphology Average Motion Disk TLS
0.01 58.03 61.77 59.65 58.08 57.47 56.91 68.30
0.001 61.33 65.22 62.60 61.04 59.24 58.30 78.17
0.0001 62.31 66.34 63.31 61.81 59.54 58.51 88.10
Table12:comparing PSNR for different filters (Median, Gaussian,Morphology, Average, Motion, Disk, STLS), at Poisson noise, usingBaboon image.
PSNR
Median Gaussian Morphology Average Motion Disk TLS
60.65 64.49 62.07 60.46 58.96 58.09 75.39
IV. CONCLUSION
I
nternational
J
ournal of
I
nnovative
R
esearch in
C
omputer
and
C
ommunication
E
ngineering
(An ISO 3297: 2007 Certified Organization)
Vol. 4, Issue 2, February 2016
ISSN(Online): 2320-9801 ISSN (Print): 2320-9798
REFRENCES
1. SomkaitUdomhunsakul, “Noise Reduction using adaptive Singular Value Decomposition”, International Journalof Circuits Systemsand Signal Processing, Issue 2, Volume 7, 2013.
2. Liu, C., Szeliski, R., Kang, S.B., et al. Freeman, “Automatic Estimation and Removal of Noise from a Single Image”. IEEE Transactions on Pattern Analysis and Machine Intelligence, 30, 299-314. 2008, DOI: org/10.1109/TPAMI.2007.1176.
3. JunyuanXie, Linli Xu, Enhong Chen, "Image Denoising and Inpainting with Deep Neural Networks”, proceed in Advances in Neural Information Processing Systems 25, pp. 350-358, 2012.
4. Lingli Huang, “Improved Non-Local Means Algorithm for Image Denoising”, Journal of Computer and Communications, 3, pp. 23-29, 2015. 5. Francisco Estrada, David Fleet, Allan Jepson, “Stochastic Image Denoising”,British Mashine Vision Conference 2009, doi:10.5244/C.23.117.
6. Guoshen Yu, Guillermo Sapiro, “DCT image denoising: a simple and effective image denoising algorithm”, IPOL Journal, ·Image Processing On Line, 2011.
7. FirasAjilJassim, “Image Denoising Using Interquartile Range Filter with Local Averaging”,International Journal of Soft Computing and Engineering (IJSCE), Vol. 2, Issue 6, 2013.
BIOGRAPHY
Nidhal El Abbadi, received BSc in Chemical Engineering, BSc in computer science, MSc and PhD in computer science, worked in industry and many universities, he is general secretary of colleges of computing and informatics society in Iraq, reviewer for a number of international journals, has many published papers and three published books, his research interests are in image processing, security, and steganography, He’s Associate Professor in Computer Science in the University of Kufa – Najaf, IRAQ.
Naseer R. M. AlBaka, received his BSc in mathematical from university of Basra at the year 1981, and received his MSc in applied mathematics from the university of Technology at the year 1996. He published many papers. He worked now at the university of Kufa since 1996. Currently he is head of computer science department in Education college.