Simulation and Analysis of 10 GBPS Optical
Communication System Using Different Pulses
Deepak Kumar Ray1, Apurv Anand2, VIkash Kumar3 , Ekta Negi4
Assistant Professor, Dept of EnTC, Bharti Vidyapeeth Deemed University , College of Engineering Pune ,
Maharashtra, India1
B.Tech. Student, Dept. of EnTC , Bharti VIdyapeeth Deemed University , College of Engineering Pune , Maharashtra,
India2,3,4
ABSTRACT : - In this paper we simulatd an optical transmission system in optical fiber using different pulses.The optical fiber system used in telecommunication system has small size or dimension, low loss and low interference from outside environment. Optical fiber are of various configurations , we are using fiber bragg grating as the dispersion compensator in the fiber optic cable . We are using FBG in the simulation as because it offers more bandwidth.Optisystem software is used to analyse the optical transmission system . In the simulation of the communication system appropriate values of the input power , fiber cable length and attenuation coefficient is taken around the cable section and the output pwer , noise figure , gain is found out at the receiver. The transmitter frequency and cut off frequency of the receiver is made constant .
KEYWORDS: - Optical communication System, FBG , Optisystem software , parameters
I.INTRODUCTION
Any transmission system consists of three basic components , that are fiber component such as fiber optic cable , light sources at the input and light detector at the output. Here we have used fiber bragg grating as in the design of optical transmission system. FBG is linear , strong and compact component which has strong dispersion in transmission and reflection which helps in getting maximum compression ratio .
Optisystem simulation software quite useful software in which any type of optical such as LAN and MAN can be designed , tested and optimised. Through the use of this software optical transmission system can be designed from a small component to a huge system. Dispersion map design , transmitter , receiver and amplifier design can be planned tested and simulated on the optisystem .Optical fiber modelling can be achieved in realistic manner in this software.
In this study of optical communication system we are analysing the different effects on the components in by having changes in the parameters . Parameters such as output power noise figure , attenuation coefficient and gain at the receiver is measured.
II.RELATED WORK
The incident pulse finally gets compressed and it is then used in compensating chromatic dispersion . In the FBG the core is exposed to the intense radiation of ultraviolet light. The exposure increases the refractive index and it is permanently increased. This pattern of exposure creates a fixed modulation index which is called grating. As the periodic refraction is changed a small reflected light is generated . When the grating period approximately becomes half of the input light wavelength then it is called bragg wavelength . The other light (except the Bragg’s light) will be transparent.
B. Components Details:
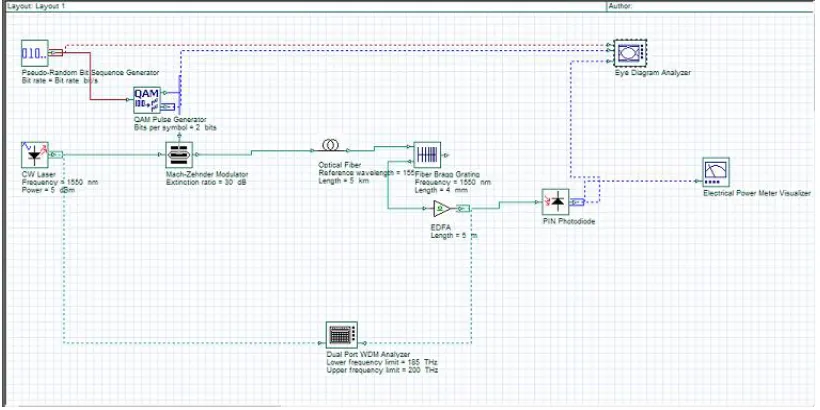
Firstly we are using NRZ pulses for electrical pulses which are then used in modulation . Apart form the NRZ pulses QAM , OQPSK and PAM is also used. Data signal is scrambled in bit rates using pseudo random bit sequence generator. The mode in which the system ids operated generates the bit sequence , probability:random number generator has the parameter mark probability of the number of 1s in the whole sequence. In the design the continuous wave laser is used and it is externally modulated with the NRZ, PAM ,OQPSK,QAMwith the pseudo random sequence in a mach-zehnder modulator with a specified extinction ratio.The principle of interferometry is used in Mach –Zehnder modulator. The interference can be constructive or destructive and It can be determined by the voltage applied .The output signal is modulated according to the voltage. Single mode optical fiber is used as because it allows a single stream of light propagating at once in the core. Data signal can be transmitted at 25-100 km length of fibre. In sending an optical signal a single ray of light is used . Fiber Bragg Grating (FBG) is used to compensate chromatic dispersion of common fibers which is a part of common single mode fiber that is like a grating. Erbium doped fiber amplifier compensates the losses in an optical transmission system . At the receiving end photodetector is used which converts the incoming light light automatically into the electric current.
III.DESIGN CONSIDERATION
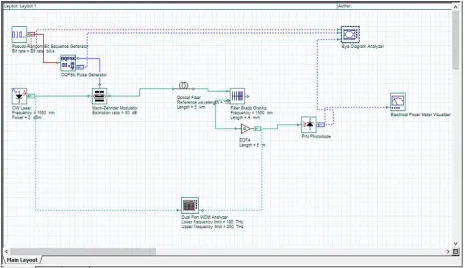
In this system the optical communication system has a transmitter , fiber optic cable and the receiver Data is sent in the form of optical wave from the transmitter to receiver in the optical fiber cable, output signal containing the data in the form of one and zero gets generated with the pulse pseudo random binary sequence. After that we modulate the input signal with the continuous wave semiconductor laser in Mach-Zehnder modulator.The continuous wave laser gives the input signal of 1550 nm wavelength and power at the input is given of 5 dbm is modulated with the data rate of 10Gbps with the NRZ,PAM, QAM, OQPSK pseudorandom binary sequence in the Mach- Zehnder modulator with the extinction ratio of 30 db. In this optical transmission system we have used single mode fiber as it provides with more data rate , low dispersion, and it canalso be operated for much longer time.
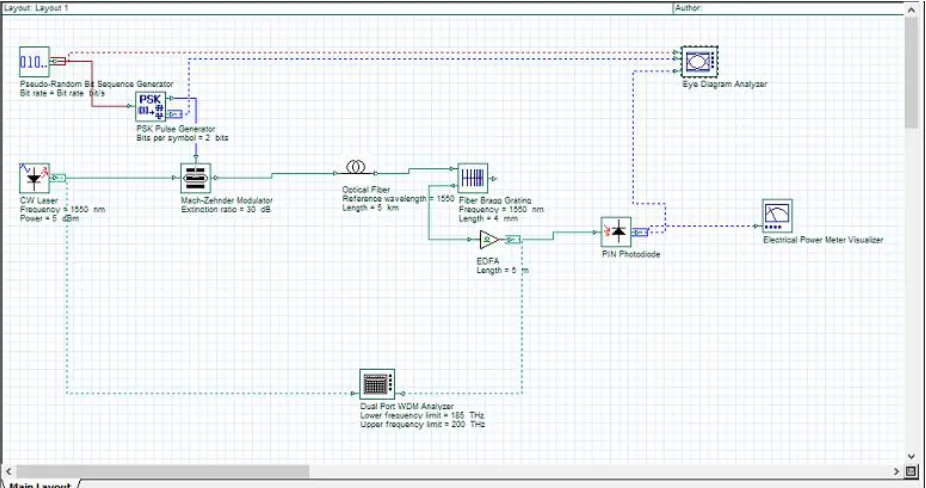
We are using fiber bragg grating for compensating the dispersion and the optimum grating length is made in between 1 to 6 mm by try and error method.Then it is passed through the erbium doped fiber amplifier for amplifying the optical wave as it is needed that the the filter loss is reduced and the signal is amplified before it is being received at the photodetector PIN .
The values for the design of the optical transmission system:
• Input power: 5dBm
• Frequency at transmitter: 1550nm
• Fiber length: 10km
Figure 1: Simulated model using NRZ pulse
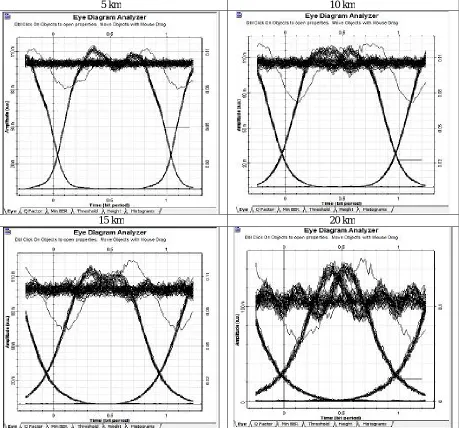
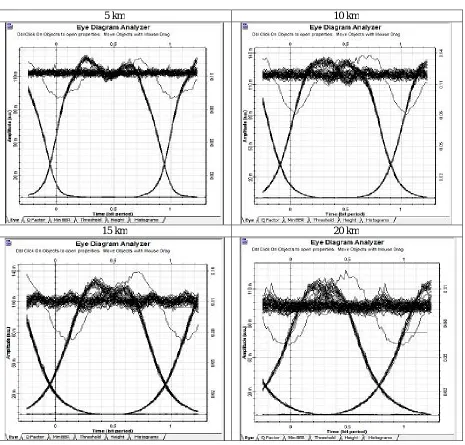
Table 2: eye diagrams using different values of fiber length
Figure 2 : simulated model using QAM pulse
Table 3: output readings by varying the fiber lengths Length
(km )
Gain (dB)
Noise Figure (dB)
Table 4: eye diagrams using varying fiber lengths
Table 4: eye diagrams using varying fiber lengths
5 km 10 km
Figure 3 : simulated model using PSK pulse
Length (km )
Gain (dB)
Noise Figure (dB)
Output Power (mW) 5 12.346 10.561 5.931 10 12.320 11.651 5.361 15 12.201 12.754 5.981 20 12.151 13.894 5.825
5 km 10 km
15 km 20 km
Figure 4 : Simulated model using OQPSK pulse
Length (km )
Gain (dB)
Noise Figure (dB)
Output Power (mW) 5 12.346 10.271 5.931 10 12.294 11.234 5.643 15 12.271 12.365 5.244 20 12.130 13.456 6.169
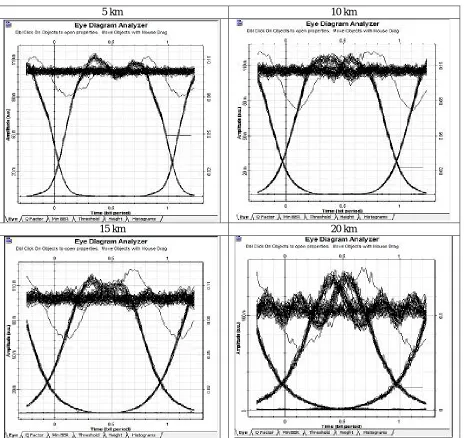
5 km 10 km
15 km 20 km
Table 8: eye diagrams using different fiber lengths
IV.RESULTS
We have designed and simulated the optical communication system with the help of optisystem software. We have investigated the eye diagrams and found out the output power, receiver gain, noise figure by putting different values of input power , attenuation coefficient , and length of the fiber cable.
performance of the optical transmitter.We can see by analysing the data which shows that the value of noise figure is directly proportional to the length of the fiber . It can be seen that by increasing the fiber length the gain decreases but the noise figure increases linearly with the increase in the fiber length.
As the input power is increased the receiver gain of the system decreases and the noise figure rises progressively.
If we increase the attenuation coefficient the noise figure of the system rises as the gain of the system is decreasing. Gain of the system is the ratio of the output signal of the amplifier to the input signal . Noise figure tells us about the level of noise being added to the signal in the amplifier.
V.CONCLUSION
For the analysis and simulation of the optical transmission system the journals incorporating these broad ideas are studied in order to propose an idea for the design and simulation of the optical transmission network .The optical transmission network consists of information source , transmitter , transmitter channel , receiver and the destination.. The information is transmitted in the network through the optical carrier wave from the transmitter to the receiver. The optical transmission system is modelled on the optisystem software and the parameters of the system are found out .Then we analysed the results of the simulation and it could be said that the length of the fiber optical cable and the attenuation coefficient is directly proportional of noise figure. Noise figure tells that how much noise is added to the signal. As the gain is getting lower with the increasing length. Even though the input power is increased through the use of EDFA output power is decreased with the compression of the gain.
In this paper after having a comparative study we found that the transmission system having the NRZ pulse is best suited for the transmission system as it provides the highest gain and output power among all the pulses we worked upon.
ACKNOWLEDGEMENTS
First of all, the special appreciation and thanks go to Bharti vidyapeeth College of engineering,Pune for the knowledge , supervision of this project and the required guidance for the completion of the project. The supervision and support by the Prof. Deepak Kumar Rayhas truly helped in the progress of this project. Every team member contributed whole heartedly and sincerely for the completion of this project. We would also like to acknowledge the fact that the optisystem software is provided by the TEQIP-11.
REFERENCES
1. IOSR journal of engineering
2. Chong Wing Keong, K R Subramanian, V K Dubey, “Optical Fiber System for Video and Telemetry Signal.” Singapore Polytechnic,
Electronics and Comm Engineering, School of Electrical and Electronic Engineering, Nanyang Technology University, Singapore.