Article
Multi-Criteria Decision Making (MCDM) Model for
Seismic Vulnerability Assessment (SVA) of Urban
Residential Buildings
Mohsen Alizadeh1, Mazlan Hashim2,* , Esmaeil Alizadeh3, Himan Shahabi4 , Mohammad Reza Karami5, Amin Beiranvand Pour6,* , Biswajeet Pradhan7,8and Hassan Zabihi9
1 Department of Urban Regional Planning, Faculty of Built Environment, Universiti Teknologi Malaysia (UTM), Johor 81310, Malaysia; alizadeh.mohsen2003@yahoo.com
2 Geoscience and Digital Earth Centre (INSTeG), Research Institute for Sustainable Environment, Universiti Teknologi Malaysia, Johor Bahru 81310, Malaysia
3 Faculty of Business and Economic, Technische Universitat Bergakademie Freiberg, 09599 Freiber, Germany; alizadeh.esmaeil.1985@gmail.com
4 Department of Geomorphology, Faculty of Natural Resources, University of Kurdistan, Sanandaj 15175-66177, Iran; h.shahabi@uok.ac.ir
5 Department of Social Science, Faculty of Humanities and Social Sciences, Payam Noor University, Tehran 4697-19395, Iran; karami_mohammadreza@ymail.com
6 Korea Polar Research Institute (KOPRI), Songdomirae-ro,Yeonsu-gu, Incheon 21990, Korea
7 Centre for Advanced Modelling and Geospatial Information Systems (CAMGIS), Faculty of Engineering and Information Technology, University of Technology Sydney, New South Wales 2007, Australia;
Biswajeet.Pradhan@uts.edu.au
8 Department of Energy and Mineral Resources Engineering, Choongmu-gwan, Sejong University, 209 Neungdong-ro Gwangjin-gu, Seoul 05006, Korea
9 Department of Geoinformation, Faculty of Geoinformation and Real Estate, Universiti Teknologi Malaysia, UTM Skudai, Johor 81310, Malaysia; Hassan.zabihi@gmail.com
* Correspondence: mazlanhashim@utm.my (M.H.); beiranvand.amin80@gmail.com (A.B.P.); Tel.: +607-5557694 (M.H.); +82-327-605-472 (A.B.P.)
Received: 28 September 2018; Accepted: 12 November 2018; Published: 14 November 2018
Abstract:Earthquakes are among the most catastrophic natural geo-hazards worldwide and endanger numerous lives annually. Therefore, it is vital to evaluate seismic vulnerability beforehand to decrease future fatalities. The aim of this research is to assess the seismic vulnerability of residential houses in an urban region on the basis of the Multi-Criteria Decision Making (MCDM) model, including the analytic hierarchy process (AHP) and geographical information system (GIS). Tabriz city located adjacent to the North Tabriz Fault (NTF) in North-West Iran was selected as a case study. The NTF is one of the major seismogenic faults in the north-western part of Iran. First, several parameters such as distance to fault, percent of slope, and geology layers were used to develop a geotechnical map. In addition, the structural construction materials, building materials, size of building blocks, quality of buildings and buildings-floors were used as key factors impacting on the building’s structural vulnerability in residential areas. Subsequently, the AHP technique was adopted to measure the priority ranking, criteria weight (layers), and alternatives (classes) of every criterion through pair-wise comparison at all levels. Lastly, the layers of geotechnical and spatial structures were superimposed to design the seismic vulnerability map of buildings in the residential area of Tabriz city. The results showed that South and Southeast areas of Tabriz city exhibit low to moderate vulnerability, while some regions of the north-eastern area are under severe vulnerability conditions. In conclusion, the suggested approach offers a practical and effective evaluation of Seismic Vulnerability Assessment (SVA) and provides valuable information that could assist urban planners during mitigation and preparatory phases of less examined areas in many other regions around the world.
ISPRS Int. J. Geo-Inf.2018,7, 444 2 of 22
Keywords:analytic hierarchy process AHP; GIS; seismic vulnerability assessment (SVA); residential buildings; geotechnical vulnerability; structural vulnerability
1. Introduction
assigned to the criteria (layers) and the alternatives (classes) of each criterion was calculated based on the analytic hierarchy process (AHP). The geotechnical and structural vulnerability maps have been developed using geographical information system (GIS). Herein, Geographic Information System-based Multi-Criteria Decision Analysis (GIS-based MCDA) provides a collection of powerful techniques and procedures converting spatial and non-spatial data into information within decision maker’s own judgment [37]. Finally, the seismic status of residential buildings at the time of earthquake occurrence has been analysed by overlaying these two maps. The main questions that can be considered for this investigation are: (i) can MCDM methods be implemented for SVA in urban areas addressing the shortage of the current knowledge?; (ii) is it possible to propose novel insights into the criteria implemented for SVA?; and (iii) does the MCDM model for SVA of urban residential buildings provide useful information in a real urban environment? Therefore, this research contributes to the SVA of urban residential buildings by (i) revealing the necessity and efficiency of applying MCDM methods for SVA in areas to treat the inadequacy of the existing knowledge; and (ii) proposing an innovative insight into the adopted criteria. Subsequently, seismic risk indicators were considered in two main categories, including the indicators that influence ground motion intensity and the indicators pertinent to structural properties that influence buildings’ vulnerability. The proposed method was implemented in Tabriz city (Figure1), which is a seismic hazard-prone metropolis in the northwest of Iran [12,26,38,39]. The main objective of this research is to identify urban statistical units with higher residential building damage estimates in municipality zones of Tabriz. The most devastating earthquake magnitude that Tabriz has experienced, based on the historical records, is as large as Ms ~ 7.7 (1780 A.D), which was due to the movement of the North Tabriz Fault (NTF) [40]. This was hypothesised as the earthquake scenario of the present study. However, damage caused by secondary disasters such as liquefaction, landslides, fire, and explosions are not included in this study. This research accomplishes that the suggested approach can be a practical model for a quick and efficient SVA in urban areas to handle the incorporated uncertainties.
2. Materials and Methods
2.1. Geological and Seismic Characteristics of the Case Study
ISPRS Int. J. Geo-Inf.2018,7, 444 4 of 22
Historical records and instrumental archives prove that NW Iran and Eastern Turkey were struck by many destructive earthquakes [47]. The most recent and the largest earthquake is Mw 7.1, on 23 October 2011, the Van earthquake, which was linked to the reverse slip on the NE-SW trending fault [48]. Seismologists believe that another strong earthquake will probably occur in Tabriz city. Furthermore, historical studies have revealed that Tabriz was shattered by numerous destructive earthquakes necessitating the development of frameworks for local and national assessment on an urban scale. However, there are no sufficiently detailed or descriptive records of these events to permit an accurate assessment of the ground devastation and deformations [49,50].
ISPRS Int. J. Geo-Inf. 2018, 7, x FOR PEER REVIEW 4 of 23
reverse slip on the NE-SW trending fault [48]. Seismologists believe that another strong earthquake will probably occur in Tabriz city. Furthermore, historical studies have revealed that Tabriz was shattered by numerous destructive earthquakes necessitating the development of frameworks for local and national assessment on an urban scale. However, there are no sufficiently detailed or descriptive records of these events to permit an accurate assessment of the ground devastation and deformations [49,50].
Figure 1. Geographical location of the East Azarbaijan province and Tabriz city in relation to the political provincial and national border.
2.2. Analytic Hierarchy Process (AHP) Model
Typically, decision-makers are required to adopt definite criteria to make a decision. If the criteria are quantitative, then somewhat similar mathematical methods are required to address them. Conversely, since the decision-making criteria can be either quantitative or qualitative conflicts can arise. However, this can be addressed using needs-specific methods like multi-criteria decision making (MCDM) procedures. Therefore, the MCDM comprises a series of methods (e.g., correlation analysis or weighted sum) that permits specialists to consider and allocate marks or to classify the collection of criteria linked to the specific issue [51,52]. Therefore, the combination of MCDM and GIS-based methods presents an exclusive capacity to manage and analyze spatial data resulting in various spatial decisions. The most commonly applied method of the MCDM reported in the literature is the analytic hierarchy process (AHP) [53]. This procedure applies the three principles of decomposition, comparative judgment and prioritized synthesis. During the decomposition stage, the decision-making problems are disintegrated into the hierarchy form based on the various elements. Generally, the first stage involves developing a criteria and sub-criteria tree structure. The comparative judgment principle comprises of a couple of wise assessments of accessible alternatives at the hierarchical level. Hence, the level elements are matched with other elements of a similar level so that the relative importance of each is computed as presented in Table 1.
Figure 1. Geographical location of the East Azarbaijan province and Tabriz city in relation to the political provincial and national border.
2.2. Analytic Hierarchy Process (AHP) Model
Table 1.Fundamental scale for pairwise comparisons in the AHP [54].
Weight/Rank Intensities
1 equal
3 moderately dominant
5 strongly dominant
7 very strongly dominant
9 extremely dominant
2, 4, 6, 8 intermediate values Reciprocals for inverse judgments
Application of the AHP method in spatial decision making involves the following steps.
• Calculating the criteria scores. Each alternative is compared pairwise with respect to a specific criterion to obtain the scores (x1, . . .xn) of alternatives. The eigenvectors are obtained after normalising the judgmental matrices.
• Calculating the criteria weights. Saaty (2008) [54] used the lambda max technique to obtain criteria weights by applying the pair-wise comparison method. Alternatives are compared pairwise with respect to each criterion to obtain weights (wi. . .wn). Every matrix has a set of eigenvalues and for every eigenvalue, there is a corresponding eigenvector. In Saaty’s lambda max technique, a vector of weights is defined as the normalised eigenvector corresponding to the largest eigenvalueλmax.
• Local priorities and consistency of comparisons.Once the judgmental matrix of comparisons of criteria with respect to the goal has been evaluated, the local priorities of criteria are obtained and the consistency of the judgments is determined. The scale of the pairwise comparison was introduced by Saaty (Table1). It has been generally agreed that priorities of criteria can be estimated by finding the principal eigenvector w of the matrix A. That is:
AW =λmaxω (1)
When the vector is normalized, it becomes the vector of priorities of the criteria with respect to the goal.λmax is the largest eigenvalue of the matrix A and the corresponding eigenvector w contains only positive entries. The consistency of the judgmental matrix can be determined by a measure called the consistency ratioCRdefined as:
CR= CI
RI (2)
where RI is the random index andCIis the consistency index which provides a measure of departure from consistency. The consistency index is calculated as:
CI = (λmax−n)
n−1 (3)
where λmax is the largest eigenvalue of the matrix A and n is the number of criteria. RI is the consistency index of a randomly generated reciprocal matrix from the 9-point scale, with reciprocals forced. Saaty (1980, 2000) [53,55], has provided average consistencies (RI values) of randomly generated matrices (up to size 11_11) for a sample size of 500. The RI values for matrices of different sizes are shown in Table2[56]. If the CR of the matrix is higher, it means that the input judgments are not consistent, and hence are not reliable. In general, a consistency ratio of 0.10 or less is considered acceptable. If the value is higher, the judgments may not be reliable and needs to be elicited again.
Table 2.The average consistencies of random matrices (The Random Index—RI-values).
Size 1 2 3 4 5 6 7 8 9 10
ISPRS Int. J. Geo-Inf.2018,7, 444 6 of 22
The weight results computed are considered satisfactory as long as reasonable values of the consistency ratio are obtained. In this paper, the analytic hierarchy technique was adapted to collectively assess the spatial information required to devise a map of seismic vulnerability for Tabriz city and the residential buildings therein. Apropos of the above, the methods approved in the study are defined as such. Lastly, the schematic for the seismic vulnerability map in the research study area is presented in Figure2based on AHP and GIS techniques.
ISPRS Int. J. Geo-Inf. 2018, 7, x FOR PEER REVIEW 6 of 23
Table 2. The average consistencies of random matrices (The Random Index—RI-values).
Size 1 2 3 4 5 6 7 8 9 10
RI 0 0 0.58 0.90 1.12 1.24 1.32 1.41 1.45 1.49
The weight results computed are considered satisfactory as long as reasonable values of the consistency ratio are obtained. In this paper, the analytic hierarchy technique was adapted to collectively assess the spatial information required to devise a map of seismic vulnerability for Tabriz city and the residential buildings therein. Apropos of the above, the methods approved in the study are defined as such. Lastly, the schematic for the seismic vulnerability map in the research study area is presented in Figure 2 based on AHP and GIS techniques.
Figure 2. Flowchart of the methodology illustrating the various stages of the analysis for the preparation of the seismic vulnerability map of the study area.
Figure 2.Flowchart of the methodology illustrating the various stages of the analysis for the preparation of the seismic vulnerability map of the study area.
The model equation proposed by ref. [57] was used to compute the over-all values in the study. Therefore, the individual weighted output pixels in the vulnerability maps (Wi) was computed based on the following relation:
Wi=
∑
j
xijwj, (4)
The termsxij represent the valued rank of theith class based on thejth layer, andwjis the normalized weight of thejth layer. The absolute weight can be acquired by increasing the normalized weighted rate of every layer in the consistent rank and sum of the layers in the class.
2.3. Kernel Density Estimation (KDE)
Kernel density estimation (KDE) is a non-parametric way to estimate the probability density function of a random variable. Kernel density estimation is a fundamental data smoothing problem where inferences about the population are made, based on a finite data sample [58,59]. Let (x1,x2, . . . ,xn)
be a univariate independent and identically distributed sample drawn from some distribution with an unknown densityƒ. We are interested in estimating the shape of this functionƒ. Itskernel density estimatoris
∧
fh(x) = 1
n
n
∑
i=1kh(x−xi) =
1 nh
n
∑
i=1 kx−x
i
h
(5)
where Kis the kernel—a non-negative function—and h> 0 is a smoothing parameter called the bandwidth. A kernel with subscripthis called the scaled kerneland defined asKh(x) = 1/h K(x/h).
Intuitively one wants to choosehas small as the data will allow; however, there is always a trade-off between the bias of the estimator and its variance. The KDE model was used to obtain the density of the layers of the buildings quality, buildings materials, the size of buildings blocks and buildings floors density in this study.
2.4. Data Preparation and Analysis
ISPRS Int. J. Geo-Inf.2018,7, 444 8 of 22
Table 3.The acquired data and the stakeholder organizations.
Papered Data Abbreviation Scale Source
Distance to fault DF 1.100000 1
Percent of Slope PS 1.2000 6
Geology PG 1.100000 2
Buildings Materials Density BMD 1.2500 4
Size of Building block Density SBDD 1.2500 4
Quality of Buildings Density QBD 1.2500 5
Buildings Floors Density BFD 1.2500 4
1. Consulting engineering of Tehran Padil. http://www.tehranpadir.com. 2. Iranian Geological organization. http://www.gsi.ir/. 3. Census Center of IRAN.http://www.amar.org.ir/. 4. Department of road and Urbanity (East Azerbaijan Province).http://ea-mrud.ir/. 5. The municipality of Tabriz City.http://www.tabriz.ir. 6. DEM 30-m Aster.http://earthexplorer.usgs.gov.
2.4.1. Geotechnical Vulnerability Factors
For the regions with seismic activity, evaluating the geotechnical seismic vulnerability is vital for urban expansion and development. As a result, to ignore or not classifying areas with a significant risk of earthquakes enhances the probability of seismic vulnerability and destruction. In general, seismic hazards are typically estimated by examining previous earthquake activity in the area. Consequently, the confirmation related to the probability of the structure tolerates disturbances inside the fault zones and the mode of travel of the seismic waves above the crust and overlying soil beneath the sites. It is important to reiterate that during an earthquake, the incidence of surface separation, soil liquefaction, and landslides, accompanied by peak ground acceleration (PGA), constitute the secondary events rising from the ground movement, which intensify the seismic vulnerability and devastation. Therefore, they must be considered when estimating the overall seismic vulnerability. However, the occurrence of these actions is linked to the subsurface plane above a major release and after effects such as movement and folding such as lateral spreading. Due to inadequate data on layered sub-surfaces and surface rupture, landslides and soil liquefaction in Tabriz city were not analysed in this study.
Distance to Fault
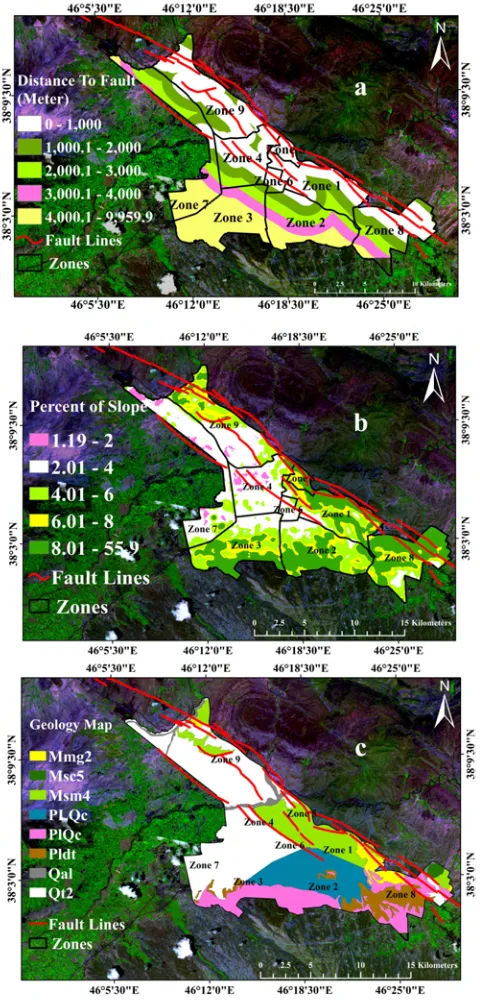
Among the major procedures employed for preventing the devastating impact of earthquakes is to avoid the area with high risks. Therefore, the choice of location is an essential stage in planning buildings or settlements located in seismic susceptible zones. The importance of site location is a vital approach to risk assessment and hence high-risk areas should be avoided. This factor (Distance to a fault) has the highest importance and rate among the applied models in the evaluation of vulnerability. Typically, the vulnerability factor decreases by increasing the distance from the fault lines and vice-versa. According to Figure3a, with the exception of zone 3 and industrial sites located southwest part of the city, other zones are not ideal because of their locations nearby the faults. Generally, this is because the fault line passes through the other zones except for zones 2 and 3 in Tabriz municipality. Therefore, land use in these areas particularly for residential and commercial uses is unsuitable. However, the solution to the underlying problem requires a comprehensive review of Tabriz’s situation particularly due to its vulnerability to earthquakes. In addition, the settlement of large parts of the city on fault lines shows the deteriorating condition of the outlined areas.
Slope
structural densities on surfaces. In this case, avoiding construction on these surfaces is important. According to the location of the city, Tabriz is idyllically located on lands with gradients below 5%, as depicted in Figure3b. Therefore, large parts the northern of the city comprise marginal regions with highly dense population located on lands of gradients above 5%. Likewise, the southern areas do not demonstrate complimentary conditions based on a gradient. Nonetheless, improved conditions occur at comparatively large distances from fault lines, where the population and structural density are low.ISPRS Int. J. Geo-Inf. 2018, 7, x FOR PEER REVIEW 10 of 23
Figure 3. Distribution of (a) Fault systems (b) Slope gradients and (c) Geology map of Tabriz city. Mmg2 = Interlayer of greenish grey marl associated with an interlayer of gypsum- bring sandy marl. Msc5 = Interbedded red conglomerate with sandstone and red marl. Msm4 = Sandstone and red marl. Pldt = Diatomic and fish interbedded with fine particles sediment. Plqc = Interlayer of semi-hard conglomerate associated with sandstone and pumice. Plqc = Interlayer of semi-hard conglomerate
ISPRS Int. J. Geo-Inf.2018,7, 444 10 of 22
Geology
The sustainable use of underwater resources in urban areas requires an in-depth understanding of geological and hydrological processes. Furthermore, this comprises the short and long-term impact of human activities on underwater resources [63]. In addition, the identification of the body of land is significantly important in urban and regional planning. These form factors include the soil type, gradient, and texture. Other factors include the type and composition of the rocks as well as water permeability along with the manifestation of fractures and faults located on the land. The outlined forms directly influence the geological structure and rock-forming elements considered vital for urban design and planning. The city of Tabriz is geographically comprised of the resulting units such as red marl, ridge sandstones and early alluvial barracks. The red marls include an interchange of green, grey, and red with the internal layers comprised of sandy, gypseous, and saltine marls. Conversely, the contemporary alluvial includes residues of clastic granules and sediments of diatom fish. Additionally, the sandstones layers, pyroclastic rocks, basic and ultra-basic rocks make up the semi-rigid conglomerate. This also involves puns and red conglomerate with an interchange of sandstone and red marl. Figure3c shows the geology map of Tabriz city.
2.4.2. Factors Influencing Structural Vulnerability
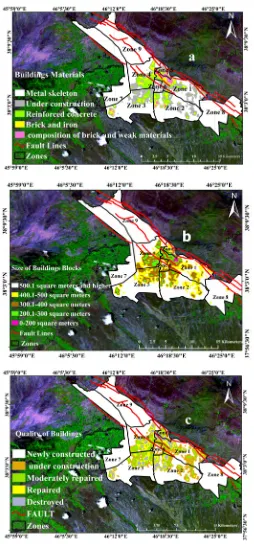
The historic and geographic scope of Tabriz city along with the diversity of its citizen’s livelihoods means that the city is structurally diverse. In general, the structures in Tabriz city comprise of Qajar era buildings which are around 100 years old, merged with villages with other buildings that date back 20 to 50 years, along with new constructions and towers. Consequently, the structural vulnerability of a city with such varied distribution and native structures requires the experiences of past earthquakes, based on the prepared Standard 2800 [36], and studies in the literature [29,32,33,35,64–68]. After extracting significant factors like materials, age, quality of construction, along with the seismic resonance, structural coefficients, and scoring the parameters, the map of structural vulnerability was generated for Tabriz city (Figure 4a–d). It is noteworthy to state that this aspect of the research employed additional categorizations according to Standard 2800. This is a collection of guidelines established at the Building and Housing Research Centre of Iran from past experiences with earthquakes. This is the single most official and scientific material for the design and evaluation method for seismic-resistant structures and determining the seismic vulnerability of earthquake-prone structures. As outlined in the guidelines, the key to the seismic stability of structures is based on the building materials, the size of building blocks, quality of the buildings, and building floors.
Buildings Materials
Table 4.Rating type of building’s materials.
Classification’s Type of Materials Quality Code
Cemented block, iron, stone, the composition of brick and weak materials 1
Brick and iron 2
Reinforced concrete and other composite materials 3
Under construction 4
Metal skeleton 5
Size of Buildings Blocks
The evaluation and segmentation require comprehensive assessment and knowledge of the geometry of land and its properties. The specification of buildings directly impacts the structural performance, construction characteristics, and network of roads vital to the evaluation of the vulnerability index. In the evaluation of vulnerability to earthquakes, the shape and geometric size of the land structure are vital (see Figure4b). In practice, the plots of land characterized by large yet consistent shapes or sizes are less vulnerable. The lower limit of segmented land is typically 200 m2 although this threshold is not constant and may vary according to the local economy or environmental conditions. The segmentation of blocks in this study is presented in Table5.
Table 5.Rating the segmentation of buildings.
Classification of the Segmentation of Buildings (m2) Rating
0–200 square meters 1
200.1–300 square meters 2
300.1–400 square meters 3
400.1–500 square meters 4
500.1 square meters and higher 5
Buildings Quality
The design of a building or structure includes the collaboration of different groups, each responsible for different sections. As a result, the structural quality is reliant on various factors, including the employer’s level of education and income. Other pertinent factors include the structural design standards, quality of manufactured materials, and the insurance of the structure [25]. The quality of newly constructed, repaired or destroyed buildings is a major indicator of vulnerability assessment. The quality of buildings and its properties such as resistance against earthquakes can be measured on a scale of 1–5 with the highest score being 5 as presented in Table6. After rating the quality of buildings as an attribute table (Table6), the required density was determined using the Kernel Density Estimation (KDE) in ARC-GIS environment. The Kernel Density function was functioned based on three factors (i) distance (bandwidth or band radius of analysis), (ii) a number of phenomena, and (iii) their rates (See Figure4c).
Table 6.Rating the quality of buildings.
Classification of Building’s Quality Quality Code
Destroyed 1
Repaired 2
Moderately repaired 3
Especial and under construction 4
Newly constructed and suitable 5
Buildings Floors
ISPRS Int. J. Geo-Inf.2018,7, 444 12 of 22
altitude has failed to lower vulnerability. Nonetheless, the number of floors in buildings remains an important dynamic in measuring seismic vulnerability. The pattern obtained from the Kernel Density Estimation (KDE) function clearly displays the density of buildings based on the number of residential units and floors within the 320 m radius (see Figure4d). Therefore, increasing the number of floors in high-risk areas must be strictly prohibited through enforcement of statutory regulations and strict supervision by relevant authorities.ISPRS Int. J. Geo-Inf. 2018, 7, x FOR PEER REVIEW 13 of 23
Figure 4. Distribution of (a) buildings materials (b) size of buildings density (c) quality of buildings and (d) buildings floor in Tabriz city.
3. Results
Using AHP and determining the importance of each used sub-factors and indicator in the study, with respect to two main factors (Tables 7 and 8), the results are as follows.
Table 7. Pairwise comparison matrix, sub-factors weights of the data layers.
Geotechnical Sub-Factor Factors Distance to Fault Geology Percent of Slope
Distance to Fault 1 3 3
Geology 1/3 1 5
Percent of Slope 1/3 1/5 1
∑ 1.66 4.2 9
Structural sub-Factors Buildings
Materials
Quality of
Buildings Size of Buildings Blocks Buildings Floors Buildings Materials 1 3 5 7 Quality of Buildings 1/3 1 3 3 Size of Buildings Block 1/5 1/3 1 3 Buildings Floors 1/7 1/3 1/3 1
∑ 1.67 4.66 9.33 14
Main Factors Geotechnical Structural
Geotechnical 1 2
Structural 1/2 1
Σ 1.50 3
Table 8. List of the dataset and computed weights and Consistency ratio of the data layers.
Geotechnical Sub-Factors Distance to Fault Geology Percent of Slope Weights
Distance to Fault 0.60 0.56 0.55 0.59
Geology 0.30 0.36 0.40 0.35 Percent of Slope 0.1 0.08 0.05 0.07
Consistency ratio: 0.05
Structural Sub-Factors Buildings
Materials
Quality of Buildings
Size of Buildings
Blocks Buildings Floors Weights Buildings Materials 0.56 0.52 0.52 0.51 0.51 Quality of Buildings 0.28 0.26 0.23 0.27 0.26 Size of Buildings Block 0.07 0.10 0.10 0.14 0.10 Buildings Floors 0.09 0.12 0.09 0.08 0.09 Consistency ratio: 0.09
Main Factors Geotechnical Structural Weights
Geotechnical 0.70 0.63 0.66 Structural 0.30 0.38 0.34 Consistency ratio: 0.01
Figure 4.Distribution of (a) buildings materials (b) size of buildings density (c) quality of buildings and (d) buildings floor in Tabriz city.
3. Results
Using AHP and determining the importance of each used sub-factors and indicator in the study, with respect to two main factors (Tables7and8), the results are as follows.
Table 7.Pairwise comparison matrix, sub-factors weights of the data layers.
Geotechnical Sub-Factor Factors Distance to Fault Geology Percent of Slope
Distance to Fault 1 3 3
Geology 1/3 1 5
Percent of Slope 1/3 1/5 1
∑ 1.66 4.2 9
Structural sub-Factors Buildings Materials Quality of Buildings Size of Buildings Blocks Buildings Floors
Buildings Materials 1 3 5 7
Quality of Buildings 1/3 1 3 3
Size of Buildings Block 1/5 1/3 1 3
Buildings Floors 1/7 1/3 1/3 1
∑ 1.67 4.66 9.33 14
Main Factors Geotechnical Structural
Geotechnical 1 2
Structural 1/2 1
Σ 1.50 3
Table 8.List of the dataset and computed weights and Consistency ratio of the data layers.
Geotechnical Sub-Factors Distance to Fault Geology Percent of Slope Weights
Distance to Fault 0.60 0.56 0.55 0.59
Geology 0.30 0.36 0.40 0.35
Percent of Slope 0.1 0.08 0.05 0.07
Consistency ratio: 0.05
Structural Sub-Factors Buildings Materials
Quality of Buildings
Size of Buildings
Blocks Buildings Floors Weights
Buildings Materials 0.56 0.52 0.52 0.51 0.51
Quality of Buildings 0.28 0.26 0.23 0.27 0.26
Size of Buildings Block 0.07 0.10 0.10 0.14 0.10
Buildings Floors 0.09 0.12 0.09 0.08 0.09
Consistency ratio: 0.09
Main Factors Geotechnical Structural Weights
Geotechnical 0.70 0.63 0.66
Structural 0.30 0.38 0.34
ISPRS Int. J. Geo-Inf.2018,7, 444 14 of 22
Generating Geotechnical, Structural and Overlay Maps
The first map acquired through processing the geotechnical susceptibility of residential buildings in Tabriz city is based on five categories, namely very high, high, medium, low and very low (Figure5). The results showed that 20.11% of the entire area was extremely vulnerable. High, moderate, low and very low vulnerable zones represent 12.91%, 29.31%, 23.35% and 14.33% of the area, respectively (Table9). Based on the geographic position, the southeast areas of the city comprising zones 2, 3 and 7 represent the regions with low or very low vulnerability. Despite the high slopes in the zones 1, 2, 3, 8, and 5, because of the minimum amplitude of peak ground acceleration and the low probability of liquefaction occurrence. However, in the south to northern regions, namely zones 1, 4, 5, 6, 8 and 9 are considered highly vulnerable areas because of the North Tabriz Fault (NTF), high slope and liquefaction occurrence (see Figure5).
Table 9. The level of residential buildings vulnerability in Tabriz city according to their geotechnical vulnerability.
Vulnerability Percent
Very High 20.1
High 12.9
Moderate 29.3
Low 23.4
Very Low 14.3
SUM 100
Based on the structural vulnerability map, Tabriz city is broadly classified into five zones; very high, high, medium, low and very low, as shown in Figure6. From a numerical perspective, 2.38% of residential buildings have very high, 3.90% high, 4.93% medium, 13.47% low structural vulnerability, and 75.32% are classified as very low buildings (Table10). However, geographical distribution indicates that zones 5, 4, 3, and 2 are the most vulnerable buildings, whereas the low and very low buildings are located in zones 9, 7 and 8 (see Figure6). Earlier exploration of the area’s history shows the cause of the vulnerability or of the low and very low condition of existing buildings. Selected buildings in zones 4 and 6, which are considered as the central part of Tabriz city, were built during the era of Qajar in 1924, which means most remain untouched because of being cultural heritage.
Zone 5 and the north of zone 1 are considered the first and oldest settlements for immigrants. Hence, the structures typically fail to adapt to the prerequisite criteria. This primarily ascribed to lack of funding, cultural weakness, and low awareness of their residents. Furthermore, a few buildings are constructed without the approval of the relevant authorities or designated organizations. In addition, the expansion of the municipal borders in zones 1, 4 and 5 containing large informal settlements has exacerbated the vulnerability of buildings in these areas. For that reason, a specific strategy is essential to renovate buildings in the aforementioned zones in Tabriz city since the magnitude of high-quality steel and concrete buildings is quite small. Principally, the largest number of steel and concrete buildings can be found in zone 5, with most characterized by the low quality of construction that fails to meet the standard requirements. Consequently, strict compliance with the necessary construction standards or requirements for new buildings is necessary. However, the observance of principles of buildings construction, as well as inaccuracy of newly constructed buildings in southern parts of zones 1 and 2 by the municipal government, has resulted in low and very low vulnerable buildings in these parts.
located in zones 9, 7, 8 and other buildings in these zones are considered very safe in Tabriz city (see Figure7ISPRS Int. J. Geo-Inf. 2018). , 7, x FOR PEER REVIEW 16 of 23
Figure 5. Residential buildings vulnerability distribution showing geotechnical vulnerability in Tabriz municipality.
Table 10. The level of residential buildings vulnerability in Tabriz city according to their structural vulnerability.
Vulnerability Percent Very High 2.38
High 3.9 Moderate 4.93
Low 13.47 Very Low 75.32
SUM 100
As the foremost aim of the current study is to describe the seismic based vulnerability of the residential structures in Tabriz, it is important to overlay the final geotechnical and structural maps as depicted in Figure 7. The results show that major residential buildings situated in zones 1 and 5 along buildings in zones 2, 6 and 3 exhibits high seismic vulnerability. However, a few residential buildings located in zones 9, 7, 8 and other buildings in these zones are considered very safe in Tabriz city (see Figure 7).
Figure 5. Residential buildings vulnerability distribution showing geotechnical vulnerability in Tabriz municipality.
ISPRS Int. J. Geo-Inf. 2018, 7, x FOR PEER REVIEW 17 of 23
Figure 6. Residential buildings vulnerability distribution showing structural vulnerability in Tabriz municipality.
Figure 7. Residential buildings vulnerability distribution showing structural and geotechnical vulnerability in Tabriz municipality.
4. Discussion
The vulnerability is multi-dimensional, differential and varies across physical space and within social groups. In addition, it is scale-dependent with regards to space and units of analysis such as individual, household, region, or system with dynamic characteristics and driving forces of vulnerability change over time. Vulnerability assessment is a broad concept that can be discussed in several different contexts. However, it is not a variable that can be measured directly but can be assessed indirectly according to a set of dimensions. For assessing urban vulnerability, it is necessary to consider all main dimensions of vulnerability including environmental, physical and socio-economic [71,72]. Physical factors are usually materially oriented arising from the field of engineering, architecture and land use planning. Vulnerability from a physical perspective, despite its broad scope, Figure 6. Residential buildings vulnerability distribution showing structural vulnerability in Tabriz municipality.
Table 10. The level of residential buildings vulnerability in Tabriz city according to their structural vulnerability.
Vulnerability Percent
Very High 2.38
High 3.9
Moderate 4.93
Low 13.47
Very Low 75.32
ISPRS Int. J. Geo-Inf.2018,7, 444 16 of 22
ISPRS Int. J. Geo-Inf. 2018, 7, x FOR PEER REVIEW 17 of 23
Figure 6. Residential buildings vulnerability distribution showing structural vulnerability in Tabriz municipality.
Figure 7. Residential buildings vulnerability distribution showing structural and geotechnical vulnerability in Tabriz municipality.
4. Discussion
The vulnerability is multi-dimensional, differential and varies across physical space and within social groups. In addition, it is scale-dependent with regards to space and units of analysis such as individual, household, region, or system with dynamic characteristics and driving forces of vulnerability change over time. Vulnerability assessment is a broad concept that can be discussed in several different contexts. However, it is not a variable that can be measured directly but can be assessed indirectly according to a set of dimensions. For assessing urban vulnerability, it is necessary to consider all main dimensions of vulnerability including environmental, physical and socio-economic [71,72]. Physical factors are usually materially oriented arising from the field of engineering, architecture and land use planning. Vulnerability from a physical perspective, despite its broad scope, Figure 7. Residential buildings vulnerability distribution showing structural and geotechnical vulnerability in Tabriz municipality.
4. Discussion
on geotechnical and structural factors and the selected sub-criteria determined from combined GIS and AHP techniques. This research proposes a new rational approach independent of the study area, using a robust MCDM method, which attempts to treat the incorporated epistemic uncertainties [74]. To achieve this target, three approaches of MCDM were implemented in GIS environment [56]. A new insight on the influencing criteria was introduced in this research, which concerns the influencing criteria in two main categories: (i) structural indicator that considers the building structural properties, and (ii) the criteria that influence ground motion intensity, which takes into account the properties of the ground on which the building is constructed. The datasets pertinent to each category are introduced and implemented in a real case study, which was an earthquake-prone municipality district with high seismic risk. The results of this study suggest that the proposed method is arguably a pragmatic and quick approach to solve the complex problem of SVA under the vagueness uncertainty of the criteria influences physical seismic vulnerability. The results of the implementation also indicated that the proposed model has acceptable robustness concerning the weights of the criteria defined using the AHP method. Since all geotechnical and structural criteria, do not have equal importance and value, the vulnerability of buildings is not effective by inspecting elements individually. Therefore, the correct results can be achieved by addressing all elements concurrently. Next, the geotechnical and structural maps have been overlaid to determine the seismic vulnerability of residential buildings (see Figure7).
Meanwhile, a better understanding of the issue can be achieved by considering five main situations:
1. Buildings with very high geotechnical and structural vulnerability comprise 4.44% of buildings. The most vulnerable structures are situated in zones 5, 4 and 1, and require either demolition or reconstruction.
2. Buildings with high geotechnical and structural vulnerability make up about 5.49% of the buildings in the city of Tabriz. These buildings are mostly located in zones 2, 4, 5 and 6, and their seismic vulnerability can be reduced by the process of retrofitting.
3. Residential buildings which have moderate vulnerability from a geotechnical and structural vulnerability consists of nearly 12.28% of residential buildings in Tabriz city. Most of them are located in zones 6, 8 and 2 and a few in zones 1 and 3. Based on the age of construction, the process of retrofitting or occasionally destruction or renovation of the buildings can reduce vulnerability. 4. Residential buildings which have low vulnerability from equally a geotechnical and structural approach constitute nearly 49.37% of all buildings. The buildings are situated in zones 9, 3, 1 and 6, which are the safest groups of residential buildings in Tabriz city.
5. Residential buildings with very low vulnerability constitute 28.42% of the buildings. Therefore, taking into account the structural and geotechnical circumstances collectively, the buildings are considerably less vulnerable compared to the buildings outlined in classes 1 to 4 (Table11).
Table 11.The level of residential buildings vulnerability in Tabriz city according to both structural and geotechnical vulnerability.
Vulnerability Percent
Very High 4.44
High 5.49
Moderate 12.28
Low 49.37
Very Low 28.42
SUM 100
ISPRS Int. J. Geo-Inf.2018,7, 444 18 of 22
located in three particular zones due to their geographic positions which are situated at the North Tabriz Fault (NTF). By coinciding the AHP and Residential Buildings Vulnerability (RBV) the lowest vulnerability zones include zones 3, 7 and 9.
Table 12.Level of Residential Building Vulnerability (RBV) according to the proposed model.
Vulnerability Very High High Moderate Low Very Low Percent
Zone1 12.50 16.40 32.00 37.10 2.00 100.00
Zone 2 0.68 29.45 38.71 27.99 3.17 100.00
Zone3 0.00 10.81 5.44 31.67 52.08 100.00
Zone4 3.19 52.68 31.80 11.51 0.82 100.00
Zone5 33.50 25.53 26.76 14.20 0.01 100.00
Zone6 0.00 16.11 53.42 28.85 1.62 100.00
Zone7 0.00 0.00 4.00 4.00 92.00 100.00
Zone8 0.00 0.00 54.00 45.00 1.00 100.00
Zone9 0.00 0.00 20.80 79.20 0.00 100.00
5. Conclusions
Author Contributions:M.A. writing-original draft preparation and developing the methodology and analysis; M.H. editing, supervision, funding acquisition; E.A. collecting field data; H.S. editing the manuscript; M.R.K. analysis and processing the data; A.B.P. writing, re-constructing and editing the manuscript; B.P. editing, supervision; H.Z. processing the data and revision.
Funding:This research was funded by the Universiti Teknologi Malaysia (UTM) under HIR UTM-grant number PY/2018/02721.
Acknowledgments:The authors would like to express their thanks to Universiti Teknologi Malaysia for providing the funds for this project and supporting remote sensing and laboratory analysis. Department of Urban Regional Planning, Faculty of Built Environment, Universiti Teknologi Malaysia is acknowledged for providing all the facilities for this investigation. We are thankful to Korea Polar Research Institute (KOPRI) for cooperation during the producing of the primary version and revision of the manuscript. The University of Technology Sydney (UTS) is also acknowledged.
Conflicts of Interest:The authors declare no conflict of interest.
References
1. Lantada, N.; Irizarry, J.; Barbat, A.H.; Goula, X.; Roca, A.; Susagna, T.; Pujades, L.G. Seismic hazard and risk scenarios for Barcelona, Spain, using the Risk-UE vulnerability index method. Bull. Earthq. Eng.2010,8, 201–229. [CrossRef]
2. Rashed, T.; Weeks, J. Assessing vulnerability to earthquake hazards through spatial multicriteria analysis of urban areas.Int. J. Geogr. Inf. Sci.2003,17, 547–576. [CrossRef]
3. Iervolino, I.; Manfredi, G.; Polese, M.; Verderame, G.M.; Fabbrocino, G. Seismic risk of R.C. Building classes.
Eng. Struct.2007,29, 813–820. [CrossRef]
4. Barbat, A.H.; Carreño, M.L.; Pujades, L.G.; Lantada, N.; Cardona, O.D.; Marulanda, M.C. Seismic vulnerability and risk evaluation methods for urban areas. A review with application to a pilot area.
Struct. Infrastruct. Eng.2009,6, 17–38. [CrossRef]
5. Carreño, M.-L.; Cardona, O.; Barbat, A. Urban seismic risk evaluation: A holistic approach.Nat. Hazards 2007,40, 137–172. [CrossRef]
6. Montoya, L.; Masser, I. Management of natural hazard risk in Cartago, Costa Rica. Habitat Int. 2005,29, 493–509. [CrossRef]
7. Alam, M.S.N.; Tesfamariam, S.; Alam, M.S.N. Gis-based seismic damage estimation: Case study for the city of Kelowna, BC.Nat. Hazards Rev.2013,14, 66–78. [CrossRef]
8. Hashemi, M.; Alesheikh, A.A. A GIS-based earthquake damage assessment and settlement methodology.
Soil Dyn. Earthq. Eng.2011,31, 1607–1617. [CrossRef]
9. Hassanzadeh, R.; Nedovic-Budic, Z.; Alavi Razavi, A.; Norouzzadeh, M.; Hodhodkian, H. Interactive approach for GIS-based earthquake scenario development and resource estimation (karmania hazard model).
Comput. Geosci.2013,51, 324–338. [CrossRef]
10. HAZUS 99 Technical Manual; Federal Emergency Management Agency (FEMA): Washington, DC, USA, 1999.
11. The Study on Seismic Micro Zoning of the Greater Tehran Area in the Islamic Republic of Iran; Final Report; Tehran Municipality, Japan International Cooperation Agency (JICA): Tehran, Iran, 2000.
12. Karimzadeh, S.; Miyajima, M.; Hassanzadeh, R.; Amiraslanzadeh, R.; Kamel, B. A GIS-based seismic hazard, building vulnerability and human loss assessment for the earthquake scenario in Tabriz.Soil Dyn. Earthq. Eng. 2014,66, 263–280. [CrossRef]
13. Tang, A.; Wen, A. An intelligent simulation system for earthquake disaster assessment.Comput. Geosci.2009,
35, 871–879. [CrossRef]
14. Vicente, R.; Parodi, S.; Lagomarsino, S.; Varum, H.; Silva, J.A.R.M. Seismic vulnerability and risk assessment: Case study of the historic city centre of Coimbra, Portugal.Bull. Earthq. Eng.2011,9, 1067–1096. [CrossRef] 15. Godfrey, A.; Ciurean, R.L.; van Westen, C.J.; Kingma, N.C.; Glade, T. Assessing vulnerability of buildings to hydro-meteorological hazards using an expert based approach—An application in Nehoiu valley, Romania.
Int. J. Disaster Risk Reduct.2015,13, 229–241. [CrossRef]
16. Rezaie, F.; Panahi, M. Gis modeling of seismic vulnerability of residential fabrics considering geotechnical, structural, social and physical distance indicators in Tehran using multi-criteria decision-making techniques.
ISPRS Int. J. Geo-Inf.2018,7, 444 20 of 22
17. Arma¸s, I. Multi-criteria vulnerability analysis to earthquake hazard of Bucharest, Romania.Nat. Hazards 2012,63, 1129–1156. [CrossRef]
18. Hizbaron, D.R.; Baiquni, M.; Sartohadi, J.; Rijanta, R. Urban vulnerability in Bantul district, Indonesia— Towards safer and sustainable development.Sustainability2012,4, 2022. [CrossRef]
19. Servi, M. Assessment of Vulnerability to Earthquake Hazards Using Spatial Multicriteria Analysis: Odunpazari, Eskisehir Case Study. Master’s Thesis, Middle East Technical University, Ankara, Turkey, 2004. 20. Sinha, N.; Priyanka, N.; Joshi, P.K. Using spatialmulti-criteria analysis and ranking tool (smart) in earthquake risk assessment: A case study of Delhi region, India.Geomat. Nat. Hazards Risk2016,7, 680–701. [CrossRef] 21. Kougkoulos, I.; Cook, S.J.; Jomelli, V.; Clarke, L.; Symeonakis, E.; Dortch, J.M.; Edwards, L.A.; Merad, M. Use of multi-criteria decision analysis to identify potentially dangerous glacial lakes.Sci. Total Environ.2018,621, 1453–1466. [CrossRef] [PubMed]
22. Yalcin, M.; Gul, F.K. A GIS-based multi criteria decision analysis approach for exploring geothermal resources: Akarcay basin (Afyonkarahisar).Geothermics2017,67, 18–28. [CrossRef]
23. Silavi, T.; Delavar, M.R.; Malek, M.R.; Kamalian, N.; Karimizand, K. An integrated strategy for GIS-based fuzzy improved earthquake vulnerability assessment. In Proceedings of the Second International Symposium in Geo-Information for Disaster Management, ISPRS, Goa, India, 25–26 September 2006; p. 6.
24. Samadi Alinia, H.; Delavar, M.R. Tehran’s seismic vulnerability classification using granular computing approach.Appl. Geomat.2011,3, 229–240. [CrossRef]
25. Moradi, M.; Delavar, M.R.; Moshiri, B. A GIS-based multi-criteria decision-making approach for seismic vulnerability assessment using quantifier-guided owa operator: A case study of Tehran, Iran.Ann. GIS2015,
21, 209–222. [CrossRef]
26. Alizadeh, M.; Ngah, I.; Hashim, M.; Pradhan, B.; Pour, A.B. A Hybrid Analytic Network Process and Artificial Neural Network (ANP-ANN) Model for Urban Earthquake Vulnerability Assessment.Remote Sens. 2018,10, 975. [CrossRef]
27. Maithani, S.; Sokhi, B.S. Radius: A methodology for earthquake hazard assessment in urban areas in a GIS environment, Case study Dehradun Municipal area. ITPI2004,3, 55–64. Available online: http: //itpi.org.in/pdfs/july2004/chapter7.pdf(accessed on 2 September 2013).
28. Gulati, B. Earthquake Risk Assessment of Buildings: Applicability of HAZUS in Dehradun, India. Master’s Thesis, ITC, Enschede, The Netherlands, 2006.
29. Thapaliya, R. Assessing Building Vulnerability for Earthquake Using Field Survey and Development Control Data: A Case Study in Lalitpur Sub Metropolitan City, Nepal. Master’s Thesis, ITC, Enschede, The Netherlands, 2006.
30. Cole, S.W.; Xu, Y.; Burton, P.W. Seismic hazard and risk in Shanghai and estimation of expected building damage.Soil Dyn. Earthq. Eng.2008,28, 778–794. [CrossRef]
31. Nath, S.K.; Thingbaijam, K.K.S. Seismic hazard assessment—A holistic microzonation approach.Nat. Hazards Earth Syst. Sci.2009,9, 1445–1459. [CrossRef]
32. Zahraie, M. and Ershad, L. Study on seismic vulnerability of building structures in Qazvin.J. Fac. Eng.2005,
39, 287–297. (In Persian)
33. Aghataher, R.; Delavar, M.R.; Nami, M.H.; Samnay, N. A Fuzzy-AHP decision support system for evaluation of cities vulnerability against earthquakes.World Appl. Sci. J.2008,3, 66–72.
34. Amini Hosseini, K.; Hosseini, M.; Jafari, M.K.; Hosseinioon, S. Recognition of vulnerable urban fabrics in earthquake zones: A case study of the Tehran metropolitan area.J. Seismol. Earthq. Eng.2009,10, 175–187. 35. Hataminejad, H.; Fathi, H.; Eshghabadi, F. Criterion vulnerability assessment earthquake about city, case
study region 10 Tehran.J. Hum. Geogr. Res.2009,68, 1–2. (In Persian)
36. Building and Housing Research Center (BHRC).Iranian Code of Practice for Seismic Resistant Design of Buildings, 1st ed.; Building and Housing Research Center: Tehran, Iran, 1988; p. 71.
37. Çetinkaya, C.; Özceylan, E.; Erba¸s, M.; Kabak, M. GIS-based fuzzy MCDA approach for siting refugee camp: A case study for southeastern Turkey.Int. J. Disaster Risk Reduct.2016,18, 218–231. [CrossRef]
38. Kamelifar, M.J.; Rustei, S.; Ahadnejad, M.; Kamelifar, Z. The Assessment of road network vulnerability in formal and informal (slum) urban tissues to earthquake hazards with crisis management approach (Case study: Zone 1 Tabriz).J. Civ. Eng. Urban2013,3, 380–385.
40. Ambraseys, N.N.; Melville, C.P.A History of Persian Earthquakes; Cambridge University Press: Cambridge, UK, 1982. (In Persian)
41. Copley, A.; Jackson, J. Active tectonics of the Turkish-Iranian Plateau. TECTONICS2006, 25, TC6006. [CrossRef]
42. Jackson, J. Partitioning of strike-slip and convergent motion between Eurasia and Arabia in Eastern Turkey and the Caucasus.J. Geophys. Res.1992,97, 12471–12479. [CrossRef]
43. Karimzadeh, S.; Cakir, Z.; Osmanoglu, B.; Schmalzle, G.; Miyajima, M.; Amiraslanzadeh, R.; Djamour, Y. Interseismic strain accumulation across the North Tabriz fault (NW Iran) deduced from InSAR time series.
J. Geodyn.2013,66, 53–58. [CrossRef]
44. Toksoz, M.N.; Arpat, E.; Saroglu, F. East Anatolia earthquake of 24 November, 1976. Nature1977, 270, 423–425. [CrossRef]
45. Djamour, Y.; Vernant, P.; Nankali, H.R.; Tavakoli, F. NW Iran-eastern Turkey present-day kinematics: Results from the Iranian permanent GPS network.Earth Planet. Sci. Lett.2011,307, 27–34. [CrossRef]
46. Berberian, M.; Arshadi, S. On the evidence of the youngest activity of the North Tabriz Fault and the seismicity of Tabriz city.Geol. Surv. Iran1976,39, 397–418.
47. Abich, O.W.H. Sur les derniers tremblement de terre dans la Perse septentrionale.Bull. Phys. Math. Acad. 1857,316, 49–72.
48. Wilson, A. Earthquakes in Persia.Bull. Sch. Orient. Stud.1930,6, 103–131. [CrossRef]
49. Akoglu, A.M.; Jonsson, S.; Cakir, Z.; Ergintav, S.; Dogan, U.; Feng, G.; Zabcı, C.The Surface Deformation and Source Parameters of the October 23rd, 2011, Mw 7.1 Van (Turkey) Earthquake from InSAR, GPS and Field Observations; EGU General Assembly: Vienna, Austria, 2012.
50. Ghayamghamian, M.R.; Mansouri, B.; Amini-Hosseini, K.; Tasnimi, A.A.; Govahi, N.Development of Fragility and Fatality Functions as Well as Site Amplification Factor in Tehran; Tehran Disaster Mitigation and Management Organization: Theran, Iran, 2012.
51. Malczewski, J. GIS-based land-use suitability analysis: A critical overview. Prog. Plan. 2004,62, 3–65. [CrossRef]
52. Dodgson, J.S.; Spackman, M.; Pearman, A.; Phillips, L.D.Multi-Criteria Analysis: A Manual; Department for Communities and Local Government: London, UK, 2009. Available online:http://eprints.lse.ac.uk/12761/
(accessed on 2 September 2013).
53. Saaty, T.L. The analytic Hierarchy Process: Planning, Priority Setting, Resource Allocation; McGraw-Hill: New York, NY, USA, 1980; 287p.
54. Saaty, T.L.; Shih, H.S. Structures in decision making: On the subjective geometry of hierarchies and networks.
Eur. J. Oper. Res.2009,199, 867–872. [CrossRef]
55. Saaty, T.L. Decision making—The analytic hierarchy and network process (AHP/ANP).J. Syst. Sci. Syst. Eng. 2004,13, 1–34. [CrossRef]
56. Abudeif, A.M.; Abdel Moneim, A.A.; Farrag, A.F. Multicriteria decision analysis based on analytic hierarchy process in GIS environment for siting nuclear power plant in Egypt.Ann. Nucl. Energy2015,75, 682–692. [CrossRef]
57. Malczewski, J.GIS and Multi-Criteria Decision Analysis; John Wiley: Toronto, ON, Canada, 1999.
58. Rosenblatt, M. Remarks on Some Nonparametric Estimates of a Density Function.Ann. Math. Stat.1956,
27, 832. [CrossRef]
59. Parzen, E. On Estimation of a Probability Density Function and Mode. Ann. Math. Stat. 1962,33, 1065. [CrossRef]
60. Yalew, L.; Yamagishi, H.; Ugawa, N. Landslide susceptibility mapping using GIS-based weighted linear combination, the case in Tsugawa area of Agano River, Niigata Prefecture, Japan.Landslides2004,1, 73–81. [CrossRef]
61. ESRI.Arc GIS Network Analyst Routing, Closest Facility, and Service Area Analysis; ESRI: Redlands, CA, USA, 2005.
62. Jeong, J.S.; Moruno, L.G.; Blanco, J.H. A site planning approach for rural buildings into a landscape using a spatial multi-criteria decision analysis methodology.Land Use Policy2013,32, 108–118. [CrossRef]
ISPRS Int. J. Geo-Inf.2018,7, 444 22 of 22
65. Japan International Cooperation Agency (JICA); Center for Earthquake and Environmental Studies of Tehran (CEST); Tehran Municipality.The Study on Seismic Microzoning of the Greater Tehran Area in the Islamic Republic of Iran; Japan International Cooperation Agency: Theran, Iran, 2000; p. 403.
66. Zangiabadi, A.; Tabrizi, N. Tehran earthquake and spatial analysis on urban area vulnerability. J. Geogr. Res. (JGR)2000,38, 115–130. (In Persian)
67. Sharifzadegan, M.H.; Fathi, H. Application of Seismic Risk Assessment Models in Urban Planning and Design. Soffeh (Journal of Architecture and Urban Planning Faculty of Shahid Beheshti University). 2008. Available online: http://www.sid.ir/en/ViewPaperprint.asp?ID=211079&varStr= (accessed on 2 September 2013). (In Persian)
68. Zekai, S. Supervised fuzzy logic modelling for building earthquake hazard assessment.Expert Syst. Appl. 2011,38, 14564–14573. [CrossRef]
69. Tavakoli, B.; Tavakoli, S. Estimating the vulnerability and loss functions of residential buildings.Nat. Hazards 1993,7, 155–171. [CrossRef]
70. Ghayamghamian, M.R.; Khanzade, K. Buildings classification and determination of dam- age function for non-engineering in Bam city.JSEE2008,39, 2–10.
71. Pelling, M.; Wisner, B.Disaster Risk Reduction: Cases from Urban Africa; Earthscan: New York, NY, USA, 2012. 72. Ghajari, Y.E.; Alesheikh, A.A.; Modiri, M.; Hosnavi, R.; Abbasi, M. Spatial Modelling of Urban Physical
Vulnerability to Explosion Hazards Using GIS and Fuzzy MCDA.Sustainability2017,9, 1274. [CrossRef] 73. Mileu, N.; Queirós, M. Integrating Risk Assessment into Spatial Planning: RiskOTe Decision Support System.
ISPRS Int. J. Geo-Inf.2018,7, 184. [CrossRef]
74. Sadrykia, M.; Delavar, M.R.; Zare, M. A GIS-Based Fuzzy Decision Making Model for Seismic Vulnerability Assessment in Areas with Incomplete Data.ISPRS Int. J. Geo-Inf.2017,6, 119. [CrossRef]