Electronic Theses and Dissertations Theses, Dissertations, and Major Papers
2013
Body Surveillance as a Moderator of the Relationship Between Fat
Body Surveillance as a Moderator of the Relationship Between Fat
Stereotypes and Body Dissatisfaction in Normal Weight Women
Stereotypes and Body Dissatisfaction in Normal Weight Women
Jean Kim
University of Windsor
Follow this and additional works at: https://scholar.uwindsor.ca/etd
Recommended Citation Recommended Citation
Kim, Jean, "Body Surveillance as a Moderator of the Relationship Between Fat Stereotypes and Body Dissatisfaction in Normal Weight Women" (2013). Electronic Theses and Dissertations. 4982. https://scholar.uwindsor.ca/etd/4982
This online database contains the full-text of PhD dissertations and Masters’ theses of University of Windsor students from 1954 forward. These documents are made available for personal study and research purposes only, in accordance with the Canadian Copyright Act and the Creative Commons license—CC BY-NC-ND (Attribution, Non-Commercial, No Derivative Works). Under this license, works must always be attributed to the copyright holder (original author), cannot be used for any commercial purposes, and may not be altered. Any other use would require the permission of the copyright holder. Students may inquire about withdrawing their dissertation and/or thesis from this database. For additional inquiries, please contact the repository administrator via email
BODY SURVEILLANCE AS A MODERATOR OF THE RELATIONSHIP BETWEEN FAT STEREOTYPES AND BODY DISSATISFACTION IN
NORMAL WEIGHT WOMEN
by
Jean Kim, B.A., B.M.Sc. (Hons)
A Thesis
Submitted to the Faculty of Graduate Studies through the Department of Psychology In Partial Fulfillment of the Requirements for the
Degree of Master of Arts at the University of Windsor
Windsor, Ontario, Canada
Body Surveillance as a Moderator of the Relationship between Fat Stereotypes and Body Dissatisfaction in Normal Weight Women
By Jean Kim
APPROVED BY:
_______________________________________________ K.J. Chandler
Department of Kinesiology
_______________________________________________ C.Y. Senn
Department of Psychology
_______________________________________________ J.L. Jarry, Advisor
Department of Psychology
AUTHOR’S DECLARATION OF ORIGINALITY !
I hereby certify that I am the sole author of this thesis and that no part of this thesis has been published or submitted for publication.
I certify that, to the best of my knowledge, my thesis does not infringe upon anyone’s copyright nor violate any proprietary rights and that any ideas, techniques, quotations, or any other material from the work of other people included in my thesis, published or otherwise, are fully acknowledged in accordance with the standard referencing practices. Furthermore, to the extent that I have included copyrighted material that surpasses the bounds of fair dealing within the meaning of the Canada Copyright Act, I certify that I have obtained a written permission from the copyright owner(s) to include such material(s) in my thesis and have included copies of such copyright clearances to my appendix.
ABSTRACT !
This study examined the moderating effect of body surveillance on the relationship between fat stereotyping and body dissatisfaction in normal weight women.
Undergraduate participants (N = 301) completed online measures assessing explicit and implicit fat stereotyping, body surveillance, and body dissatisfaction. Neither explicit nor
implicit fat stereotyping significantly predicted body dissatisfaction. Further, body surveillance did not moderate the relationship between either explicit or implicit fat stereotypes and body dissatisfaction. However, post-hoc analyses examining Caucasian
participants (N = 224) found differing results. Specifically, body surveillance significantly moderated the relationship between explicit fat stereotyping and body
dissatisfaction. Higher explicit fat stereotypes predicted greater body dissatisfaction in Caucasian women with lower body surveillance. Conversely, higher explicit fat
stereotypes predicted lower body dissatisfaction in Caucasian women with higher body
surveillance. These counterintuitive results suggest that endorsing fat stereotypes acts as a buffer against body dissatisfaction in Caucasian normal weight women with stronger
ACKNOWLEDGEMENTS
First and foremost, I would like to thank my thesis supervisor Dr. Josée Jarry, for
TABLE OF CONTENTS
AUTHOR’S DECLARATION OF ORIGINALITY ... iii
ABSTRACT ... iv
ACKNOWLEDGEMENTS ... v!
LIST OF TABLES ... x!
LIST OF FIGURES ... xi!
Chapter 1. INTRODUCTION ... 1!
Prejudice, Stereotypes, and Perceptions of Others ... 1!
Impact of Stereotypes on Perceptions of Oneself ... 4!
Psychological impact of fat stereotypes. ... 5!
How Common is the Endorsement of Fat Stereotypes? ... 6!
Explicit Versus Implicit Endorsement of Fat Stereotypes ... 8!
Clinical Relevance of Endorsing Fat Stereotypes ... 10!
Body dissatisfaction and endorsement of fat stereotypes ... 11!
Avoiding Fat versus Approaching Thin ... 14!
Fat Stereotypes versus “Fear of Fat” ... 16!
Objectification Theory ... 17!
Body Surveillance ... 18!
Body dissatisfaction and body surveillance ... 20!
The Present Study ... 22!
Hypotheses ... 25!
Participants ... 26!
Measures ... 27!
Main predictor variables ... 27!
Obese Persons Trait Survey (OPTS) ... 27!
Weight-Implicit Associations Test (W-IAT). ... 28!
Moderator variable ... 31!
Objectified Body Consciousness Scale – Surveillance Subscale (OBCSS) ... 31!
Criterion variable. ... 32!
Eating Disorder Inventory-2-Body Dissatisfaction Subscale (EDI-BD) . 32! Covariates ... 32!
Sociocultural Attitudes Toward Appearance Scale-3 – Internalization General Subscale (SATAQ-IG) ... 32!
Rosenberg Self-Esteem Scale (RSES) ... 33!
Marlowe Crowne Social Desirability Scale – Form C (MCSDS-C) ... 34!
Beck Depression Inventory-II (BDI-II). ... 34!
Demographic questionnaire. ... 35!
Procedure ... 35!
3. RESULTS ... 36!
Approach to Data Analysis ... 36!
Combining Study Versions ... 37!
Missing Data ... 40!
Descriptives ... 43!
Main Analyses ... 46!
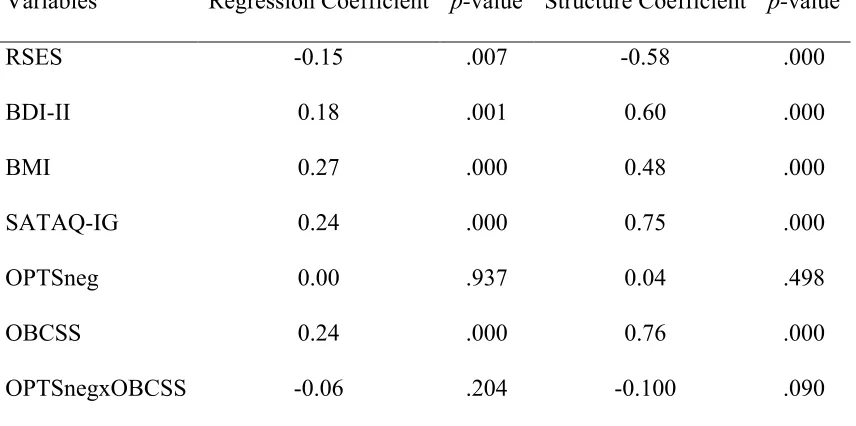
Explicit fat stereotypes ... 46!
Implicit fat stereotypes ... 51!
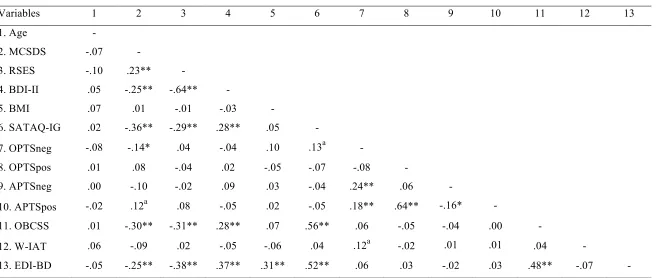
Post-Hoc Analyses: Caucasian Only ... 55!
Assumptions of multiple regression ... 57!
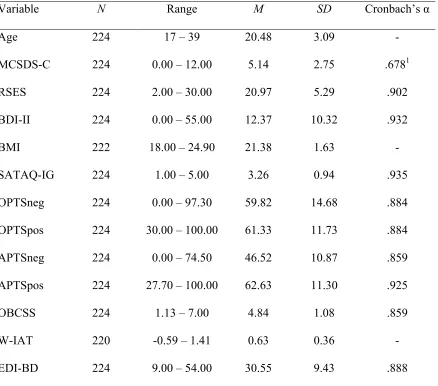
Descriptives ... 60!
Exploratory analyses ... 62!
Explicit fat stereotypes ... 62!
Implicit fat stereotypes ... 68!
4. DISCUSSION ... 73!
Hypothesis 1 ... 73!
Hypothesis 2 ... 74!
Hypothesis 3 ... 76!
Hypothesis 4 ... 77!
Higher body surveillance and higher fat stereotypes ... 80!
Higher body surveillance and lower fat stereotypes ... 81!
Lower body surveillance and higher fat stereotypes ... 81!
Lower body surveillance and lower fat stereotypes ... 81!
Hypothesis 5 ... 83!
Implicit versus Explicit Endorsement of Fat Stereotypes ... 84!
Influence of Race and Ethnicity ... 87!
Implications for Future Research ... 91!
Conclusions ... 95!
REFERENCES ... 97!
APPENDICES ... 114
Appendix A Obese Persons Trait Survey ... 114!
Appendix B Weight-Implicit Associations Test ... 120!
Appendix C Objectified Body Consciousness Scale – Surveillance Subscale ... 126!
Appendix D Eating Disorder Inventory-2 ... 128!
Appendix E Sociocultural Attitudes Toward Appearance Scale-3 ... 133!
Appendix F Rosenberg Self-Esteem Scale ... 135!
Appendix G Marlowe Crowne Social Desirability Scale – Form C ... 136!
Appendix H Beck Depression Inventory-II ... 137!
Appendix I Demographic questionnaire ... 139!
Appendix J Participant Pool Recruitment Advertisement ... 141!
Appendix K Letter of Information for Consent to Participate in Research ... 142!
Appendix L Post-Study Information Form ... 144!
LIST OF TABLES
Table 1. Mean Differences across Study Versions for All Variables ... 39
Table 2. Zero-Order Correlations Between All Variables ... 41
Table 3. Descriptive Statistics for All Variables ... 45
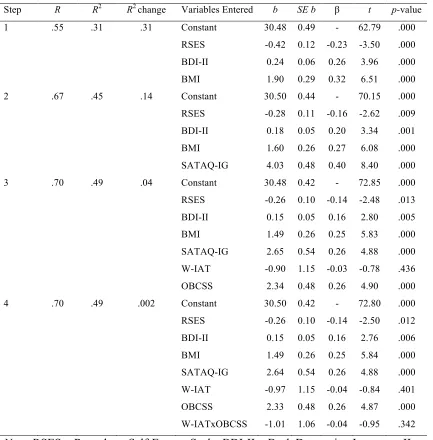
Table 4. Final Hierarchical Regression Model for Explicit Fat Stereotypes ... 48
Table 5. Regression Coefficients and Structure Coefficients for Explicit Fat Stereotypes Model ... 50
Table 6. Final Hierarchical Regression Model for Implicit Fat Stereotypes ... 53
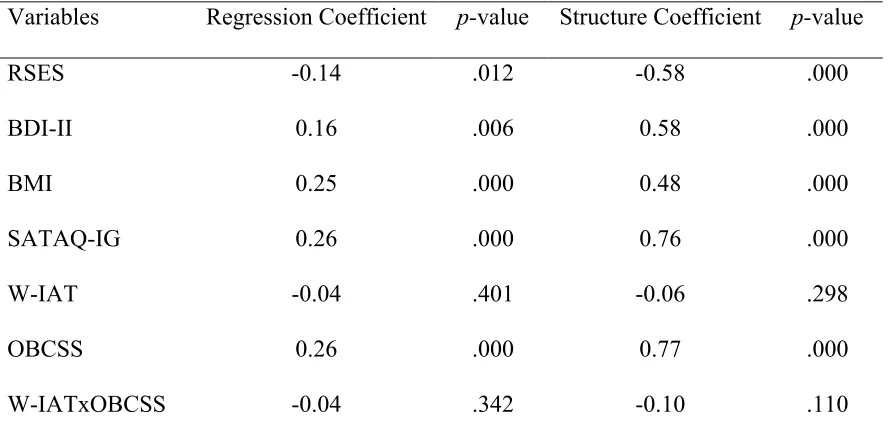
Table 7. Regression Coefficients and Structure Coefficients for Implicit Fat Stereotypes Model ... 54
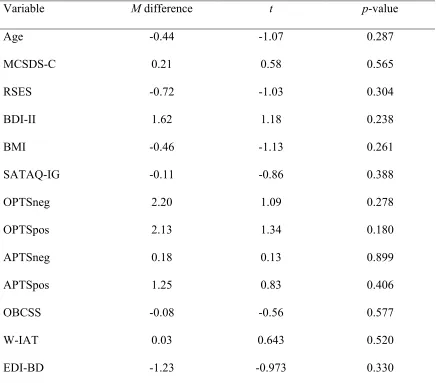
Table 8. Mean Differences across Study Versions for All Variables for Caucasian-Only Sample ... 56
Table 9. Zero-Order Correlations Between All Variables for Caucasian-Only Sample .. 58
Table 10. Descriptive Statistics for All Variables in Caucasian-Only Sample ... 61
Table 11. Final Hierarchical Regression Model for Explicit Fat Stereotypes in Caucasian-Only Sample ... 65
Table 12. Regression Coefficients and Structure Coefficients for Explicit Fat Stereotypes Model in Caucasian-Only Sample ... 66
Table 13. Final Hierarchical Regression Model for Implicit Fat Stereotypes in Caucasian-Only Sample ... 70
LIST OF FIGURES
Figure 1. The relationship between explicit fat stereotype endorsement and body
dissatisfaction at lower and higher levels of body surveillance in the Caucasian-only sample. ... 67 Figure 2. The relationship between implicit fat stereotype endorsement and body
Chapter 1: Body Surveillance as a Moderator of the Relationship Between Fat Stereotypes and Body Dissatisfaction in Normal Weight Women
Increasing societal focus on health and beauty has engendered concerns regarding the stigmatization of overweight and obese individuals. Weight prejudice is commonly defined as the negative evaluation of people who are perceived to carry excess weight (Brochu, Gawronski, & Esses, 2011; Puhl & Brownell, 2001). Prejudice against this group of individuals is described as one of the last acceptable forms of bias in modern society (Puhl & Brownell, 2001). Accordingly, research has indicated that negative attitudes toward overweight individuals are more acceptable than are negative attitudes toward individuals with physical disabilities (Latner, Stunkard, & Wilson, 2005), individuals with AIDS, and those of various races (Crandall, Eshleman, & O’Brien, 2002), among other groups. Further, weight prejudice has been demonstrated in many domains of life, including employment (e.g., Roehling, 1999), health care (e.g., Brochu & Esses, 2009; Schwartz, Chambliss, Brownell, Blair, & Billington, 2003), and education (e.g., Crandall, 1991; Puhl & Latner, 2007). Given this pervasiveness, researchers have investigated the various social and clinical consequences that result from weight
prejudice (see Puhl & Heuer, 2009 for a review). Prejudice, Stereotypes, and Perceptions of Others
negative stereotypes are thought to develop through cultural and social learning, and are considered to be a key component in the development of negative attitudes (i.e.,
prejudice) toward specific social groups (Esses, Haddock, & Zanna, 1993). Further, prejudice is expressed through discriminatory behaviours toward members of stigmatized groups (Crandall & Eshleman, 2003).
That the endorsement of negative stereotypes can lead to the development and expression of prejudice towards others has been examined in many social groups. In particular, the consequences of Black stereotypes held by Whites have been widely investigated. For example, in a famous study conducted by Kinder and Sears (1981) on voting preferences in mayoral elections, the majority of the White participants endorsed the belief that Black people do not possess classic American Protestant values of hard work and self-discipline. Those who endorsed this stereotype were less likely to vote for the Black candidate. This type of blatant expression of prejudice, however, is less widely observed in modern society because such overt expression has become socially
condemned (Crandall & Eshleman, 2003). Instead, more recent studies have examined the subtle expressions of prejudice. For example, Hodson, Dovidio, and Gaertner (2001) examined the subtle influence of a common stereotype that Black individuals are
scholastic aptitude test (SAT) scores, or high GPA and low SAT scores, were less likely to recommend the applicant’s admittance than were participants who were shown a White applicant with the same ambiguous qualifications. However, when GPA and SAT scores were congruently low or high, no differences were found in the rate of acceptance of the Black and White applicants, indicating the absence of overt expressions of prejudice. The authors concluded that when the qualifications were ambiguous, participants assimilated the Black applicant to the stereotype of intellectual inferiority, which led to the subtle expression of prejudice resulting in discriminatory decisions. Evidently, the endorsement of stereotypes contributes to the expression of prejudice toward others, although this expression may occur in subtle ways.
challenging the belief that weight is completely controllable (i.e., the stereotype that overweight people lack self-control) by presenting information about the uncontrollable causes of obesity (e.g., genetics) reduced feelings of dislike toward this group. Other studies also have demonstrated that challenging the stereotype of weight controllability reduces anti-fat attitudes (see Danielsdottir, O’Brien, & Ciao, 2010 for a review). Based on this attitude reduction, it is expected that discriminatory behaviour toward overweight and obese individuals also will be reduced, although this remains to be investigated (Danielsdottir et al., 2010). Given the important role of stereotypes in the development and expression of prejudice, the current investigation focused on the endorsement of fat stereotypes rather than general anti-fat attitudes.
Impact of Stereotypes on Perceptions of Oneself
While the above research has shown the consequences of endorsing negative stereotypes on the perception of others, other studies have examined the impact of stereotypes associated with one’s own social group on perceptions of the self. Research has shown that the awareness of negative stereotypes associated with one’s social group can be detrimental to an individual. In particular, the concept of stereotype threat purports that individuals feel apprehensive that their behaviour will confirm a negative stereotype about their group, which paradoxically leads to performance that is consistent with such stereotypes (Steele & Aronson, 1995). For example, activating the stereotype that Black people have lower intelligence than do White people negatively influences performance on tests of verbal ability in Black participants, while having no influence on the performance of White participants (Steele & Aronson, 1995). In addition to
that activating stereotypes can influence psychological well-being. For example, Steele and Aronson (1995) found that activating the Black stereotype of intellectual inferiority caused Black participants to have greater concerns with self-doubt regarding ability and competence, even after accounting for actual verbal SAT scores. Activating the same Black stereotype in White participants, however, did not result in these negative
outcomes. In a similar study of stereotype threat, Major, Spencer, Schmader, Wolfe, and Crocker (1998) found that Black participants reported lower self-esteem than did White participants after taking a test described as a measure of intellectual ability. This pattern was observed even after accounting for actual performance on the test. Thus, the
awareness of negative stereotypes of one’s social group appears to impact not only behaviour, but also one’s psychological well-being. This idea has been applied to the area of fat stereotypes, and will be discussed below.
Psychological impact of fat stereotypes. The psychological impact of fat stereotypes on overweight and obese individuals has been investigated. Seacat and Mickelson (2009) activated the fat stereotypes of poor health and laziness in an
theories of racial stereotypes have been applied to the investigation of fat stereotypes, one key difference between these two areas is the clarity of group classifications. For the most part, knowledge of one’s racial group membership is accurate and clear, even at a young age (Quintana, 1998). In contrast, identification of one’s weight category can be subjective and inaccurate, particularly for females. For example, Sciacca, Melby, Hyner, Brown, and Femea (1991) found that approximately 40% of females in their sample classified themselves as being at least moderately overweight. After calculating actual weight category, however, only 17% were objectively overweight or obese. Similarly, Paeratakul, White, Williamson, Ryan, and Bray (2002) reported that 25% of the normal weight women in their sample considered themselves to be overweight. Further,
Raudenbush and Zellner (1997) found that 35 out of 40 women who accurately reported that they were normal weight still desired to be thinner. This indicates that even those who correctly self-classify into a healthy weight category perceive extra weight or fat on their body. Because perceptions of weight are subjective, it is possible that fat
stereotypes can influence the psychological well-being of individuals who are not objectively overweight. Accordingly, the current study investigated the psychological consequences of fat stereotypes in normal weight women. Before elaborating on the potential clinical outcomes of fat stereotypes, however, it is important to document the extent to which these stereotypes are endorsed.
How Common is the Endorsement of Fat Stereotypes?
society. Many investigations have supported this hypothesis. For example, a recent population-based investigation by Hilbert, Rief, and Braehler (2008) found that 23.5% of their 1000 participants held “definite stigmatizing attitudes” toward obesity, with no differences in levels of stigma between genders. Notably, stigmatizing attitudes actually referred to stereotyped beliefs in this study. Stigma was operationally defined as
agreeing with statements of fat stereotypes, such as “fat people have no willpower”, and “most fat people are lazy”. “Definite” stigmatization was defined by the authors as an average agreement response to these statements of at least 4.0 on 5-point Likert scales. Thus, nearly a quarter of their sample strongly endorsed negative fat stereotypes, with no differences observed between genders. Additionally, Swami, Pietschnig, Stieger, Tovée, and Voracek (2010) investigated a sample of 1024 individuals, and found moderate endorsement of fat stereotypes across the total sample. Specifically, the mean
endorsement in this sample was 3.51 on 5-point scales of various fat stereotypes (e.g., laziness, insecurity), with higher values indicating greater endorsement. These large scale studies indicate that fat stereotypes are commonly endorsed in modern society.
Past research also has demonstrated the pervasiveness of fat stereotypes in children and adolescents. Cramer and Steinwert (1998) observed endorsement of fat stereotypes in children as young as 3 years old. Specifically, the stereotype that overweight and obese individuals are less friendly than normal weight or underweight individuals was studied. Children ages 3 to 5 were read a story about two fictional
Seventy-seven percent of the girls and 82% of the boys identified the chubby image as the mean character, demonstrating that fat stereotypes are observed even in young children. Furthermore, research has demonstrated that endorsement of fat stereotypes increases in adolescence (Klaczynski, Daniel, & Keller, 2009). The endorsement of fat stereotypes in children and adolescents further illustrates the pervasiveness of these beliefs.
Although the above studies have demonstrated weight bias in general samples, other researchers have studied endorsement of fat stereotypes across persons of different body mass index (BMI) categories. For example, Schwartz, Vartanian, Nosek, and Brownell (2006) examined the extent to which fat stereotypes were endorsed in
underweight, normal weight, overweight, obese, and extremely obese individuals. The researchers found an inverse relationship between BMI category and endorsement of fat stereotypes, such that thinner individuals demonstrated greater mean endorsement than did heavier individuals. Despite this relationship, heavier individuals still significantly endorsed fat stereotypes, albeit to a lesser extent than did thinner individuals. This indicates that overweight and obese individuals internalize fat stereotypes themselves. Further, Harris, Walters, and Waschull (1991) reported that endorsement of fat
stereotypes was unrelated to BMI. These authors concluded that personal experience with weight is not an important factor in endorsing fat stereotypes. Evidently, individuals across all BMI categories, at all ages, and across genders appear to hold these stereotypes, albeit to differing degrees.
Explicit Versus Implicit Endorsement of Fat Stereotypes
measures refer to self-report questionnaires that ask participants to express their opinions regarding various fat stereotypes, typically on a Likert-type scale. Implicit measures, on the other hand, refer to methods of indirectly assessing automatic beliefs, and are
intended to access processes that are outside conscious control (Greenwald, McGhee, & Schwartz, 1998). Because the expression of stereotypical beliefs is condemned in modern society (Dovidio & Gaertner, 2004), people are believed to restrain their agreement with stereotypes on explicit self-report measures by responding in a more socially acceptable manner. Thus, explicit measures are believed to underestimate the endorsement of stereotypes. Although fat stereotypes are considered to be one of the last forms of acceptable bias (Puhl & Brownell, 2001), concerns regarding the influence of social desirability on explicit endorsement of fat stereotypes in self-report measures have emerged (Teachman & Brownell, 2001). Because of this, researchers have used both explicit and implicit measures of fat stereotypes to examine whether or not results would differ.
Several studies have reported that the type of measure used in an investigation can lead to different results. For example, Schwartz et al. (2006) found strong explicit
endorsement of fat stereotypes in underweight, normal weight, and overweight individuals, while low levels of explicit endorsement were observed in obese and extremely obese individuals. In contrast, implicit endorsement of fat stereotypes was moderate to strong across all five weight categories. Similarly, Teachman and Brownell (2001) found strong implicit endorsement and weak explicit endorsement of fat
Furthermore, Teachman, Gapinski, Brownell, Rawlins, and Jeyaram (2003) found strong implicit endorsement in the absence of explicit endorsement in a general adult sample. These studies appear to support the idea that individuals consciously control the
endorsement and expression of fat stereotypes that implicit measures can identify. In contrast to these findings of weak or absent explicit endorsement, other studies have observed moderate to strong levels of both explicit and implicit endorsement. For example, Brochu and Morrison (2007) and Greenleaf, Starks, Gomez, Chambliss, and Martin (2004) found evidence for similar levels of explicit and implicit endorsement of fat stereotypes in undergraduate samples. Additionally, Vartanian, Herman, and Polivy (2005) found evidence for moderate explicit and strong implicit weight stigma among both unrestrained and restrained eaters. These studies indicate that explicit endorsement of fat stereotypes is evident in some samples. This discrepancy suggests that the impact of social desirability on responses to explicit measures of fat stereotypes is inconsistent. It is notable, however, that despite the inconsistent findings of explicit endorsement, implicit measures consistently demonstrate moderate to strong endorsement of fat stereotypes across all studies.
Although this body of research shows conflicting levels of explicit and implicit endorsement, together it indicates that the investigation of fat stereotypes likely would benefit from the use of both explicit and implicit measures to obtain more specific and accurate conclusions. Thus, the current study employed both measurement strategies. Clinical Relevance of Endorsing Fat Stereotypes
these beliefs. Notably, this research has focused on negative outcomes in overweight and obese individuals who endorse fat stereotypes. For example, Davison, Schmalz, Young, and Birch (2008) found that overweight girls who endorsed fat stereotypes reported lower global self-worth than did overweight girls who did not endorse fat stereotypes. Further, Durso and Latner (2009) found that greater endorsement of fat stereotypes was associated with lower self-esteem and greater symptoms of depression and anxiety in overweight and obese men and women. Similarly, Friedman et al. (2005) found that greater endorsement of fat stereotypes was related to lower self-esteem and greater depressive symptomatology in overweight and obese adults. Interestingly, one study that did
examine a normal weight adult sample also found that self-esteem was negatively related to endorsement of fat stereotypes (Klaczynski, Goold, & Mudry, 2004). This body of research indicates that endorsing fat stereotypes is related to negative mental health outcomes, regardless of one’s weight. One aspect of mental health that is of interest in the current investigation is body dissatisfaction.
Body dissatisfaction and endorsement of fat stereotypes. Body dissatisfaction refers to the negative subjective evaluation of one’s body, including aspects such as body shape, weight, and specific body parts (e.g., stomach, thighs; Stice & Shaw, 2002). Body dissatisfaction is observed commonly in modern society and has been reported across all weight categories (e.g., Frederick, Forbes, Grigorian, & Jarcho, 2007). Body
dissatisfaction is a key predictor of the future development of eating disorder
symptomatology (Stice, 2001), and has been described as an essential precursor to eating disorders (Polivy & Herman, 2002). This evidenced relationship between body
various factors that contribute or lead to body dissatisfaction. Accordingly, the current study focused on the potential impact of the endorsement of fat stereotypes on body dissatisfaction.
Although various causes and correlates of body dissatisfaction have been
investigated, the literature on the relationship between body dissatisfaction and endorsed fat stereotypes is fairly recent and limited. Further, the studies that have focused on this relationship have tended to utilize overweight and obese samples. This research has indicated that overweight and obese individuals who endorse fat stereotypes display greater body dissatisfaction than do overweight and obese individuals who do not endorse fat stereotypes. For example, Friedman et al. (2005) found that overweight and obese individuals who explicitly endorsed fat stereotypes associated with weight controllability displayed greater levels of body image distress than did those who did not endorse these stereotypes. Similarly, Durso and Latner (2009) found that greater explicit endorsement of fat stereotypes was related to greater body shape concerns in an overweight and obese sample. Further, Carels et al. (2010) found that implicit endorsement of fat stereotypes was positively related to body image disturbance in an overweight and obese sample. These findings suggest that endorsing fat stereotypes, whether explicitly or implicitly, is detrimental to overweight and obese individuals’ body satisfaction. In contrast, not endorsing these stereotypes seems to protect against body dissatisfaction.
research examining the relationship between the two constructs in this population. Further, the few studies that have examined this relationship have focused on the specific fat stereotypes of willpower and controllability (i.e., fat is a matter of willpower and self-control), rather than fat stereotypes in general (e.g., willpower, laziness, unfriendliness, etc.). One study by Laliberte, Newton, McCabe, and Mills (2007) found that endorsing the stereotype that weight is completely controllable was related to higher body
dissatisfaction in a predominantly normal weight sample. Participants with lower endorsement of the stereotype tended to display lower body dissatisfaction. Laliberte et al. (2007) explained these findings by suggesting that individuals who strongly believed that weight is completely controllable likely feel dissatisfied with their body because they feel responsible for maintaining, and potentially failing to maintain, their ideal weight. This provides preliminary evidence that endorsing fat stereotypes could be related to body dissatisfaction in normal weight individuals.
O’Brien, Hunter, and Banks (2006), who found that predominantly normal weight physical education students with higher levels of implicit endorsement of general fat stereotypes, as well as higher implicit endorsement of the laziness stereotype, reported significantly more negative feelings toward their own body. These same students also reported greater explicit endorsement of the willpower stereotype. One limitation of these studies is that the researchers tended to compare an explicit measure of the willpower stereotype with an implicit measure of multiple fat stereotypes. This discrepancy in the breadth of the examined stereotypes suggests differences in the meaning of the results obtained from the two methods and makes them difficult to
compare. Thus, there is a need to examine the relationship between explicit endorsement of multiple fat stereotypes and body dissatisfaction in the normal weight population. Further, there is a need to clarify the relationship between implicit endorsement of multiple fat stereotypes and body dissatisfaction in the same population.
Taken together, these few studies suggest that further investigation of the relationship between general endorsement of fat stereotypes and body dissatisfaction is warranted, particularly in normal weight individuals. Thus, the current study attempted to build on this past research to fill the gap in the literature regarding the influence of endorsed fat stereotypes on body dissatisfaction in the normal weight population. Avoiding Fat versus Approaching Thin
promoted views that fat is bad and thin is good (Levitt, 2003). Because these constructs are theorized to be distinct, Levitt (2003) suggested that individuals likely differ in the extent to which their body concerns are motivated by the fat stigma versus the thin ideal. Accordingly, researchers have examined the differences in the influence of fear of fat and drive for thinness on body image disturbance.
Under the assumption that fear of fat and drive for thinness are related but distinct constructs, researchers have investigated which of the two is related more strongly to body image disturbance. The results seem to indicate that avoidance of fat might be more important in contributing to body image disturbance than is approaching thinness. For example, Dalley and Buunk (2009) found that greater desire to avoid the fat identity was associated with more frequent weight-loss dieting. However, greater desire to obtain (i.e. approach) the thin identity was unrelated to weight-loss dieting. These results were observed even after accounting for BMI. The authors concluded that a fear of fat, rather than a drive for thinness, motivated weight-loss dieting.
In contrast to this study, Woud, Anxchutz, Van Strein, and Becker (2011) used an implicit reaction-time measure rather than an explicit measure of approach and
avoidance. The researchers employed a modified version of the Stimulus Response Compatibility (SRC) task, which implicitly assesses the affective valence of stimuli. Participants were shown an image of either a chubby model or a thin model, as well as an image of a mannequin figure, on a computer screen. Participants then were instructed simply to move the mannequin image either toward or away from the picture of the model using different computer keys. The participants’ reaction time after being
as approach versus avoidance, respectively. These researchers found that approach toward the thin model was faster than avoidance of the thin model, whereas reaction times for approach and avoidance of the chubby model did not differ. However, faster avoidance of the chubby model was related to greater body dissatisfaction, while reaction times for approaching the thin model were unrelated to body dissatisfaction. Although this study was the first to use the SRC task in a body image context, the results suggests that when using an implicit measure, the desire to avoid fat might be related to body dissatisfaction more importantly than is the desire to approach thinness.
Although the terms “drive for thinness” and “fear of fat” often are used interchangeably (Levitt, 2003), the aforementioned findings indicate that the two are distinct constructs that have independent influences on body image.
Fat Stereotypes versus “Fear of Fat”
example, differential scales with anchors of lazy/hardworking, irresponsible/responsible, and insecure/self-confident were presented. Using this measure, individuals who tended to endorse higher levels of the negative characteristics as prototypical of fat females were labeled as being higher in fear of fat. In essence, these authors measured fear of fat with an explicit measure of endorsed fat stereotypes. Thus, although the reported conclusion was that greater fear of fat is associated with greater body image disturbance, the finding actually refers to the relationship between endorsement of fat stereotypes and body image disturbance in a predominantly normal weight sample. This provides further indication that endorsement of fat stereotypes potentially contributes to body dissatisfaction in normal weight individuals.
Objectification Theory
Another construct of interest in the current study is derived from the feminist theory of female objectification. Feminist theorists have argued that the female body is objectified by outside observers (Berger, 1972; Spitzack, 1990). In other words, the female body is construed as an object to be looked at and observed by others. Originally, this theory pertained to the tendency of males, as outside observers, to objectify the female body (Spitzack, 1990). However, from this feminist perspective, Fredrickson and Roberts (1997) proposed a theory of female self-objectification, termed the
Objectification Theory (OBJ). This theory posits that due to the culturally-promoted objectified construal of the female body, girls and women are socialized to view
has extended into many subgroups including sexual minority men, lesbian women, and African American women (see Moradi, 2010 for a review).
Three constructs are believed to be importantly related to the extent to which females self-objectify (McKinley & Hyde, 1996). The first component is the
internalization of cultural body standards. The second component is the belief that ensuring that one’s body matches these internalized standards is a matter of personal control and responsibility. The final component involves constantly monitoring and looking at one’s own body to ensure compliance with the internalized cultural standards. While all three components have been investigated in the context of body dissatisfaction, the current study focused on the latter construct, termed body surveillance.
Body Surveillance
Body surveillance is commonly defined as the tendency to view one’s body from the perspective of an outside observer (McKinley & Hyde, 1996). From this definition, individuals with high body surveillance have a tendency to look at and monitor their body frequently, and to be greatly concerned about how their body looks rather than how it feels (McKinley, 1998).
still had a stronger tendency to monitor their body compared to males approximately 10 years later. This gender difference in body surveillance similarly was observed by Frederick et al. (2007) and Lowery et al. (2005). Notably, Frederick et al. (2007) found that 43% of women in their sample reported high body surveillance compared to 25% of men. In contrast, 13% of women reported low body surveillance compared to 27% of men. These findings support the notion that women monitor and look at their own body to a greater extent than do men.
In accordance with the decrease in body surveillance with age observed by McKinley (2006), Tiggemann and Lynch (2001) found a negative relationship between age and body surveillance in a cross-sectional sample of women ranging in age from 20 to 84 years. Despite this relationship, however, moderate to high levels of body
surveillance were identified in women up to age 59. Thus, although increasing age appears to be associated with decreases in body surveillance, the absolute levels of surveillance remain at least moderate until about age 60.
normal weight females whose bodies are likely closer to those ideals. This emphasizes the extent to which habitually monitoring one’s body has pervaded females of all sizes in modern society.
Body dissatisfaction and body surveillance. Given the extent of body
surveillance in various female populations, the clinical impact of this construct on body image has been investigated. The tendency toward body surveillance is theorized to lead to body image disturbances because it promotes an awareness of the discrepancy between one’s own body and the cultural standard of an attractive body (McKinley & Hyde, 1996). Several investigations have supported this hypothesis. McKinley (1998)
demonstrated that women with higher levels of body surveillance reported greater body shame and lower body esteem. Similarly, Brannan and Petrie (2008) and Mercurio and Rima (2011) observed strong positive relationships between body surveillance and body dissatisfaction in female samples. In addition, Fitzsimmons and Bardone-Cone (2011) demonstrated this relationship across races, finding strong correlations between body surveillance and body dissatisfaction in both Caucasian and African-American females. Further, Greenleaf and McGreer (2006) found a significant positive relationship between body surveillance and body shame in both physically active and sedentary women, indicating that the extent to which women exercise does not influence the relationship. Thus, body surveillance is supported as an important factor related to body
The aforementioned study conducted by Frederick et al. (2007) also examined the relationship between body surveillance and body dissatisfaction across all weight
categories. The authors found a significant relationship across normal weight,
overweight, and obese women, such that higher surveillance was associated with higher body dissatisfaction. Although the relationships were stronger in the overweight and obese categories, this finding indicates that normal weight women who habitually monitor their body also experience body dissatisfaction.
Cumulatively, these studies suggest that high body surveillance could be an important predictor of body dissatisfaction in many women, regardless of race, physical activity, and weight. Again, it is important to note that this implied causal direction between body surveillance and body dissatisfaction is tentative, given the correlational nature of these studies. It also is possible that body dissatisfaction promotes body surveillance.
concluded that body surveillance is an important factor that contributes to how the desire to obtain the thin ideal leads to body dissatisfaction.
Although the link between thin ideals and body surveillance has been
demonstrated, Forbes, Jobe, and Revak (2006) observed that body surveillance uniquely contributed to body dissatisfaction after accounting for the effects of internalized thin ideals. This finding indicates that a tendency to monitor one’s body is an important factor related to body dissatisfaction in women, above and beyond the extent to which they internalize cultural ideals of thinness. Because body surveillance is theorized to develop through a desire to comply with cultural body standards (Fredrickson & Roberts, 1997; McKinley & Hyde, 1996), this finding also suggests that cultural standards of the female body other than thinness might also be importantly related to body surveillance and body dissatisfaction. As mentioned earlier, the culturally-derived motivations of approaching the thin ideal and avoiding the fat stigma are distinct constructs. Given the prevalence of fat stigma, it is possible that body surveillance is related to body
dissatisfaction because of a desire to avoid culturally endorsed fat stereotypes, and not only because of a desire to achieve cultural ideals of thinness. Thus, potential
relationships between endorsed fat stereotypes, body surveillance, and body dissatisfaction were examined in the present study.
The Present Study
The general purpose of the present study was to extend the limited research on the relationship between endorsement of fat stereotypes and body dissatisfaction. In
exploratory. However, by extending the findings of the relationship between endorsed fat stereotypes and body dissatisfaction in overweight and obese people, and given the subjective nature of appraising one’s own weight, it was expected that normal weight individuals who endorsed fat stereotypes would show greater body dissatisfaction than would those who do not hold these stereotypes.
Based on the findings in the literature presented above, both endorsement of fat stereotypes and body surveillance appear to be positively related to body dissatisfaction. Accordingly, a second purpose of this study was to investigate the potential interactive influence of endorsement of fat stereotypes and body surveillance on body dissatisfaction in a normal weight sample. It was expected that normal weight women who
demonstrated higher body surveillance as well as higher endorsement of fat stereotypes would show greater body dissatisfaction than would women who showed higher levels on only one of the two constructs, or lower levels on both. This investigation of fat
stereotypes contributes uniquely to the literature that has focused solely on the influence of thin ideals on body surveillance and body dissatisfaction.
The present study sought to examine the constructs of interest in a normal weight sample. As such, BMI was used as an indicator of normal weight. Body mass index is calculated by dividing weight in kilograms by height in metres squared (World Health Organization, 2012). Based on the classification specified by the World Health
surveillance than do males (e.g., Frederick et al., 2007; McKinley, 1998). Also, higher
levels of body dissatisfaction have been documented in females compared to males (e.g.,
Aruguete, Yates, & Edman, 2006; Demarest & Allen, 2000; Pingitore, Spring, &
Garfield, 1997). Furthermore, the observed relationship between body surveillance and
various measures of body dissatisfaction tend to be stronger and more consistent for
females than they are for males (e.g., Frederick, et al., 2007; McKinley, 1998; McKinley,
2006), indicating that the nature of this relationship is different between genders. Thus,
to maintain interpretability of the findings, the present study examined the relationships
between the constructs of interest in a normal weight, female sample.
Given the presented differences in endorsement of fat stereotypes based on the
types of measures outlined above, both an explicit and an implicit measurement strategy
were used in the current study. Because of the inconsistent findings of explicit
endorsement of fat stereotypes in the literature, the following hypotheses regarding
explicit endorsement were exploratory and tentative. In contrast, the following
hypotheses regarding implicit endorsement of fat stereotypes were made clear by the
consistent findings of implicit endorsement in the literature. Based on past research
comparing implicit and explicit measures of fat stereotypes (e.g., O’Brien et al., 2007),
analyses for the two measures were conducted separately.
Several potential covariates were assessed in the current study. Specifically, BMI
(Frederick et al., 2007), global self-esteem (Lowery et al., 2005), and depressive
symptoms (Widerman & Pryor, 2000) were assessed as potential covariates because they
consistently have been associated with body dissatisfaction in women. Further, social
relationship both with body dissatisfaction (Brannan & Petrie, 2008) and explicitly
expressed weight bias (Perez-Lopez, Lewis, & Cash, 2001). Additionally, age was
assessed as a potential covariate. Although some cross-sectional studies have
demonstrated that that body dissatisfaction remains stable with age (e.g., Tiggemann &
Lynch, 2001), other cross-sectional (e.g., Green & Pritchard, 2003) and retrospective
(McLaren & Kuh, 2004) studies have shown age-related changes in body dissatisfaction.
All of these variables have been assessed in the body image and weight bias literatures as
potential covariates. Finally, the effect of internalized thin ideals was assessed to
examine the hypothesized effects above and beyond the influence of thin ideals.
Hypotheses:
1. Normal weight women will display a positive relationship between the explicit
endorsement of fat stereotypes and body dissatisfaction.
2. Normal weight women also will display a positive relationship between the
implicit endorsement of fat stereotypes and body dissatisfaction.
3. Normal weight women will display a positive relationship between body
surveillance and body dissatisfaction.
4. Body surveillance will moderate the relationship between explicit endorsement of
fat stereotypes and body dissatisfaction. The relationship between explicit
endorsement of fat stereotypes and body dissatisfaction will be significantly
stronger at higher levels of body surveillance than at lower levels of body
surveillance.
5. Similarly, body surveillance will moderate the relationship between implicit
implicit endorsement of fat stereotypes and body dissatisfaction will be
significantly stronger at higher levels of body surveillance than at lower levels of
body surveillance.
Chapter 2: Method Participants
Participants were recruited from the Psychology Participant Pool at the University
of Windsor and received 1.0% course credit for their involvement in the study. Because
screening based on BMI was not possible through the Participant Pool, the study was
made available to all women registered in the pool. Self-reports of weight and height
were requested in the demographics questionnaire, and BMI was calculated using this
information. The analyses were conducted only on those participants with a self-reported
BMI between 18.5 to 25 kg/m2. No additional inclusion or exclusion criteria were
applied.
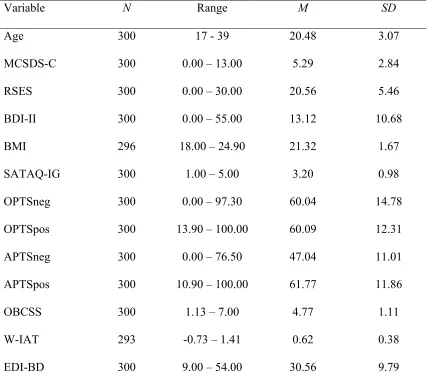
Data were collected from 301 normal weight female participants. The mean age
of participants was 20.54 years (SD = 3.87) and their mean self-reported BMI was 21.31
kg/m2 (SD = 1.67). Self-reported race and ethnicity were as follows: 74.8% Caucasian,
6.6% European, 5.0 % African Canadian, 5.0% East Asian, 5.0% Middle Eastern, 3.6%
South Asian, 0.3% Hispanic, 0.3% Native Canadian, and 1% reported two or more ethnic
backgrounds. The distribution of participants’ sexual orientation was as follows: 95.0%
heterosexual, 4.0% bisexual, 0.7% lesbian, and 0.3% pansexual. Further, 96.0% reported
no lifetime diagnosis of an eating disorder, 3.7% reported having been diagnosed
previously, and 0.3% did not report if they had ever been diagnosed with an eating
In terms of relationship status, 49.5% were single, 47.2 were in a relationship
and/or cohabiting, 2.3% were married or in a common-law relationship, and 1.0% were
divorced or separated. Additionally, 96.6% had no children, 1.3% had one child, 1.3%
had 2 children, 0.7% had three children, and 1% did not report number of children.
In terms of years of university education, 22.6% were in their first year, 24.3%
were in their second year, 26.6% were in their third year, 18.6% were in their fourth year,
and 8% had attended university for more than four years. Additionally, 60.1% of
participants were psychology majors. In terms of current employment status, 64.1% were
employed part-time, 32.2% were unemployed, and 3.7% were employed full-time.
Measures
Main predictor variables.
Obese persons trait survey (OPTS; Puhl, Schwartz, & Brownell, 2005). The OPTS (see Appendix A) consists of 20 items and assesses explicit endorsement of traits
associated with obese persons. The OPTS consists of two subscales. The first subscale
lists 10 negative traits (e.g., lazy, gluttonous; OPTSneg) and the second lists 10 positive
traits (e.g., honest, generous; OPTSpos). Participants are asked to estimate the
percentage (0-100%) of obese persons who possess each of these traits. Percentage
estimates are averaged across the negative traits to obtain a score of explicit fat
stereotyping. Percentage estimates also are averaged across positive traits to obtain a
score of positive stereotyping. To maintain psychometric properties of the scale, both the
OPTSneg and OPTSpos were administered in this study. However, only the OPTSneg
was used in the main analyses. Higher average estimates of negative traits indicate
by Carels et al. (2010), participants also were asked to estimate the percentage of average weight persons who possess the same 20 traits (APTSneg and APTSpos). Using the analysis described by Carels et al. (2010), mean percentage estimates of negative traits for average weight persons were subtracted from mean estimates for obese persons. This difference was used as an indicator of the extent to which participants explicitly endorsed fat stereotypes. The OPTS has shown appropriate validity. Puhl et al. (2005) reported that the OPTS did not correlate significantly with the Marlowe Crowne Social
Desirability Scale, demonstrating discriminant validity. Domoff et al. (2012) reported that the OPTS correlated significantly with the Anti-Fat Attitudes Scale – Dislike Subscale (r = .31), a measure of general dislike of obese persons, demonstrating convergent validity. Additionally, the OPTS has demonstrated acceptable to good internal consistency, with Cronbach’s alpha ranging from .73 to .88 for the OPTSneg, and from .78 to .86 for the OPTSpos (Carels et al., 2009; Carels et al., 2010; Gumble & Carels, 2012; Puhl et al., 2005). The APTSneg and APTSpos also have demonstrated good to excellent internal consistency, α = .90 and α = .86, respectively (Carels et al., 2010). In the current study, the OPTSneg and OPTSpos both had good internal
consistency, α = .88 and α = .88, respectively. Additionally, the APTSneg and APTSpos had good to excellent internal consistency, α = .85 and α = .92, respectively.
stimuli, depending on the stereotyped group being studied. The stimuli used in the W-IAT (see Appendix B) involve 20 negatively or positively valenced words, and 20 images of obese and thin silhouettes. The negatively valenced words include five general words (i.e., terrible, horrible, awful, hurt, evil) and five common fat stereotypes (i.e., lazy, stupid, undisciplined, insecure, and hostile). The positively valenced words include five general words (i.e., joy, love, peace, wonderful, laughter) and five words opposite to the fat stereotypes (i.e., motivated, intelligent, disciplined, confident, and friendly).
Participants are required to categorize the words into “bad” versus “good”, and the images into “fat” versus “thin”. Two categories are presented on the top left side of the screen, while the other two categories are presented on the top right side of the screen. The category pairings are counterbalanced across two versions of the W-IAT such that “fat” and “bad” are paired together first in one version, while “fat” and “good” are paired together first in the second version (Greenwald, Nosek, & Banaji, 2003; Nosek,
are paired together on the right side for the first testing block. During the second block of version two, “good” and “thin” are paired on the left side, while “bad” and “fat” are paired on the right side. The stimuli are presented in random order, but an equal number of words and images are presented per block. The mean response time to categorize each stimulus correctly is calculated for each block. Then, using the improved standard scoring algorithm of the IAT (Greenwald et al., 2003), mean response times for the thin/good-fat/bad block are subtracted from the mean response times of the thin/bad-fat/good block to obtain a difference score (D). Based on the theory of the IAT, it is expected that participants will categorize the stimuli more quickly and accurately when the categories are paired in a way that matches their implicit stereotyped beliefs
(Greenwald et al., 1998). Faster response times for the fat/bad-thin/good block compared to the fat/good-thin/bad block indicate greater implicit endorsement of negative fat stereotypes. Thus, larger positive D scores on the W-IAT indicate that fat people are implicitly associated more strongly with negative attributes than with positive attributes, and more strongly with negative attributes than are thin people. In contrast, negative D scores indicate that fat people are implicitly associated more strongly with positive
attributes than with negative attributes, and more strongly with positive attributes than are thin people.
W- IATs, indicated that the mean reliability of the IAT was adequate (r = .79). In the current study, the W-IAT had adequate reliability across practice and testing blocks (r = .79 for thin/good-fat/bad trials, and r = .76 for thin/bad-fat/good trials).
Moderator variable. Objectified body consciousness scale – surveillance
subscale (OBCSS; McKinley & Hyde, 1996).
Criterion variable.
Eating disorder inventory-2 - Body dissatisfaction subscale (EDI-BD; Garner,
1991). The Eating Disorder Inventory -2 (EDI-2; see Appendix D) is a 91-item
self-report scale that assesses behaviours, symptoms, and psychological traits associated with
eating disorders. The EDI-2 consists of 11 subscales, one of which assesses body
dissatisfaction (EDI-BD). To maintain psychometric properties of the EDI-BD subscale,
the entire EDI-2 was administered to participants in the current study. However, only the
EDI-BD was used in the analyses. The EDI-BD consists of 9 items assessing women’s
dissatisfaction with their body, such as “I think my stomach is too big”. Respondents are
asked to rate the items on a 6-point scale ranging from 1 (never true) to 6 (always true). Higher scores indicate greater body dissatisfaction. The EDI-BD has demonstrated
convergent validity with another measure of body dissatisfaction, the Body Shape
Questionnaire (r = .82; Garner, 1991). It also has demonstrated excellent internal
consistency (α = .91; Brookings & Wilson, 1994; Tylka, 2004) and 3-week test-retest reliability (r = .97; Wear & Pratz, 1987) in non-clinical samples. In the current study, the EDI-BD had good internal consistency, α = .89.
Covariates
Sociocultural attitudes toward appearance scale-3 – internalization general
subscale (SATAQ-IG; Thompson, van den Berg, Roehrig, Guarda, & Heinberg, 2003).
The Sociocultural Attitudes Toward Appearance Scale-3 (SATAQ-3; see Appendix E) is
a 30-item self-report measure of societal influences on body image. The SATAQ-3
consists of four subscales, one of which is the SATAQ-IG. To maintain psychometric
However, only the SATAQ-IG was used in the analyses. The SATAQ-IG consists of 9
items that assess internalization of thin ideals, such as “I compare my body to the bodies of people who are on TV”. Respondents rate each item on a 5-point scale ranging from 1
(definitely disagree) to 5 (definitely agree). Higher scores indicate greater internalization of thin ideals. The SATAQ-IG has demonstrated good convergent validity with the Drive for Thinness subscale of the Eating Disorder Inventory (r = .57), and excellent internal
consistency (α = .92; Thompson et al., 2003). In the current study, the SATAQ-IG had excellent internal consistency, α= .94. The internalization of thin ideals is found to relate
consistently to body image disturbance, and often is studied in relation to body
dissatisfaction (Thompson & Stice, 2001). Thus, the SATAQ-IG was examined in the analysis to ensure that any observed relationships between endorsed fat stereotypes, body
surveillance, and body dissatisfaction occurred after accounting for internalized thin ideals.
Rosenberg self-esteem scale (RSES; Rosenberg, 1965; 1979). The RSES (see
Appendix F) is a 10-item self-report measure of global trait self-esteem. Respondents rate items such as “I feel that I have a number of good qualities” on a 4-point scale
ranging from 0 (strongly disagree) to 3 (strongly agree). Higher scores indicate greater self-esteem. The RSES has demonstrated good convergent validity with other measures
of self-esteem, including the Coopersmith Self-Esteem Inventory (r = .55; Demo, 1985). The RSES also has demonstrated excellent internal consistency (α= .92; Rosenberg, 1979) and good test-retest reliabilities ranging from r = .85 at a two week interval (Silber
was tested as a covariate in all analyses because it has been found to correlate with body
dissatisfaction in women (e.g., Lowery et al., 2005).
Marlowe Crowne social desirability scale – Form C (MCSDS-C; Reynolds,
1982). The MCSDS-C (see Appendix G) is a 13-item self-report measure of the tendency
to respond to test items in a socially desirable manner. Respondents are asked to indicate
whether items such as “It is sometimes hard for me to go on with my work if I am not
encouraged” are true or false for them personally. Higher scores indicate greater socially
desirable responding. The MCSDS-C has demonstrated good convergent validity with
other measures of social desirability, including the Edwards Social Desirability Scale (r =
.41; Reynolds, 1982). The MCSDS-C also has demonstrated adequate internal
consistency (rKR-20 = .76; Reynolds, 1982). In the current study, the MCSDS-C had
adequate internal consistency, rKR-20 = .70. Because of the documented relationship
between socially desirable responding and body dissatisfaction (Brannan & Petrie, 2008),
and because this study asked participants to indicate their opinions regarding stereotypes
of a socially discriminated group, tendencies toward socially desirable responding were
accounted for in the analysis.
Beck depression inventory-II (BDI-II; Beck, Steer, Ball, & Ranieri, 1996).The
BDI-II (see Appendix H) is a 21-item self-report measure of depressive symptomatology
Respondents are asked to rate items such as “Sadness” on a 4-point scale ranging from 0
(absence of symptom; e.g., “I do not feel sad”) to 3 (severe presence of symptom; e.g., “I
am so sad or unhappy that I can’t stand it”). Higher scores indicate greater severity of
depressive symptoms. Osman et al. (1997) demonstrated adequate construct validity
self-esteem (r = -.64). The BDI-II also has demonstrated excellent internal consistency in
past research (α = .92; Beck et al., 1996). In the current study, the BDI-II had excellent
internal consistency, α= .93. Depressive symptomatology was tested as a covariate in all
analyses because it has been found to correlate with body dissatisfaction in women (e.g.,
Widerman & Pryor, 2000).
Demographic questionnaire. This questionnaire (see Appendix I) was used to
obtain demographic information from the participants, such as age and years of university
education. Body Mass Index was calculated based on self-reported weight and height
provided on this questionnaire.
Procedure
After signing up for the study on the Psychology Participant Pool (see Appendix J
for Participant Pool advertisement), participants were provided with an Internet link to
the FluidSurvey study webpage via e-mail. Informed consent for participation was
requested online prior to the administration of the measures (see Appendix K). The study
was conducted entirely online, and lasted thirty minutes to one hour. Participants were
encouraged to complete the study in a quiet area and free from distractions. Consenting
participants were directed to electronic versions of the questionnaires presented on
FluidSurvey. To counterbalance the order of the explicit and implicit measures of fat
stereotypes, as recommended by Nosek, Greenwald, and Banaji (2005), two versions of
the complete study were developed. Participants were randomly assigned to one of the
versions when they signed up for the study. The order of the measures for version one of
the study was as follows: MCSDS-C, OPTS, RSES, OBCSS, SATAQ-3, APTS, BDI-II,
was as follows: MCSDS-C, W-IAT, RSES, OBCSS, SATAQ-3, OPTS, BDI-II, EDI-2,
APTS, and Demographics. Within each version, a link to a webpage presenting the W-IAT was provided. When participants clicked the link, they were randomly assigned to
one of the two versions of the W-IAT. Upon clicking the link, a new web-browser would open with the W-IAT, which was hosted on a University of Windsor web server outside of FluidSurvey. After participants completed the W-IAT, they were directed back to the
FluidSurvey to complete the remainder of the study. Upon completion of the measures, participants were directed to a debriefing page (Appendix L), which explained the
objectives of the study and thanked them for their time and contribution. Finally, participants were given 1.0 bonus mark, which they put toward an eligible psychology course of their choice.
Chapter 3: Results
Approach to Data Analysis
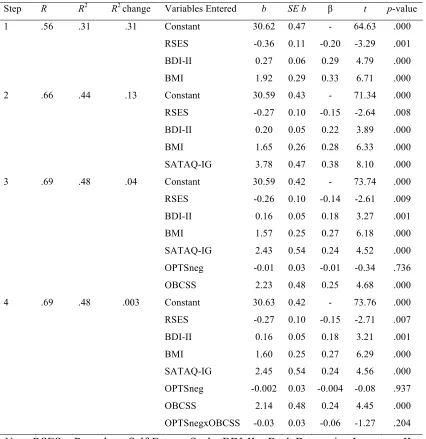
This study used hierarchical multiple regression to test for a potential moderating effect of body surveillance on the relationship between endorsement of fat stereotypes and body dissatisfaction. Two regressions were conducted, one using explicit scores of
endorsement of fat stereotypes and the other using implicit scores. The covariates of self-esteem, depressive symptomatology, social desirability, BMI and age were tested as
predictor variables in the first block of the regressions to account for their potential influence on body dissatisfaction. Additionally, internalization of thin ideals was included in the second block of the regressions to ensure that any observed effects of
implicit fat stereotypes) and the moderator variable (body surveillance) were entered in
the third block of the regressions, followed by the interaction term in the fourth block.
The hypotheses were tested using the analytic procedures described by Cohen, Cohen,
West, and Aiken (2003). Hypotheses 1, 2, and 3 were tested by examining the
significance of the first-order terms in the regression equations. Hypotheses 4 and 5 were
tested by examining the significance of the interaction term in the regression equations,
followed with simple slopes analyses.
All analyses were performed using SPSS for Windows (Version 19.0) and SPSS
for Mac (Version 21.0). Potential differences in scores across study versions were
examined before merging the data. Next, missing values and reliability analyses were
conducted. Assumptions of multiple regression were assessed, followed by descriptive
analyses. Finally, all of the hypotheses were tested using a series of moderated
hierarchical multiple regressions.
Combining Study Versions
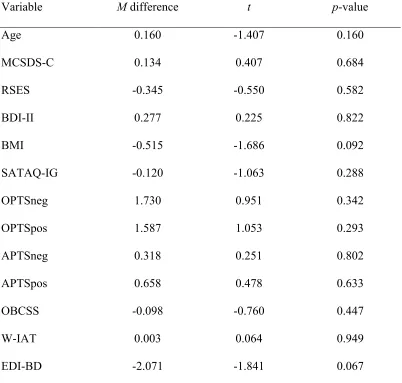
A series of independent sample t-tests found no significant differences across the
two study versions for any of the measures (all ps > .067; see Table 1). Because the
mean difference between versions for body dissatisfaction was approaching significance,
the analyses were conducted separately for each version to check if any differences
emerged. The results were not different across the two versions. Further, bivariate
correlations between all possible variable pairings were in the same direction for both
versions. Finally, a two-way analysis of variance was conducted to assess whether the
interaction was found (p = .770). Thus, data from both study versions were merged and
Table 1
Mean Differences across Study Versions for All Variables (N = 301)
Variable M difference t p-value
Age 0.160 -1.407 0.160
MCSDS-C 0.134 0.407 0.684
RSES -0.345 -0.550 0.582
BDI-II 0.277 0.225 0.822
BMI -0.515 -1.686 0.092
SATAQ-IG -0.120 -1.063 0.288
OPTSneg 1.730 0.951 0.342
OPTSpos 1.587 1.053 0.293
APTSneg 0.318 0.251 0.802
APTSpos 0.658 0.478 0.633
OBCSS -0.098 -0.760 0.447
W-IAT 0.003 0.064 0.949
EDI-BD -2.071 -1.841 0.067
Note: MCSDS-C = Marlowe Crowne Social Desirability Scale Form C; RSES = Rosenberg Self-Esteem Scale; BDI-II = Beck Depression Inventory-II; BMI = Body Mass Index; SATAQ-IG = Sociocultural Attitudes Towards Appearance Scale-3
Missing Data
A missing values analysis was conducted to assess for patterns of missingness.
Seventy-seven percent (n = 231) of participants provided complete data. The percentage
of missing values for all measure items ranged from 0 to 2.3%. Finally, less than 2% (n =
77) of all possible values were missing. Little’s MCAR test was not significant, χ2
(5868) = 5905.00, p = .364, indicating that the data were missing completely at random.
This supported the use of imputation as an appropriate method of managing the missing
data (Schafer & Graham, 2002). Multiple imputation was used to replace missing values
because it preserves variability in the data set, reducing bias in estimates and the
likelihood of Type I and Type II errors (Schafer & Graham, 2002). Parameter estimates
were pooled across five imputed data sets.
Assumptions of Multiple Regression
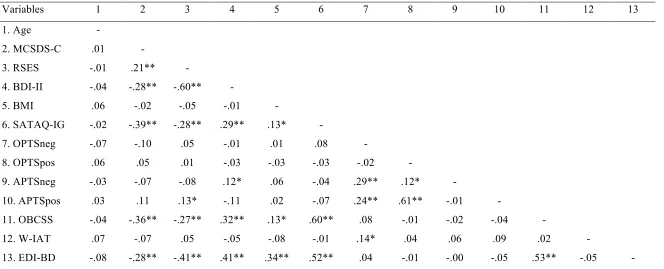
The assumption of the absence of multicollinearity was assessed by examining
correlations between variables, and checking variance inflation factors (VIF). This
assumption was satisfied as none of the variables had correlations above |.60| (see Table 2
for all zero-order correlations), and none of the VIF values approached the cut-off of 10
(Cohen et al., 2003). To assess the assumption of independence of errors, the
Durbin-Watson statistic was examined. The Durbin-Durbin-Watson value for the first regression was
2.00, and for the second regression was 2.01, which were close to the acceptable value of
Table 2
Zero-Order Correlations Between All Variables (N = 300).
Variables 1 2 3 4 5 6 7 8 9 10 11 12 13
1. Age -
! ! ! ! ! ! !
! !
! ! !
2. MCSDS-C .01 -
3. RSES -.01 .21** -
4. BDI-II -.04 -.28** -.60** -
5. BMI .06 -.02 -.05 -.01 -
6. SATAQ-IG -.02 -.39** -.28** .29** .13* -
7. OPTSneg -.07 -.10 .05 -.01 .01 .08 -
8. OPTSpos .06 .05 .01 -.03 -.03 -.03 -.02 -
9. APTSneg -.03 -.07 -.08 .12* .06 -.04 .29** .12* -
10. APTSpos .03 .11 .13* -.11 .02 -.07 .24** .61** -.01 -
11. OBCSS -.04 -.36** -.27** .32** .13* .60** .08 -.01 -.02 -.04 -
12. W-IAT .07 -.07 .05 -.05 -.08 -.01 .14* .04 .06 .09 .02 -
13. EDI-BD -.08 -.28** -.41** .41** .34** .52** .04 -.01 -.00 -.05 .53** -.05 - Note: * p < .05, ** p < .01; MCSDS-C = Marlowe Crowne Social Desirability Scale Form C; RSES = Rosenberg Self-Esteem Scale; BDI-II = Beck Depression Inventory-II; BMI = Body Mass Index; SATAQ-IG = Sociocultural Attitudes Towards Appearance Scale-3 Internalization General subscale; OPTSneg = Obese Persons Trait Survey negative traits; OPTSpos = Obese Persons Trait Survey positive traits; APTSneg = Average-Weight Persons Trait Survey negative traits; APTSpos = Average-Weight Persons Trait Survey positive traits; OBCSS = Objectified Body Consciousness Scale Surveillance subscale; W-IAT = Weight Implicit Associations Test; EDI-BD = Eating Disorders Inventory 2 Body Dissatisfaction subscale