ABSTRACT
GUO, SIMING. Evaluation of 2D CAD Technology for Mass Customization. (Under the direction of Dr. Cynthia L. Istook).
Two-dimensional computer-aided design (CAD) and 3D body scanning have provided more approaches for designers/pattern makers to develop products. Three-dimensional body scanning has been implemented in the product development process to help more accurately and conveniently measure body sizes and shapes. These technological improvements have played an important role in the apparel industry. Companies are increasingly using 2D pattern making software and 3D body scanning for mass customization or mass production.
In this study, two different 2D pattern making software packages were used to develop custom garments to fit four fit models’ body shapes. Fit models’ measurements extracted from a 3D body scanner were input to both software for the product development. Multiple prototypes were created to improve the fit. Faculty, potential consumers, and fit models evaluated the fit of eight final garments and selected the dress that they preferred. The findings of this research would be valuable for apparel companies to take advantage of these technologies, stimulate their apparel product development, and build their competitive advantages.
Evaluation of 2D CAD Technology for Mass Customization
by Siming Guo
A dissertation submitted to the Graduate Faculty of North Carolina State University
in partial fulfillment of the requirements for the degree of
Doctor of Philosophy
Textile Technology and Management
Raleigh, North Carolina 2018
APPROVED BY:
_______________________________ _______________________________ Dr. Cynthia L. Istook Dr. Yingjiao Xu
Committee Chair
ii
DEDICATION
This dissertation is dedicated to my husband Kaijun Zhou,
iii
BIOGRAPHY
Siming Guo was born in China. She obtained a Bachelor of Arts degree in Design
(Fashion Design) at Tsinghua University, Beijing in China. Siming received a Master of Textiles degree from North Carolina State University. She entered the Ph.D. program in Textile
iv
ACKNOWLEDGMENTS
There are many people who have helped me over the years in Raleigh, North Carolina. I want to thank them as follows:
Dr. Cynthia Istook, advisor and committee chair, for your support and being a
distinguished professor. This research was completed because of your guidance and advisement. I cannot imagine this process without you. Thank you for providing this opportunity for me to work on CAD technology.
Dr. Yingjiao Xu, committee member, for your encouragement and kindness, which
helped me enter this Ph.D. program. The knowledge that I learned from your classes was beneficial to my research. Also, thanks for your suggestions for my dissertation data analysis.
Dr. Traci Lamar, committee member. Your comments were very valuable for my
dissertation. You were always kind and patient for all my questions. I enjoyed the design process in your Textile Digital Design class.
Dr. Andre West, committee member. Your participation and advice were very useful
for my research. I appreciate your contribution to my dissertation.
Dr. Ronalds Gonzalez, Graduate School Representative, for attending my preliminary
and final exams.
Ms. Anastasia Vouyouka and Ms. Liana von Sperber, for your excellent training and
assistance in the product development of Software B.
Mr. John Fijen at Textile/Clothing Technology Corporation ([TC]2 ), for offering this
opportunity and assistance to work with Software B.
v Erin O’Quinn at Graduate Writing Center, for being a responsible tutor. Especially
thank you for your suggestions of clarity and word choice. You are a friend for me. Jiayin Li and Sibei Xia, for always being my friends. Your friendship means a lot to
me.
My parents and sister, for your belief in me. I also appreciate that you helped take
care of my daughter.
vi
TABLE OF CONTENTS
LIST OF TABLES ... ix
LIST OF FIGURES ... x
CHAPTER I. INTRODUCTION ...1
Rationale ...1
Purpose and Research Questions ...2
Limitations ...3
Definition of Terms...3
CHAPTER II. LITERATURE REVIEWS ...5
History of Sizing ...5
Population Shifts ...7
CAD for Textiles and Apparel ...8
Body Scanning Technology ...10
Types of Scanners ...10
[TC]2 ...11
Size Stream ...12
Cyberware ...12
Vitronic ...12
Kinect ...13
File Formats ...13
Anthropometry and Scanning Issues ...14
Shape Categorization ...17
Shape Categorization Methods ...17
Shape analysis tools ...18
Telestia ...20
Mass Customization ...21
Mass Customization Adoption ...22
Mass Customization Approaches ...23
Previous Research ...25
CHAPTER III. METHODOLOGY ...28
Introduction ...28
Method ...29
Sampling Method ...29
Fit models...29
Evaluators ...29
Apparatus/Instrument ...30
Measuring Methods ...30
Test Product ...32
Protocol ...33
Data Collection ...34
Data Analysis ...34
CHAPTER IV. RESULTS ...36
Description of Sample...36
vii
Creating a Basic Block Using Software A ...36
Developing the MTM System in Software A ...40
Size code table ...40
Grade rule table ...41
Alteration rules...43
Creating the petite pattern and size code table ...49
Alteration process ...51
First prototypes ...51
First prototype issues ...56
Adding the bust length alteration ...57
Second prototypes ...58
The third prototypes and final dresses ...64
Software B Process ...73
Software B MTM Process ...77
First prototypes ...74
Updating the Measurements ...79
Basic Blocks, Third Prototypes, and Final Dresses ...80
Model B (Spoon shape) ...81
Adjusting the bust curve and reshaping the princess line ...84
Model C (Bottom hourglass shape) ...85
Model M (Hourglass shape)...89
Model Z (Rectangle shape) ...92
Data Analyses ...96
Fit Evaluation ...96
Comparison of All Models’ Dress A and Dress B ...97
Comparison of Shapes ...99
Model B (Spoon shape) ...99
Model Z (Rectangle shape) ...101
Model M (Hourglass shape)...103
Model C (Bottom hourglass shape) ...105
Comparison of Each Model’s Dress A and Dress B ...106
Comparison of Evaluator Groups ...108
CHAPTER V. CONCLUSION AND DISCUSSION ...110
Brief Review of Study ...110
Research Question One ...111
Comparison of the MTM process ...111
Managerial Implications of the Two CAD systems ...114
Research Question Two ...114
Body Shape Impact ...114
Other Factors Affected the Fit ...116
Measurements ...116
Fabric ...116
Sizes ...116
Measurement selections ...117
The basic pattern ...117
viii
Issues of the Fit Evaluation ...118
Limitations and Future Research ...119
REFERENCES ...121
APPENDICES ...128
Appendix A ...129
Appendix B ...135
Appendix C ...140
Appendix D ...152
ix
LIST OF TABLES
Table 1: Research Related to CAD and Body Scanning Technologies ...27
Table 2: Data Analyses for Research Questions ...35
Table 3: Size Intervals of the Size Code Table ...41
Table 4: The Petite Size Chart ...50
Table 5: Fit Models’ First Body Scan Measurements and Alteration Amounts ...52
Table 6: The Manual and Body Scan Measurements ...57
Table 7: Alteration Amount Comparison between the First and Second Prototypes ...59
Table 8: Alteration Amount Comparison between the Second and Third Prototypes ...64
Table 9: Body Scan Measurements for the First Prototypes...75
Table 10: Manual and Body Scan Measurements, and Suggested Measurements ...80
Table 11: Measurement Comparison between the Second and Third Prototypes ...81
Table 12: Data Collection of the Fit Evaluation ...97
Table 13: Evaluators’ Evaluation for All Fit Model’s Dress A and Dress B ...99
Table 14: Evaluators’ Evaluation on Model B ...100
Table 15: Evaluators’ Evaluation on Model Z ...102
Table 16: Evaluators’ Evaluation on Model M...104
x
LIST OF FIGURES
Figure 1: Hourglass, Bottom Hourglass, Spoon, and Rectangle shapes ...19
Figure 2: Telestia four shape cases ...21
Figure 3. Software B measuring method ...31
Figure 4. Simple sleeveless shift dress with princess seams ...32
Figure 5. Methodology flowchart ...34
Figure 6: The basic dress block ...37
Figure 7: Model A’s first prototype created using Software A ...37
Figure 8: The shift dress was changed to the princess shift dress ...38
Figure 9: Model A’s second prototype ...38
Figure 10: Model A’s A-line dress ...39
Figure 11: Model A’s straight line dress ...39
Figure 12: The basic size 8 of Model A’s measurements ...40
Figure 13: Grade rule table ...41
Figure 14: Grade numbers ...42
Figure 15: Grade nest of the pattern ...42
Figure 16: Alteration point numbers of the pattern ...43
Figure 17: Alteration rule tables...44
Figure 18: Alteration rules at the bust girth ...45
Figure 19: Alteration rules at the waist girth...46
Figure 20: Alteration rules at the hip girth ...46
Figure 21: Alteration rules at the knee length ...47
Figure 22: Alteration rules at the hip length ...47
Figure 23: Alteration rules at the back waist length...48
Figure 24: Alteration rule table for the high hip ...48
Figure 25: Alteration rules at the high hip girth ...49
Figure 26: Comparison between the regular and the petite patterns ...50
Figure 27: The alteration process in Software A...51
Figure 28: Model B’s first pattern ...52
Figure 29: Model B’s first prototype created using Software A ...53
Figure 30: Model C’s first pattern ...53
Figure 31: Model C’s first prototype created using Software A ...54
Figure 32: Model M’s first pattern ...54
Figure 33: Model M’s first prototype created using Software A ...55
Figure 34: Model Z’s first pattern ...55
Figure 35: Model Z’s first prototype created using Software A ...56
Figure 36: Alteration rule table for the bust length ...58
Figure 37: Alteration rules at the bust length ...58
Figure 38: Comparison between Model B’s first and second patterns ...59
Figure 39: Model B’s second prototype created using Software A ...60
Figure 40: Comparison between Model C’s first and second patterns ...61
Figure 41: Model C’s second prototype created using Software A ...61
Figure 42: Model M’s second prototype created using Software A ...62
Figure 43: Comparison between Model Z’s first and second patterns ...63
xi
Figure 45: The bust curve adjustment of the basic pattern after the second fitting ...64
Figure 46: Comparison between Model M’s second and third patterns ...72
Figure 47: Model M’s third prototype created using Software A ...65
Figure 48: Comparison between the second and the final basic patterns ...66
Figure 49: Model M’s third and final patterns ...67
Figure 50: Model M’s final prototype created using Software A ...67
Figure 51: Comparison between Model B’s second and third patterns ...68
Figure 52: Model B’s third prototype created using Software A ...68
Figure 53: Model B’s final dress created using Software A ...69
Figure 54: Comparison between Model C’s second and third patterns ...70
Figure 55: Model C’s third prototype created using Software A ...70
Figure 56: Model C’s final dress created by using Software A ...71
Figure 57: Comparison between Model Z’s second and third patterns ...72
Figure 58: Model Z’s third prototype created using Software A ...72
Figure 59: Model Z’s final dress created using Software A ...73
Figure 60: The MTM workflow of Software B...74
Figure 61: Four fit models’ croquis...75
Figure 62: The MTM process of Software B ...76
Figure 63: Model B’s first prototype created using Software B ...77
Figure 64: Model C’s first prototype created using Software B ...78
Figure 65: Model M’s first prototype created using Software B ...78
Figure 66: Model Z’s first prototype created using Software B ...79
Figure 67: Model B’s basic block created using Software B ...82
Figure 68: Comparison between Model B’s basic block and third pattern ...83
Figure 69: Model B’s third prototype created using Software B ...83
Figure 70: Comparison between Model B’s third and final patterns ...84
Figure 71: Model B’s final dress created using Software B ...85
Figure 72: Model C’s basic block created using Software B ...86
Figure 73: Model C’s basic block fitting ...86
Figure 74: Comparison between Model C’s basic block and third pattern ...87
Figure 75: Model C’s third prototype created using Software B ...87
Figure 76: Comparison between Model C’s third and final patterns ...88
Figure 77: Model C’s final dress created using Software B ...88
Figure 78: Model M’s basic block created using Software B ...89
Figure 79: Comparison of Model M’s basic block and third pattern ...90
Figure 80: Model M’s third prototype created using Software B ...90
Figure 81: Comparison between Model M’s third and final patterns ...91
Figure 82: Model M’s final dress created using Software B...92
Figure 83: Model Z’s basic block created by using Software B ...93
Figure 84: Comparison between Model Z’s basic block and third pattern ...94
Figure 85: Model Z’s third prototype created using Software B ...94
Figure 86: Comparison between Model Z’s third and final patterns ...95
Figure 87: Model Z’s final dress created using Software B ...95
Figure 88: Mean comparison of all fit models’ Dress A ...107
Figure 89: Mean comparison of all fit models’ Dress B ...108
1
CHAPTER I
INTRODUCTION
Computer-aided-design (CAD) is one of the most important information technologies used in the design and manufacturing processes. In this paper, the literature review presents the application of CAD techniques in the textile and apparel industry. Moreover, the 3D body scanning has been developed and utilized in the apparel industry. This study explores these applications of CAD technologies throughout the apparel product development process.
In the last two decades, researchers in the apparel field have been increasingly paying attention to CAD technologies. Those companies, who adopted CAD technologies, have believed that their businesses have more advantages in efficiency and quality (Yan & Fiorito, 2007). CAD technologies have advanced the apparel product development process and shortened lead times to market. Researchers have emphasized CAD technologies for size and fit factors and mass customization in the textile and apparel industry (Loker, 2007).
Rationale
CAD technologies have been applied to improve apparel size and fit for many years, although significant issues remain.Current sizing standards and shape categorizations cannot meet consumers’ needs. For example, the latest ASTM 5585 (ASTM International, 2011) Misses Sizing Standards categorized two shapes, Curvy and Straight, and size ranges 00-20. Therefore, some women whose sizes are bigger than 20 or with specific shapes other than Curvy and Straight will have difficulties finding garments to fit them.
2 customized products for those consumers (Song & Ashdown, 2013). However, it is not easy to meet consumers’ expectations during the mass customization process, because they probably do not have the patience for a long lead time, or are reluctant to pay extra money for customized products, or want garments to fit perfectly while everyone’s preference for fit is different.
Meanwhile, some CAD companies have taken varying approaches to enable a quick response to the customized requirements, and 3D body scanning has been developed to improve the chances of meeting consumers’ fit needs (Loker, 2007). CAD technologies, such as body scanning technology, made-to-measure pattern making, digital printing, and data integration, enable companies to develop customized products through communication with consumers directly (Anderson-Connell, Ulrich, & Brannon, 2002). Companies need to determine the best method, technologies, and services for their various situations. A strategy of mass customization allows companies to meet their consumers’ demands such as fit, with quick response and a reasonable price.
Purpose and Research Questions
The purpose of this research is to evaluate two different 2D CAD software systems and test their customization processes. The main goal is to determine if a group of technologies can be used to provide a desirable outcome for a specific situation in the apparel industry. Research questions are:
1. How do two different 2D CAD technologies work in the product development of mass customized garments?
a. What is the preparation process for each technology? b. How is a customized fit enabled within each technology?
3 3. How would a garment customized for fit using the process defined by each system be
evaluated?
Limitations
This study is limited to the evaluation of two 2D flat pattern systems, and four specific body shapes (hourglass, bottom hourglass, rectangle, and spoon). The sample sizes are small. Four subjects between the ages of 18-25 in the southeastern U.S. may not represent all ages or ethnicities of consumers who have fit issues.
Definition of Terms
Computer-aided-design (CAD): CAD includes any technology that uses computers to help in the design process (Morley & Parker, 2014). CAD for textiles and apparel includes software such as Adobe Illustrator, Adobe Photoshop (https://www.adobe.com), Gerber Accumark (http://www.gerbertechnology.com), Lectra (https://www.lectra.com), eTelestia(https://www.etelestia.com), Cad.Assyst (http://www.human-solutions.com), Browzwear (http://www.browzwear.com), Optitex (http://optitex.com), and Shima Seiki (http://www.shimaseiki.com).
Mass Customization: Mass customization is a term first coined by Joseph Pine in 1993. Mass customization was defined as a strategy for companies to manufacture products using mass production while enabling customized products for the individual consumers’ specific needs, so the price is still affordable (Anderson-Connell, Ulrich, & Brannon, 2002; Pine, 1993).
5
CHAPTER II
LITERATURE REVIEW
This chapter provides an overview of CAD technologies including 2D CAD software packages and 3D body scanning and introduces the ways to integrate the data/files into other systems. Since different software packages have their technological advantages and
disadvantages, previous research related to those CAD technologies will be discussed. It is necessary to evaluate apparel fit to examine these software packages. Fit issues related to sizing systems, population shift, anthropometry, and mass customization will also be reviewed.
History of Sizing
Manufacturers began producing early Ready-To-Wear (RTW) garments with their own sizing methods since there were no sizing systems. Consumers usually ordered garments through catalogs or magazines and they had difficulties finding garments to fit them with various sizes (Labat, 2007). In 1941, the US Department of Agriculture funded a research study to support commerce and business. O’Brien and Shelton (1941) conducted the research. They cooperated with several universities in the South and measured 10,042 Caucasian women aged 18-30 in eight states. Their samples were not representative of the whole population at the time.
6 Later in 1970, the National Bureau of Standards (NBS) refined the CS 215-58 sizing system as PS 42-70 Body Measurements for the Sizing of Women’s Patterns and Apparel (National Bureau of Standards, 1970). PS 42-70 utilized health surveys for height and weight conducted from 1960 to 1962 and a regression equation developed by the US Air Force, but the standard was based on O’Brien and Shelton’s (1941) anthropometric study. The PS 42-70 standard had more size ranges, but it did not change enough to be practical for apparel manufacturers.
Both CS 215-58 and PS 42-70 sizing systems were outdated because body shapes kept changing. ASTM (formerly the American Society for Testing and Materials) created the ASTM D5585 Standard in 1994, but this standard was still built on the 1941 database, in addition to US Army and Navy anthropometrical data, from 1988 and 1990, respectively (Ashdown, 1998).
An updated version of ASTM D5585 (ASTM International, 2001a) was not developed based on new anthropometric data due to the cost considerations of conducting a new research. However, ASTM D5586 Standard Tables of Body Measurements for Women 55 and older
(ASTM International, 2001b) was built on Reich and Goldsberry’s (1993) study, in which they measured 6,692 American women 55 older in 38 States (Labat, 2007).
7 Costs are the main consideration for the apparel industry, so companies have their
different solutions for sizing issues. Moreover, sizing in a company could also be inconsistent because of sourcing products from many suppliers in diverse countries. For example, Zara has its own design and technical teams to keep sizing consistent. Gap uses reliable suppliers to try to solve its size issues. H&M puts a lot of effort into the size and fit to achieve better results (Donaldson, 2014).
Population Shifts
Population shift is another problem for apparel sizing. Kennedy (2009) stated that Australian women’s body sizes have increased; current sizes are different compared to the same age women in the 1970s. Older women’s body shapes change with aging, so they have bigger sizes than younger women. In addition, the sizes of women’s apparel products are inconsistent in Australia. Not only the brands from the different countries, but also the brands from the same country have their own sizing standards, so consumers are confused about their actual sizes. Australian women’s apparel brands have adopted American sizes or European sizes, but their body sizes are different than Americans or Europeans because they are more active (Kennedy, 2009).
8 different, and the objective is to make consumers think they have smaller sizes than their exact sizes. This strategy could create loyal consumers.
Donaldson (2014) categorized the three objectives of fit for aesthetic, technical and commercial fit. There are some suggestions for apparel companies based on their target markets. Brands could ensure the creative team owns the aesthetic look, and the technical team could work on the garment’s construction, and both of them should not interfere with each other. For the commercial market, sourcing companies would use body scanning technology to determine most sizes in that country and adopt those results for their target customers (Donaldson, 2014).
CAD for Textiles and Apparel
CAD technologies were introduced in the 1970s, but the process of adopting CAD in the textile and apparel industry was quite slow. Some of the reasons included software/system cost consideration and technological barriers such as lack of information, experts, and training, which takes time and effort (Yan & Fiorito, 2002).
Based on 103 textile and apparel manufacturing companies’ replies to a questionnaire, Yan and Fiorito’s (2007) results showed that CAD/CAM adoptions were related to company sizes. Two-thirds of the companies who had at least 100 employees adopted CAD/CAM
technologies, while 80% of companies who had less than 50 employees were reluctant to do so, and 66% of companies who had 50-100 employees did not adopt at all. The researchers
suggested that CAD/CAM companies should develop more customized products, as well as more affordable software packages for small and medium-sized textile and apparel companies.
9 used by the participants. They found that some software packages focus heavily on managing and communicating data related to the products themselves, while other packages such as Lectra and Nedgraphics emphasize apparel specific CAD functionalities. Lectra has a fashion product life circle management (PLM) tool, while its competitor Gerber stresses more on Web managing and communicating product data (Segonds et al., 2014).
Gerber Technology, one of the earliest and leading commercial pattern making software companies, developed pattern design, grading, planning, and marker making software packages for the apparel industry. Gerber 2D software parts include pattern making, grading, and marker making. They have released AccuMark 10, which added digital printing and other functions to enhance the design and manufacturing productivity. For example, their Pattern Design program is able to create fabric textures, logos, and decorations on patterns. Digital printing provides more creative design options and could shorten the lead time, which is especially important for fast fashion (Gerber Technology’s AccuMark 10, 2015).
As mentioned above, CAD software packages have their specific applications, not only for the apparel industry but also for fashion design education. Telestia, founded by a fashion institution, SITAM-AB, in Greece, provides online courses in pattern making, fashion design, pattern grading, and sewing. Their main objective is for fashion design education. The institution has developed their own CAD software, Telestia Creator, which includes fashion designing, pattern making, and grading software packages. They also offer online tutoring videos for consumers to learn the course and software (https://www.etelestia.com).
10 customized MTM basic pattern block can be created to fit on the croquis. Designers can make any changes on the basic block using their Automatic Pattern Styler and produce an MTM Design Technical Block (https://www.etelestia.com).
Body Scanning Technology
Body scanning connects CAD technologies to apparel product development because body scanning technology can build avatars quickly on the computer after capturing parameters such as the human body's sizes and shapes (Apeagyei, 2010). The 3D body scan utilizes the optical technology and light sensitive parts to obtain measurements. In comparison to manual measuring methods, three-dimensional body scanning has more advantages in accuracy, efficiency, speed, reliability, and without a physical contract (Istook & Hwang, 2001; Kim, LaBat, Bye, Sohn, & Ryan, 2015). In the apparel industry, body scanning has multiple applications such as a new sizing system development, pattern making, grading systems, mass customization, 3D virtual simulation (Istook, 2002; Petrova & Ashdown, 2008).
Types of Scanners
The most common body scanners are based on laser line systems and structured light systems. Laser line systems scan a human body with a laser line and cameras record the scanned images, while in comparison, structured light systems project a pattern to scan a human body surface. Both laser line systems and structured line systems have software packages to process the scanned images. Although the scanning time of the structured light system only takes a few seconds, the system needs more time to extract the scanned images. Except for scanning
11 The speed of structured light systems is faster than that of laser line systems. It typically takes 10-30 frames per second to produce 3D images, so structured light systems could be used for handheld scanning or 4D scan. While the accuracy and the resolution of structured light scanners are less than those of laser line scanners, it is more difficult to convert the sensed light pattern into an accurate 3D image than that of a laser line. Moreover, the body scanning
technology has been updated. New techniques of body scanning featuring millimeter waves have been used in airports to check the skin surface underneath clothing. But the system is insufficient for the apparel industry because it lacks accuracy. Also, body scanners based on infrared waves have come to the market (Daanen & Ter Haar, 2013).
[TC]2. The [TC]2 3D body scanner was the first body scanning system designed for the apparel industry in 1998. The system utilized white light and the cameras to catch the body pattern and generate the body image (Simmons & Istook, 2003). The latest [TC]2-19B body scanner applies infrared depth sensors to catch body shapes. [TC]2-19B body scanners use fewer sensors than their previous version for reducing over-lapping images (http://www.tc2.com). The previous two versions of [TC]2 body scanners were based on a different type of technology, NX16 employed white light technology. The KX16 adopted depth sensors, which were a new and low-cost technology in 2012. The price of KX16 was only a third of that of NX16 ([TC]2, 2012).
12 fitting room app based on individual avatars imported from 3D body scanning, and another app based on statistic data for fitness uses (http://www.tc2.com).
Size Stream. Size Stream also develops 3D booth body scanners using infrared depth sensors. The scan time only takes 6 seconds and the data processing time is less than 30 seconds. The system can construct up to 5 scans in a single acquisition pass to minimize measurement errors and increase accuracy (http://www.sizestream.com).
Cyberware. Not only is technology changing, but so is the market. Some companies that used to manufacture body scanners are adjusting their marketing approach or go out of business. For example, Cyberware produced one of the most popular body scanners in the apparel
industry; previous body scanners were used for the CAESAR size survey. Cyberware’s WBX was widely used in the movie industry because of their reliable system (Daanen & Ter Haar, 2013). As shown on the Cyberware website, they originally focused on body scanning applications for the movie industry instead of the apparel industry, but the company was dissolved in 2011 (http://cyberware.com).
Vitronic. Another company, Vitronic, has manufactured various laser-based body scanners for different applications. Human Solution, as an international sales partner for Vitronic, sells VITUS BODYSCAN and other types of body scanners and provides software to process Vitronic scans for the apparel industry (http://www.human-solutions.com;
13
Kinect. Body scanners produced by the previously mentioned companies are still
expensive for home use even if companies have lowered costs and prices. Microsoft is seeking a cheaper 3D body scanning solution. KinectTM Sensor, a line of motion sensor input devices for Xbox 360, has made 3D scanning technology capable of entering homes. It is also a structured light scanner. Users hold the Kinect sensor to scan objects. A real-time color 3D scan can be generated using a Kinect sensor for Xbox 360 and PC. In addition, Microsoft has released a 3D Scan app for Windows 8.1 and 10, and users can download 3D Scan software for free. The scanning images can be used for 3D printing (3D Scan, 2016).
File Formats
Three-dimensional body scanners files can be integrated into other systems if the file format is compatible. At the end of the last century, some body scanner companies stated that their systems could integrate the measurement data into commercial apparel CAD systems. For example, both Telmat and [TC]2 were successfully compatible with Gerber Technology's CAD software (Istook & Hwang, 2001). With the technology improvement, the system of [TC]2-19B body scanner provides file formats including .obj, .txt, .ord, .rbd, .pdf and .bin, so the files can be applied to many 2D and 3D software packages.
Kscan3D, a software package designed by LMI Technologies, is compatible with Kinect for Windows V1 and V2, and Kinect for Xbox 360 to generate 3D images. The Kinect sensor gathers data from multiple angles, and the Kscan 3D software converts the data in .fbx, .obj, .stl, .ply, and .asc file formats. Users can export these generated files to 2D or 3D software packages for various applications such as CAD, 3D printing, and virtual try-on simulation
14 Song and Ashdown (2015) integrated body-scanning data into different software systems to compare the differences between virtual try-on pants and actual pants. They used Human Solutions VITUS/XXL 3-Dto body scan participants and converted the scan file to .rbd format, and analyzed the data by [TC]2 software NX16 for landmarks and measuring locations, and then converted files to .obj format, and imported them into the Optitex as individual participants’ avatars.
Anthropometry and Scanning Issues
Anthropometry quantitatively defines the dimensions of the human body. Traditional methods, which included manually taking subjects’ body measurements when they wore minimal clothing while standing, would result in many errors (Simmons & Istook, 2003). Precise body measurements, obtained by manual methods or using 3D body scanners, are crucial to construct a basic apparel block. The precision of body scanners is related to the type of technologies (such as laser, structured light), the quantity of sensors, and software packages to identify landmarks and extract measurements (Elbrecht & Palm, 2014).
15 Companies value their landmarks as one of their competitive advantages. The techniques of determining landmarks and taking measurements are not standardized so that the data from different measurement methods cannot be compared. To investigate landmark consistency, Simmons and Istook (2003) provided knowledge of anthropometric methods for the apparel industry, discussed traditional anthropometry with the measurement techniques of 3D scanners, and examined standards of 21 measurements on three scanners: [TC]2, Cyberware, and
SYMCAD. The results indicated that [TC]2 had the most landmarks to meet demands of the apparel industry (Simmons & Istook, 2003).
For instance, the “neck” measurement from [TC]2 was defined as the girth of the base of the neck, following the outline and shape of the neck base. [TC]2 measured the “chest” at the armpit level, taking the circumference above the bust, and defined the “bust” as the biggest horizontal circumference across the bust points. The measurements of “chest” and “bust” are important for women, especially for tight tops and dresses. The [TC]2 “waist” was defined as the smallest girth between the bust and the hip, and the “waist length back” of [TC]2 was measured from the neck base to the waist following the shape of the spine. [TC]2 marked “hips” as the maximum girth between the waist and the crotch, while neither Cyberware nor SYMCAD had hips measurement (Simmons & Istook, 2003).
16 Although the majority (97.4%) of children agreed to be body scanned, the successful scan results were only 70.7% of the 1446 children. The scan failures occurred because of clothing, body movement, or software defects, and these technical failures were related to the children’s age, size, and ethnicity. In comparison to manual measurements, 3D body scanning indicated “modest average biases but acceptable limits of agreement for large surveys” (Wells et al., 2015, p. 2). The analyses of the rate of acceptability, precision and accuracy of 3D body scanning for measurement of body shape are valuable, especially for children aged 5-11 years old. The analysis of the failures of 3D scanning results could be useful for the development of 3D body scanning technologies.
The garments that participants have worn during body scanning have created differences with participants’ body sizes. Kim et al. (2015) examined 14 measurements of the torso on 34 participants. The garment that they wore especially affected the measurements of the bust. Each participant wore the garment researchers provided. The participants’ measurements when wearing the provided garments were smaller than their measurements when they were just wearing bras and underpants. The results showed that garments compressed participants' breast tissue so that the bust measurements had differences. Therefore, it is recommended that
participants wear minimal clothing during body scanning processes.
17 comparison to measurements extracted from the white light body scanner, general measurements of the structured light body scanner were bigger. Moreover, both body scanners could not
effectively detect armpits and crotch (Elbrecht & Palm, 2014).
Shape Categorization
Apparel companies use 3D body scanning technology to improve their sizing systems by identifying their target customers' body sizes and fit. As Song and Ashdown (2013) mentioned, Victoria's Secret collaborated with [TC]2 to categorize various body types and identify the main problems in updating their sizing systems. Retailers such as JCPenney, Sears, and Levis Strauss have embraced 3D body scanning technology to provide a better fit for their customers by improving their size systems (Song & Ashdown, 2013).
Most consumers would not know their body sizes and shapes because of inaccurate self-measurement methods or subjective perceptions of their body sizes and shapes (Song &
Ashdown, 2013). Some researchers have utilized body-scanning technology for sizing system development, shape categorization, and mass customization. Song and Ashdown (2013) categorized participants’ body sizes and shapes by utilizing SizeUSA data, and compared the differentiation between participants’ body scanning measurements and their self-reported body size and shape information. They evaluated associations between their body perceptions, body cathexis and fit satisfaction of pants. They found that the relationship between body satisfaction and fit satisfaction was weak. Their findings could assist consumers in determining their fit of lower body garments such as pants.
Shape Categorization Methods
18 categorized subjects’ hips as five shapes: Round hip, pear-shaped, average hip, weight in front, and weight in the back. For the development of female upper torso patterns, Gazzuolo, DeLong, Lohr, LaBat, and Bye (1992) applied regression models to compare the differences between the manual measurements taken from 50 women’s body lengths and girths and the measurements obtained from their frontal and lateral view photographs. They asserted that the photographic anthropometric method for measurement extraction was rapid and low-cost.
Moreover, London based company Bodymetrics worked with Serfontaine to provide a better fit for jeans. Bodymetrics body scanned 10,000 participants and categorized three shapes as Emerald, Sapphire, and Ruby. The customers made appointments with Bodymetrics and visited the Selfridges store to be body scanned. They then chose Selfridges jeans based on their categorized shapes (Arthurs, 2011; Remer, 2010).
Shape analysis tools. NTC Women’s Body Shape Analysis Tool (WBSAT) was
developed at Auburn University. The tool identified four shapes: Hourglass, rectangle, pear, and inverted triangle shapes (Connell et al., 2003). Devarajan and Istook (2004) examined Simmon’s (2002) shape categorizations and developed “Female Figure Identification Technique (FFIT) for Apparel” software, which classified women as nine body shapes using 253 female 3D body-scan data. Body measurements, including bust, waist, hip, high hip, abdomen, and stomach were utilized for the categorization of nine shapes (Simmons, 2002).
Hourglass: Subjects had balanced bust and hip girths with an obvious waistline (Figure 1).
Bottom Hourglass: Subjects had a clearly obvious waistline, but their hip girths were larger than their bust girths (Figure 1).
19 than their hip girths.
Spoon: Subjects’ hip girths were larger than their bust girths. In comparison to the Hourglass shape, their bust-to-waist ratios were lower, while their hip-to-waist ratios were higher (Figure 1).
Rectangle: Subjects’ bust girths and hip girths were almost equal. Their ratios of bust-to-waist and hip-to-bust-to-waist were too low to have a clearly obvious bust-to-waistline (Figure 1). Diamond: Subjects’ average stomach, waist, and abdomen measurements were bigger
than their bust measurements.
Oval: Subjects’ front views might be distinct, while their side views were especially different because their average stomach, waist, and abdomen measurements were smaller than their bust measurements.
Triangle: Subjects’ hip girths were larger than their bust girths, and their ratios of hip-to-waist were small.
Inverted Triangle: Subjects’ bust girths were larger than their hip girths, and their ratios of bust-to-waist were small (Simmons, 2002).
20 A random sample of 887 female subjects’ body-scan data was used for statistical
analysis. Cluster analysis, discriminant analysis, and multivariate analysis of variance
(MANOVA) were chosen to analyze the validation process. Cluster analysis based on the test data of 531 subjects’ measurements confirmed that FFIT software could apply to a larger sample size. Each subject of the test data fell into one of nine body shapes. For nine body shapes except for “Diamond” and “Inverted Triangle” shapes, the percentage accuracy and the performance of the FFIT software were better than those aspects of the Discriminant Function. The percentage accuracy of the shape “Diamond” and “Inverted Triangle” was low because they were small sample groups (Devarajan & Istook, 2004).
Five variables were validated for the shape classification. The results of the MANOVA analysis supported the hypothesis that a significant difference existed between the nine shapes. The FFIT study could be generalized to a larger American population. The nine body shapes could be applied in mass customization or developing new size standards for the apparel industry (Devarajan & Istook, 2004).
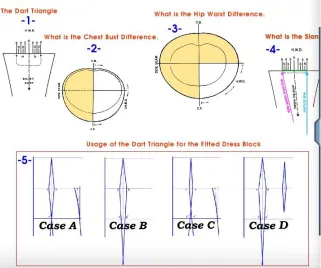
21 2013). Telestia templates have applied mathematical methods to fit individuals’ different sizes and shapes (Vouyouka, 1986).
Figure 2. Telestia four shape cases. Image taken from Telestia training module.
Mass Customization
In addition to improving sizing systems and shape categorizations, the application of CAD and body scanning technologies could be mass customization, but it is not easy for
companies to implement mass customization in their product development. The accuracy and the reliability of the body scanning data and participants’ fit preferences affected the development of a customized garment (Ashdown & Dunne, 2006). Moreover, consumers were involved at different levels during different approaches for mass customization. Gilmore and Pine (1997) categorized them as collaborative customization, adaptive customization, cosmetic
22 During the collaborative customization process, a company would build a product
database for individual consumers to collaborate, help consumers find their specific
requirements, and design customized products for consumers. Adaptive customization means that a company would develop some customizable products, which consumers could modify and adjust by themselves. A cosmetic customizer characterizes a standard product in diverse ways for different consumers. Transparent customizers offer special products and services to consumers, while consumers do not even realize that those products and services are customized (Gilmore & Pine, 1997). Companies could implement the most suitable mass customization strategy in their development of textile and apparel products.
Mass Customization Adoption
Some retailers such as JCPenney, Lands’ End, QVC, and indiDenim have adopted mass customization to develop their products. However, some projects were either suspended or partly stopped due to the complexity involved. Therefore, some companies have simplified the mass customization process (Song & Ashdown, 2012). For example, Nike provides some mass customized products named as NIKEiD on the website, but only for color or fabric options (http://www.nike.com/us/en_us/c/nikeid). Ralph Lauren offers personalization as a category on its website, but consumers are limited to select their embroidery on specific products
(http://www.ralphlauren.com).
In contrast, Brooks Brothers has successfully applied more complicated mass
customization to their business. They make mass customized men’s suits, sport coats, and pants for consumers. For their dress shirts, they provide four fits, many fabric choices, eight collars and four cuff options, and various styles for customers to select
23 body scanner for their mass customized suits in their New York City flagship store (Schlosser, 2004).
Mass Customization Approaches
There are different approaches to make custom patterns. One method is to draft a pattern by inputting individual measurements. Another is to utilize CAD companies’ MTM systems, which require pattern makers to apply alteration rules. Pattern makers can choose a graded pattern as the base pattern and alter the pattern for individuals (Turner & Bond, 1999).
Some CAD companies such as Gerber Technologies (http://www.gerbertechnology.com), Lectra (https://www.lectra.com), and Assyst (http://www.human-solutions.com) have their own MTM systems. These systems are based on similar rules. After pattern makers spend
considerable time and effort to make the basic pattern, the MTM systems allow pattern makers to automatically alter the existing patterns according to consumers’ measurements (Istook, 2002). In contrast, pattern makers can make the pattern for individuals or a fit model by using the first method, and they could add grading rules later for mass production.
However, it is not easy for apparel pattern makers to create a customized pattern block. Istook (2002) pointed out the basic steps for making customized garments. Pattern makers must determine critical alteration points, which are associated with specific measurements such as bust, waist, and hip girth for different types of garments. They also predict fit issues and decide grade points in those particular body locations, and then digitally name each grade point for systematically grading each piece of the pattern block.
24 decide on the type of movements, hold points and move points that need to be created and
controlled. Pattern makers must check the alteration rules and examine their accuracy. A size table needs to be created based on a fit model’s measurements as a basic size. In this alteration process, precise measurements are the essential requirement for customized garments. Finally, alteration patterns adjusted for individual customers can be made for markers, sent to a fabric cutter, and then to a tailor to sew the garment. In addition, it is better to examine the fit on the individual customer during the pattern adjustment process (Istook, 2002).
Ashdown and Dunne (2006) adopted Lectra FitNet software to make a custom hooded single layer jacket. A graded pattern was chosen to make the custom pattern and then a size of the pattern that was close to individual measurements was selected as the base pattern to alter. In this process, they created alteration rules for the jacket and verified the effects of seam lengths and angles to see whether the seams could be matched and sewed together. After fitting the set of custom patterns on six participants represented for different body types, researchers had to refine the pattern since only one customized pattern fitted a participant ideally. The second set of custom patterns was made and improved, except for small bust and hood sizes and long body length, so researchers readjusted the body chart and the third set of patterns worked well on participants (Ashdown & Dunne, 2006).
In addition, consumers’ perceptions of mass customization are also important for retailers who want to implement this strategy. Anderson-Connell, Ulrich, and Brannon (2002)
25 developed a consumer-based model based on their results, provided an initial framework for future research, and offered managerial implications to the apparel industry.
Previous Research
Researchers have proposed methods to evaluate the effect of CAD technology related to textile and apparel product development processes and/or participants’ perceptions (Table 1). For apparel product development, Petrova and Ashdown (2008) designed adjustable pants. They body scanned 24 participants whose ages were between 35 and 55. According to participants' hip-to-waist circumferences, researchers categorized them into three body shape groups: Straight, medium, and curvy. They compared the differences between participants’
measurements with minimal clothing and with adjustable pants in a standing position, and found that the ease differences decreased with increasing sizes, while there was no clear dependence on shapes. The implication of the results could be useful for the development of sizing systems and pattern making.
The process of body scanning usually requires participants to wear underwear or prepared tight clothing to get detailed 3D body images. Grogan, Gill, Brownbridge, Warnock, and
Armitage (2016) asked participants to fill out an online questionnaire after the body scanning process. Participants were worried about their privacy and felt vulnerable after viewing their scanned body images. Some participants could not believe their body scanning measurements and were dissatisfied with their scanned body images (Grogan et al., 2016).
26 ranking for size variations of six fit locations: overall size, waist, abdomen, hip, crotch, and hem was correct. The results proved that virtual software enabled participants to differentiate size variations of pants.
In Kim and Labat’s (2012) study, both quantitative and qualitative methods were adopted to conduct the research. Thirty-seven participants filled out the fit evaluation questionnaire of the virtual model and the fit evaluation questionnaire of the real body to evaluate the virtual and the developed real pants using a seven-point Likert-type scale. Questionnaires were related to 13 critical parts of pants such as front/back waistband, abdomen, hip, front/back thigh, front/back crotch, left/right side, inseam, hem, and overall fit. Moreover, participants explained their evaluations during an interview. Except for participants’ self-evaluation during apparel product developing processes, expert judges also conducted fit evaluations. For example, nine experts filled out a questionnaire to evaluate the pants’ fit on wearers in Song and Ashdown’s (2015) pants evaluation.
27
Table 1
Research Related to CAD and BodyScanning Technologies
Years Authors Purposes CAD & Body
Scanners
Research Design Findings
2015 Baytar & Ashdown
Investigated participants’ reactions and perceptions of 3D design and virtual try-on technology.
Human Solutions Vitus XXL body scanner; Optitex.
Eight apparel design students were body scanned for their avatars. They designed garments using Optitex and compared the real garments with the virtual garments.
Participants confirmed that the body scanning and virtual try-on technologies had the potential to shorten the time of designing or selecting garments.
2015 Kim et al. Compared participants wearing a scan garment over their own bra and underpants with the same participants wearing only their bra and underpants.
Human Solutions VITUS 3D body scanner.
Body scanned 32 participants and examined 14 measurements of the torso area.
Most of the body measurements were larger than the participants wearing undergarments only, especially for the bust area.
2015 Song & Ashdown
Evaluated the reliability of the self-perceived lower-body sizes and shapes using 3D body scanning technology.
Human Solutions Vitus XXL scanner; [TC]2
NX16 software; Gerber and Optitex.
Body scanned 83 female participants, categorized their lower body measurement data into three groups, and evaluated virtual pants and real pants.
The relationships between fit
satisfaction and body shape/size perception were weak.
2012 Kim & Labat
Investigated users’ evaluations of the fidelity and accuracy of 3D garment virtual try-on technology for online shopping.
Human Solutions Vitus XXL scanner; A 3D virtual software.
Body scanned 37 women aged 19-35 and built their 3D virtual models. Developed pants for evaluations.
The virtual try-on technology was somewhat good at accuracy and fidelity, but still needed improvements.
2010 Apeagyei Conducted a case study by using body scanning and virtual try-on technologies at a metropolitan university in the UK.
[TC]2 NX16
body scanner.
Body scanned 191 female subjects, compared and analyzed their measurement data, and implemented data to build avatars for virtual try-on.
3D body scanning is a valuable tool to capture and analyze body sizes and shapes; It could transfer mass production to mass customization. 2008 Petrova &
Ashdown
Evaluated women’s pants fit to analyze garment ease at lower body locations.
Vitronic Vitus/Smart 3D body scanner.
Body scanned 24 women and designed adjustable pants.
28
CHAPTER III
METHODOLOGY
Introduction
Computer-aided-design (CAD) is a powerful tool that could help meet the demands of customers whose needs have not been satisfied by current ready-to-wear garments. Literature has documented the fact that many consumers are unhappy with the fit of their clothing, making mass customized production necessary (Loker, 2007). The purpose of this study is to evaluate the Made-to-Measure (MTM) processes of two different 2D CAD software packages, which might allow products to be customized more efficiently and successfully for desired consumers. The following are the research questions evaluated in this paper:
1. How do two different 2D CAD technologies work in the development and production of mass customized garments?
a. What is the preparation process for each technology? b. How is a customized fit enabled within each technology?
2. Do body shapes have any impact on the successful customization of a garment? 3. How would a garment customized for fit using the process defined by each system be
evaluated?
29
Method
Sampling Method
The Institutional Review Board (IRB) at NC State University approved this research (Protocol number: 11855). The data were collected from November 2017 to April 2018. Participants were recruited from students and employees at NC State University, Raleigh Campus. Participants included five fit models and nine evaluators.
Fit models. Five fit models were selected based on Simmons’s (2002) body shape
categorizations. Since previous research suggested that body shapes might have an impact on the successful alteration of existing patterns (Lim, 2009), a subject/shape fit model was recruited in this study that epitomized each of the four major shape categories: Hourglass (balanced bust and hip girths with an obvious waistline); Bottom hourglass (hip girths larger than bust girths, with an obvious waistline); Spoon (hip girths larger than bust girths, with higher hip-to-waist ratios); and Rectangle (almost equal bust and hip girths without an obvious waistline) (Simmons, 2002).
In order to obtain subjects with the “ideal” shapes, the researcher evaluated measurement data obtained through normal class scanning processes and invited “ideal” subjects to participate in this research. Only subjects between 18 and 25 years old were included in this study to reduce the impact that age might have on body shapes and postures. A female fit model who was willing to participate in this research was invited first for the basic block development in Software A. The other four fit models were recruited at NC State University with each subject standing for one of four typical body shapes.
30 1. Faculty with pattern making experience
2. Potential consumers (students who fell within the age group of 18-25)
3. Fit models
Apparatus/Instrument
CAD software packages can generate customized patterns by two methods. One method generates custom patterns from graded pattern sets; the other uses individual patterns, which were altered by inputting measurements (Istook, 2002). A garment was designed using Adobe Illustrator, and a basic pattern for this design was created using a 2D software package labeled as Software A. Block patterns for fit models were generated based on the basic pattern. The same design and patterns were developed using the other 2D software called Software B.
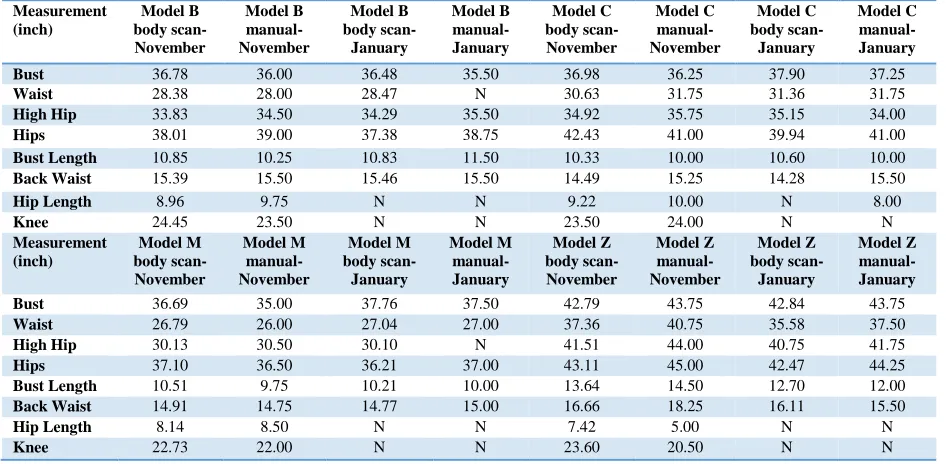
A questionnaire was designed for an evaluation and comparison of the final custom garments. A [TC]2 3D body scanner based on depth sensors was adopted to scan fit models because its software can extract measurements following the measuring methods required by Software A and Software B. In addition, a measuring tape was also used to manually measure fit models to confirm the body scan measurements.
Measuring Methods
The measurements that were taken for Software A were defined as follows: Bust: Largest circumference taken horizontally across the bust points. Bust length: Distance from the side neck point to the bust point. Waist: Smallest circumference between the bust and the hip. High hip: Circumference 3 inches below the waist level.
Hips: Circumference measured horizontally at the most prominent rear point
31 Back Waist: Length measured vertically from the neck base to the waist following
the shape of the spine.
Hip Length: Length measured vertically from the waist level to the hip level at the
side.
Knee: Length measured vertically from the kneecap to the floor.
The measuring method required by Software B was slightly different (Figure 3). The measurements were taken as follows:
Chest: Circumference of the chest taken at the underarm level.
Bust: Measurement taken horizontally across the back at the underarm, then
curved down to cross the bust points horizontally (Figure 3).
Chest bust difference (CBD): The bust measurement minus the chest
measurement.
Bust length: The side neck point to the bust apex. Bust Distance: Distance between bust points.
Waist: Actual waist, where the circumference between the rib cage ends and the
pelvis starts. If the waist was taken lower than the exact location, the total bodice length will be longer than it should be and garment fit will be affected.
32 Total bodice length (TBL): Length measured from the front waist to side neck
point to bust point to the back waist (Figure 3).
Hips: Girth measured horizontally at the most prominent point of the hips.
Hip Length: Length measured vertically from the waist to the hips at the front (Figure 3).
Test Product
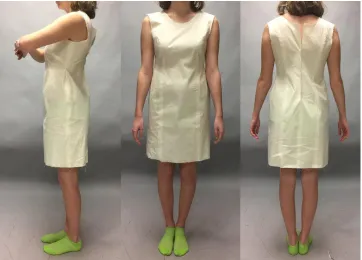
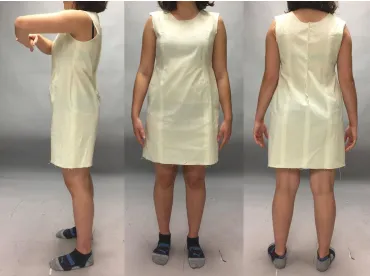
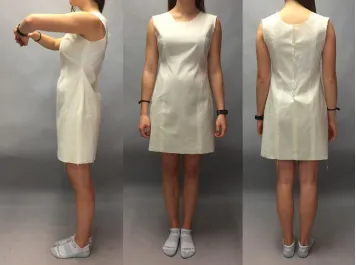
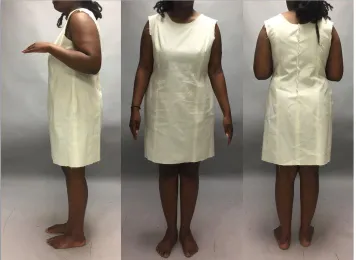
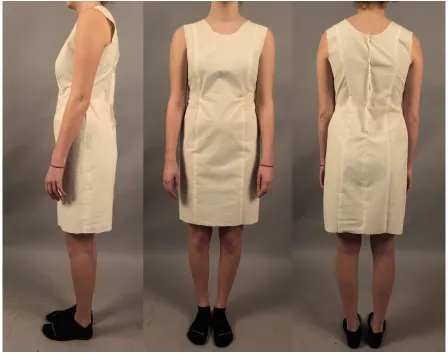
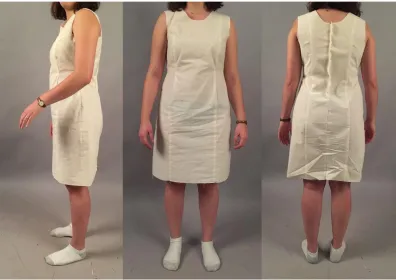
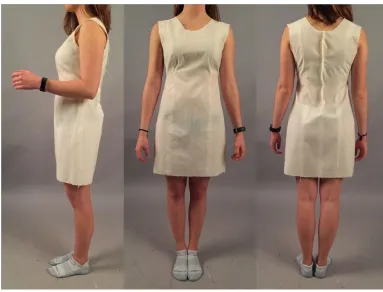
For four typical body shapes, a simple sleeveless shift dress with princess seams (Figure 4) was created using Software A and Software B. The simple sleeveless shift dress was an appropriate choice to investigate the shape influences based on the bust, waist, and hip measurements, and the princess seams had a greater capacity to be altered to improve the garment fit.
Figure 4. Simple sleeveless shift dress with princess seams.
33 prototypes. The drafts of the patterns were altered based on each fit model’s body measurements and the fit results. In total, two prototypes and two dresses were developed using Software A for the primary fit model. Moreover, three prototype fittings were conducted on each of the four fit models to achieve a good fit. Final garments labeled as Dress A and Dress B based on two sets of patterns were made, for a total of eight dresses.
Protocol
Five fit models were body scanned again with the [TC]2 3D body scanner after recruiting them (Appendix A). The body scanning process took 5 minutes and was conducted at the
College of Textiles, NC State University. Fit models were required to wear bras and underpants in the body scanner.
There were four fittings. Each fitting lasted about 20 minutes. Fit models were
photographed wearing the garments from the front, side, and back. At the first three fittings, they responded to some questions related to the size and fit, performed some activities such as lifting arms, walking, and sitting, and provided feedback for the researcher to adjust the prototypes. This process was necessary to perfect the customization process. During the final fitting, four of the fit models filled out a questionnaire (Appendix B) to evaluate the fit of the dresses created using both software systems. They kept the garments that were created for them after the study was complete.
34 comparison pictures were shown on a big computer screen at the end of the evaluation process (Appendix C).
Figure 5. Methodology flowchart.
Data Collection
1. Body Scan Data—using the [TC]2 Scanner (Appendix A) 2. Fit Evaluation Questionnaire (Appendix B)
Data Analysis
35
Table 2
Data Analyses for Research Questions
Research Questions Data Collection & Analyses
1. How do differing 2D technologies work in the development and production of mass customized garments?
Lab notes and computer screenshots were taken during the product development process, and used to explain and compare two 2D software functions such as ease-of-use, pattern making process, and customized fit. An appropriate qualitative analysis was conducted.
2. Do body shapes have any impact on the successful customization of a garment?
Evaluation responses were adopted for qualitative analysis.
3. How would a garment customized for fit using the process defined by each system be evaluated?
Descriptive analyses and a paired t-test (one-tailed) were conducted on the survey
36
CHAPTER IV
RESULTS
Description of Sample
Four fit models representing the Spoon (Model B), Bottom hourglass (Model C), Hourglass (Model M), and Rectangle (Model Z) shapes were selected from existing body scan data of students enrolled in a product development class. These subjects’ body scan data was used in the development of the block patterns in each body shape group. For the basic block development in Software A, a fit model aged 18-25 and represented a bottom hourglass was solicited (Model A).
Two different Made-to-Measure (MTM) processes were evaluated. The Software A process included many steps to create a customized garment. The Software B process actually created a custom fit garment directly from measurements. The Software A and Software B processes were compared and contrasted to answer the research questions as follows:
1. How do differing 2D CAD technologies work in the development and production of
mass customized garments?
2. Do body shapes have any impact on the successful customization of a garment?
Software A Process
Creating a Basic Block Using Software A
37
Figure 6. The basic dress block.
Figure 7. Model A’s first prototype created using Software A.
38 Princess seams were developed in the dress using traditional pattern engineering methods (Figure 8). The second prototype was completed and fit on Model A. Additional fit problems existed, such as extra fabric at the back waist and hips (Figure 9). The pattern was adjusted again.
Figure 8. The shift dress was changed to the princess shift dress. Note. 1: Added the tapered fullness. 2: Split to the princess shift dress.
Figure 9. Model A’s second prototype.
After the pattern was refined, Ponte knit fabric, which had a little stretch, was selected to make the pilot dress. The dress was cut using a Lectra cutting machine and assembled to
39 on Model A again. To meet more consumers’ preferences and more accurately show different body shapes, the A-line dress was adjusted to a straight line dress (Figure 11).
Figure 10. Model A’s A-line dress.
40 The results showed that the woven fabric was a better choice to evaluate fit, however, the red color did not improve the visibility of the seam lines.Therefore, a similar medium weight woven fabric, 97% cotton and 3% lycra dark tan stretch sateen, was selected to make the final dresses for each of four fit model. The fabric content of 3% lycra gave a little stretch, and the dark tan color displayed the seam lines better.
Developing the MTM System Using Software A
In Software A, multiple tables were developed to guide the alteration of a garment developed for mass production. This included a grade rule table, a size code table, and
alternation rules that were created and applied to the basic pattern block to generate the custom fitted dresses.
Size code table. A size code table, with a range of sizes from 0-26, was developed based on Model A’s measurements (Figure 12). Model A’s measurements were categorized into a size 8 in the size code table, and the size interval was developed (Table 3). The primary parameters determined to be most important to the fit of the dress were bust girth, waist girth, hip girth, back-waist length, knee length, and waist to hips length. These measurements were entered into the size code table and all the sizes were defined according to the grading method used in the basic garment and with Model A’s measurements as the base size.
41
Table 3
Size Intervals of the Size Code Table
Grade rule table. A grade rule table was applied to the basic pattern according to industry standard grading of Misses. As indicated in Figure 13, each essential point on the pattern pieces had a grade rule applied to adjust the points in x and y directions to increase or decrease the size of the pattern pieces (Figure 14). The graded nest of the pattern is exhibited in Figure 15.
Figure 13. The grade rule table.
42
Figure 14. Grade numbers.
43
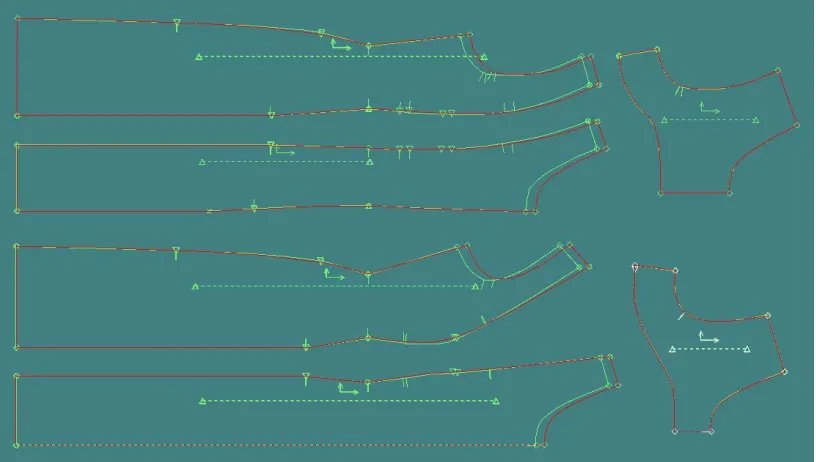
Alteration rules. Alternation rules, including alteration point numbers, movement types, and percentage changes, were created for the princess shift dress. Alternation numbers were attached to those alteration points (Figure 16). Grade points were numbered for the growth of the pattern pieces for different sizes, while alternation points were related to grade points, for the same reason. The alteration code must work appropriately for the necessary fit adjustments. Therefore, some tests and adjustments were performed and completed for this purpose.
There are different types of movements for the development of alteration rules (Istook, 2002). In this study, two types of movements, including counter-clockwise extension (CCW Ext), and X and Y move (X Y Move), were adopted for the alteration. The first point was the hold point and the second point was the move point. The X Y Move indicated the movement direction and was generally changed in a clockwise direction (Figure 17).
44
Figure 17. Alteration rule tables.
Critical alteration points were located at the neck, bust, armholes, waist, hips, back waist length, hip length, and knee length. The alteration amounts were equal to the measurement identified for the size in the size code table minus the individual’s measurements. As shown in Figure 17, Alternation rules for each parameter including types of movements, hold and move points, and movement amounts developed to manipulate the movement of alteration points. Errors in the alteration tables were found and fixed after testing the alteration of each parameter.
45
Figure 18. Alteration rules at the bust girth. The altered bust girth in red.
Points 2130 at the front waist girth and 2230 at the back waist girth were separately allocated for the alteration rules of the waist (Figure 19). The dress had symmetric two front waist points and two back waist points. Therefore, both the side waist point 2130 in the front pattern and the side waist point 2230 in the back pattern were equally changed 25% in the Y direction. Princess seam waist points 2255 and 2150 on the front and back pieces were also created for the waist girth alteration. While for points 2255 and 2150 at the waist and 2240 and 2145 at the princessseams, the alteration amount was evenly calculated 12.5% in the Y direction.