18th International Conference on Structural Mechanics in Reactor Technology (SMiRT 18) Beijing, China, August 7-12, 2005 SMiRT18-K11-4
3411 Copyright © 2005 by SMiRT18
EXPERIMENTAL STUDY ON VERTICAL COMPONENT
ISOLATION SYSTEM
Shigeki Okamura
Japan Nuclear Cycle Development Institute, Ibaraki, Japan
Phone: +81-29-267-4141,Fax: +81-29-267-5279 E-mail: [email protected]
Seiji Kitamura
Japan Nuclear Cycle Development Institute, Ibaraki, Japan
Phone: +81-29-267-4141,Fax: +81-29-267-5279 E-mail: [email protected]
Kenji Takahashi
Japan Atomic Power Company, Tokyo, Japan E-mail: [email protected]
Takahiro Somaki
O-BAYASHI Company, Tokyo, Japan Phone: +81-3-5769-2723,Fax: +81-3-5769-1943
E-mail: [email protected]
ABSTRACT
In Japan, several kinds of three-dimensional seismic isolation system for next-generation nuclear power plant such as fast reactors have been studied in recent years. We proposed a structural concept of a vertical component isolation system, assuming a building adopting a horizontal base isolation system. In this concept, a reactor vessel and major primary components are suspended from a large common deck supported by vertical isolation devices consisting of large coned disk springs. In order to verify the isolation performance of the vertical component isolation system, shaking table tests using a 1/8 scaled model were conducted. The test model was composed of 4 vertical isolation devices, common deck and horizontal load support structure. For the design earthquake, the system smoothly operated, and sufficient isolation characteristics were shown. The simulation analysis results matched well the test results, so the applicability of the design technique was verified. As the result, the prospect that the vertical isolation system applied to the FBR plant could technically realize was obtained.
Keywords: Three-dimensional Seismic Isolation device, Vertical isolation system, Coned disk spring, Common deck, Shaking Table Test
1. INTRODUCTION
Although the horizontal force of an earthquake ground motion is sufficiently reduced by a base isolation system with laminated rubber bearings, the vertical force is transmitted directly. If a three-dimensional isolation were achieved by adding a vertical isolation system, it would substantially enhance plant economy and safety. In order to realize a three-dimensional isolation system, two types of systems can be considered. One is a three-dimensional base isolation system, and the other is a combination of base horizontal isolation and vertical component isolation. In FBR plants, structural problems in which the consideration for vertical motion is required are uplift of fuel assemblies, reactivity change and buckling of reactor vessel. Since vertical isolation coverage can be limited to the area in which a reactor vessel and primary coolant system are installed, we have constructed a structural concept of a vertical component isolation system called “common deck vertical isolation system” [1].
3412 Copyright © 2005 by SMiRT18 structure called “common deck”, and vertical isolation devices are installed between the deck and substructures. Coned disk springs were chosen for spring element of the vertical isolation device. The disk spring can be stacked in various configurations. By stacking the coned disk springs of the same shape in parallel, it is possible to increase support load per one device. By stacking this set more and more in several series, large stroke can be achieved.
We designed the vertical isolation device with coned disk springs and steel beam dampers for FBR plants, which could be achieved vertical isolation frequency of 1Hz and damping ratio of 20%. Full scale coned disk spring and damper performance tests were carried out, and the validity of design method was confirmed [2].
In this paper, a series of shaking table test using a 1/8 scale model of the common deck vertical isolation system is described.
2. OUTLINE OF VERTICAL ISOLATION SYSTEM
2.1 Isolation Device
A coned disk spring for seismic isolation device has following features. 1) The restoring force characteristics show nonlinearity. 2) The effect of the ground end cannot be disregarded. 3) The effect of the friction becomes remarkable, because large number of coned disk is stacked. Considering these features, a single coned disk (Fig.1) is designed using the following equation by Curti and Orland [3].
{
3}
2 (h0 )(h0 /2)Ct Dt
a E
P= δ −δ −δ + (1)
where, ν ν ν ν α α ν ν α α π α α ν ν α α α ν π − − − = − = ⎟⎟ ⎠ ⎞ ⎜⎜ ⎝ ⎛ − − + + + − − = − + 1 1 1 1 6 1 1 1 2 1 ) 1 ( 1 2 1 1 3 2 a d d a D C
P: Spring load of single disk
δ: Deflection of single disk
E: Modulus of elasticity a: Outside radius of spring
b: Inside radius of spring α: Ration of outside to inside diameter =ba
0
h : Initial cone height of spring t: Thickness of single disk υ: Poisson’s ratio
And, the equation of Niepage [4] which can appropriately consider the effect of the friction is also used in the design of the isolation device.
⎭ ⎬ ⎫ ⎩ ⎨ ⎧ − − ± = t a n M P P / 1 1 ) 1 ( 1 1 α α µ ⎥ ⎦ ⎤ ⎢ ⎣ ⎡ ⎭ ⎬ ⎫ ⎩ ⎨ ⎧ + ⎟ ⎠ ⎞ ⎜ ⎝ ⎛ − − ± × R h t h t a µ δ α α 1 0 1 0 / 1 1 1
1 (2)
1
P n
Pf = ×
δ δf =m×
where, Pf: Spring load of stack δf: Deflection of stack
n: Number of single disk stacked in parallel m: Number of disks stacked in series M
µ : Factor to account for inter-surface friction µR: Factor to account for edge friction
A schematic drawing of the isolation device is shown in Fig.2. The coned disk spring is made of the ordinary high tensile spring steels, Japanese Industrial Standard (JIS) SUP10, which is almost the same as SAE 6150 in USA. Outside diameter of the coned disk was set to be 1m and thickness was set to be 27mm, considering current productivity from the viewpoint of machining and heat treatment. By stacking 5 disks in parallel and 14 sets in series, the isolation device is made up 70 disks in total. The middle washers are inserted
H 2b
2a t
h0
3413 Copyright © 2005 by SMiRT18 between coned disk springs of the serial stack in order to prevent side slip. And, the center guide is installed inside of disks. The unloaded height of a stack becomes about 2.5m. Steel beam dampers with the hysteretic behavior are installed at the upper part of the device. In order to increase the low cycle fatigue strength, a tapering beam damper was designed. It is possible to produce the necessary damping force, when the device was combined with 3 dampers per one device.
2.2Plant layout
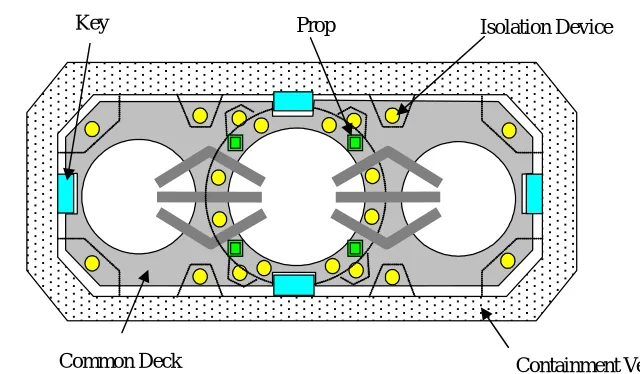
Application of the common deck isolation system to a 750MWe sodium cooled loop type FBR plant [5] is shown in Fig.3. In this plant, the common deck supports reactor vessel and two integrated components which combined the intermediate heat exchanger with the pump. The deck becomes a rectangle of 32m×12m size. The thickness of the deck is made to be about 2m in order to ensure the necessary rigidity. Total installation weight is about 57MN, and it is supported by 20 isolation devices. Considering weight distribution and rigidity allocation, the isolation device was mainly placed at circumference of reactor vessel and peripheral part of the deck. Horizontal load acting on the common deck is the horizontal seismic load and thermal expansion load as a result of temperature change by operating state. Horizontal load support structure is established so that it may not exert the horizontal load on the vertical isolation element. It shows the design concept of horizontal support structure in the following.
1) The horizontal load is not exerted on the isolation element.
Fig.3 Plant layout
Horizontal Isolator IHX/PUMP
Vertical Isolator Common Deck R/V
Horizontal Isolator IHX/PUMP
Vertical Isolator Common Deck R/V
Horizontal Isolator IHX/PUMP
Vertical Isolator Common Deck R/V
Fig. 2 Schematic drawing of isolation device
Fig.4 Design of common deck and horizontal load support structure (Application example to 750MWe sodium cooled loop type FBR plant.)
Key Prop Isolation Device
3414 Copyright © 2005 by SMiRT18 2) It smoothly operates in the vertical direction.
3) The thermal expansion is not restricted.
As a design example of horizontal load support structure, key and prop are installed. The key is horizontally supported through the cylindrical rollers in the horizontal and vertical directions. It is installed on the symmetric line of the common deck, and the thermal expansion of the symmetric axis direction is not restricted. The prop is installed in the circumference of the reactor vessel, and the thermal expansion displacement is absorbed in the elastic deformation of the prop.
3. TEST MODEL
3.1 Common deck
Objectives of the shaking table test are to confirm the isolation performance of the proposed isolation system during the earthquake.
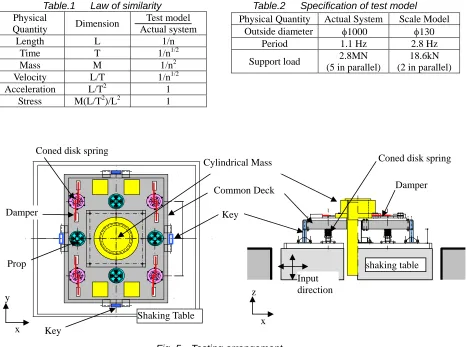
The test model was composed of 4 vertical isolation devices, which were reduced at the ratio of the length in 1/8, common deck and horizontal load suspension system. The law of similarity is shown in Table 1, and the dimension of the test model is shown in Tables 2.
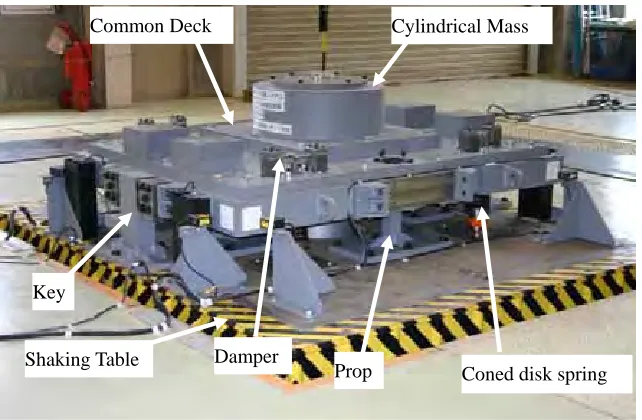
The test model is shown in Fig.5 and Photo 1. The dimension of the common deck model is 1.7m×2.2m with thickness of 0.2m. The cylindrical mass, which is modeled a reactor vessel, is set up in the center of the common deck. The sum total weight of the common deck model and the cylindrical mass is 76.2kN.
Table.1 Law of similarity Table.2 Specification of test model Physical
Quantity Dimension
Test model Actual system
Length L 1/n
Time T 1/n1/2
Mass M 1/n2
Velocity L/T 1/n1/2
Acceleration L/T2 1
Stress M(L/T2)/L2 1
Physical Quantity Actual System Scale Model Outside diameter φ1000 φ130
Period 1.1 Hz 2.8 Hz Support load 2.8MN
(5 in parallel)
18.6kN (2 in parallel)
Fig. 5 Testing arrangement x z
shaking table Input
direction Damper
x y
Common Deck
Shaking Table Key
Prop
Cylindrical Mass
Key
Coned disk spring Coned disk spring
3415 Copyright © 2005 by SMiRT18 3.2 Isolation Device
The geometry of single coned disk spring specimen is shown in Fig.6. The coned spring is standard product by press forming. The combination of coned disk springs for the vertical isolation device model is designed to be 2 in parallel and 14 in series, and then one device model consists of 28 disk springs in total. A preassembled disk spring stack is shown in Photo 2. The characteristic of a vertical isolation device is shown in Fig.7.
0 20 40 60 80 100 120 140
0 10 20 30 40 50
displacement [m]
F
o
rce [
k
N
]
Test Design Eq.
Photo 2 Coned disk spring Fig. 7 Restoring force of vertical isolation device
Support load
Damper Shaking Table
Prop Coned disk spring Key
Cylindrical Mass Common Deck
Photo 1 Test specimen on shaking table
Fig.6 Geometry of coned disk spring in mm 7.76
130 32.5 3.6
3416 Copyright © 2005 by SMiRT18 3.3 Damper
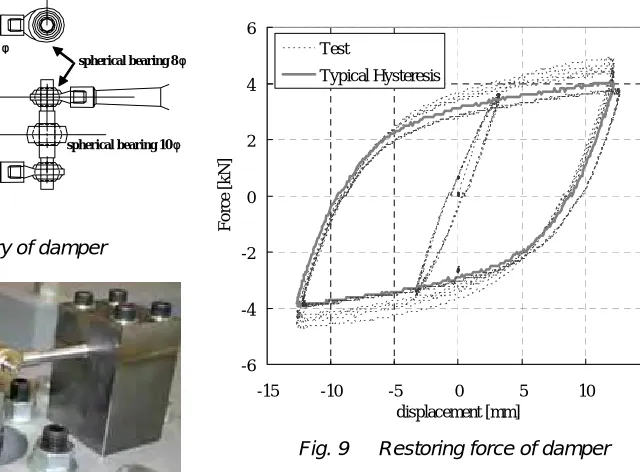
The geometry of the damper model is shown in Fig.8. The damper is made of general steel, and it has taper so that stress distribution may become uniform. Photo 3 shows the installation view of the damper. Two dampers are installed in one device. One end of the damper is fixed on the common deck, and the other end is connected to the center guide using a spherical bearing. Two spherical bearings are attached to both end of the guide. As shown in Photo 3, three spherical releases the rotation that results from the reducing axial length when the damper deforms.
The damping force was designed considering the law of similarity and parallel number of coned disk spring. The restoring force characteristics of two dampers are shown in Fig.9. From the results of a design analysis, the vertical frequency of the test model increased to 4.5Hz by the initial stiffness of the damper.
4. SHAKING TABLE TEST
4.1 Test Cases
The frequency response characteristics in horizontal and vertical directions of the test model were measured by sine sweep tests. In order to confirm the isolation performance of the isolation system during the earthquake, a series of seismic wave tests was carried out. Test cases are shown in Table 3.
Table.3 Test Case
Test Case direction Input wave
horizontal 2-60[Hz] 0.45 [m/s2] 0.60 [m/s2] 1.20 [m/s2] Sine Sweep Test
vertical Sine 2-20[Hz]
2.40 [m/s2] 0.67 times seismic wave
seismic wave Seismic Wave Test
1.5 times seismic wave Horizontal Load Support Structure Test
horizontal and vertical
seismic wave
spherical bearing 8
spherical bearing 10
Fig. 8 Geometry of damper
-6 -4 -2 0 2 4 6
-15 -10 -5 0 5 10 15
displacement [mm]
F
o
rce [
k
N
]
Test
Typical Hysteresis
Fig. 9 Restoring force of damper
3417 Copyright © 2005 by SMiRT18 The input seismic wave was set in the following procedures.
1) The design earthquake, named “Case Study S2”, was set for the isolation device development by “The three-dimensional isolation development project in Japan” [6].
2) Response acceleration at the isolation device installation level was evaluated by seismic response analysis of a typical FBR building (Fig.10) for the design earthquake.
3) Time axis of the response acceleration was reduced to 1/2.8 (=1/ N:N=7.7) according to the law of
similarity. Floor response spectrums are compared in Fig.11.
In addition, in order to investigate the effect on the response by preload and clearance of the roller of the horizontal load support structure, Horizontal Load Support Structure Test was carried out.
4.2 Frequency Response Performance
The transfer functions obtained by the sine sweep tests are shown in Fig.12. The horizontal dominant frequency of the test model is about 25Hz, which is determined by the total stiffness of the horizontal load support structures. The vertical resonance frequency is about 3.5Hz, 4.5Hz, 5.0Hz for input level 0.60m/s2,
0 10 20 30 40 50 60 70
0.01 0.1 Period [sec] 1 10
[m
/s
2 ]
Design earthquake Response acceleration Input of shake table (Seismic wave) 0
10 20 30 40 50 60
0.01 0.1 Period [sec] 1 10
[m
/s
2 ]
Design earthquake Response acceleration Input of shake table
(seismic wave)
Axial rigidity of horizontal isolation device
Soil spring IC REB+RCCV
Response
Vibration
Shaking table
Fig.10 Analysis model of FBR building
h=0.01
h=0.01
Fig.11 Floor response spectrum of input wave (a) Horizontal direction
(b) Vertical direction
Fig.12 Transfer function obtain by Sweep Test 0
2 4 6 8
0 10 20 30 40 50 60
Frequency [Hz]
T
ran
sf
er
F
u
n
ct
io
n
Sine wave 0.45[m/s2] Seismic wave
0 1 2 3 4 5
0 5 10 15 20
Frequency [Hz]
T
ran
sf
er
F
u
n
ct
io
n
Sine wave 0.60[m/s2] Sine wave 1.20[m/s2] Sine wave 2.40[m/s2] Seismic wave
3418 Copyright © 2005 by SMiRT18 1.20m/s2, 2.40m/s2 respectively. As the input level increases, the vertical frequency increases, because the characteristic of the isolation device which consists coned disk springs and steel dampers have the softening property. In Fig.12, frequency response performance curve obtained by the seismic wave test is also plotted. In this case, vertical resonance frequency becomes about 4.8Hz, and almost the same as the design value 4.5Hz. Damping ratio obtained by the curve fitting method using the transfer function of the seismic wave test is about 20%, which is well consistent with the design value. Therefore, it can be judged that the design method of the vertical isolation device was appropriate.
4.3Seismic Wave Test
Seismic wave tests were carried out using the seismic wave in several times, it was confirmed that the system smoothly responded. The typical results of the seismic wave test are shown in Fig.13. In the figure, the acceleration at the center of common deck, the displacements of common deck in horizontal and vertical directions are shown.
In horizontal direction, there is no difference between the input and the response acceleration. Relative displacement between the common deck and the shaking table is very small. Therefore, it was confirmed that the horizontal load supporting systems sufficiently supported the horizontal seismic load.
In vertical direction, we can see the high frequency component has faded away from the waveform of the response acceleration. Maximum value of the response acceleration is almost the same as that of the input. Maximum value of the response displacement is about 9mm.
Fig. 14 shows the Floor Response Spectra (FRS) at the center of common deck for each input level, comparing with the seismic wave. The parts of the arrow in these figures are natural period band, reduced by the law of similarity, of the main equipment and piping. Though the FRS in horizontal direction is amplified a little near 0.04sec of the natural period of horizontal support systems, the FRS of the seismic wave test is less than the acceleration value of equipment design criteria of 9.8m/s2.
The vertical isolation performance was confirmed, because the FRS around natural period band of the main equipment and piping was sufficiently reduced.
-3 0 3
0 5 10 15 20 25 30
[sce]
[m
/s
2]
-3 0 3
0 5 10 15 20 25 30
[sce]
[m
/s
2]
-0.01 0 0.01
0 5 10 15 20 25 30
[sce]
[m
]
Fig. 13 Time histories of seismic wave test
-8 0 8
0 5 10 15 20 25 30
[sce]
[m
/s
2]
-8 0 8
0 5 10 15 20 25 30
[sce]
[m
/s
2]
-0.01 0 0.01
0 5 10 15 20 25 30
[sce]
[m
]
(a) Horizontal input acceleration
(b) Acceleration on the deck in horizontal direction
(c) Relative displacement of the deck in horizontal direction
(d) Vertical input acceleration
(e) Acceleration on the deck in vertical direction
3419 Copyright © 2005 by SMiRT18 4.4 Horizontal Load Support Structure Test
The horizontal load support structure test was carried out in order to examine the effect of the preload of the roller on the response. The standard setting of the preload of the roller was made to be 0.1 times of horizontal seismic load calculated by static analysis. The horizontal support structure test was carried out under following conditions.
Case-1: The preload of key-1 is set at 10 times of the standard setting. Case-2: All rollers are made to be the contact condition.
Case-3: Clearance of 1mm is set at the roller of key-1 and key-2. Case-4: Clearance of 1mm is set at all rollers.
Table.4 Condition of Horizontal Load Support Structure Test
Key-1
Key-2
Prop and Key
Fig.15 Position of horizontal load support structure Condition of Horizontal Load Support Structure Condition
Key-1 Key-2 Prop and Key
Case-0 Standard setting
Case-1 10 times standard setting
Case-2 contact
Case-3 Clearance 1mm contact
Case-4 Clearance 1mm
0 10 20 30 40 50 60 70 80 90 100
0.01 0.1 Period [sec] 1 10
[m
/s
2]
Response on the deck Seismic wave
0 5 10 15 20 25 30
0.01 0.1 Period [sec] 1 10
[m
/s
2]
Response on the deck Seismic wave
h=0.01 h=0.01
Vertical natural period of equipments and piping Horizontal natural period of
equipments and piping
Fig.14 Floor response spectra of seismic wave test
3420 Copyright © 2005 by SMiRT18 Fig.16 shows the floor response spectra (FRS) at the center of the common deck model. In vertical FRS, the effect of the preload is not recognized. The effect of the preload of the horizontal support structure can be seen in the low-period region of horizontal FRS. Especially, the horizontal response is greatly increased in the case-4. Therefore, it is necessary that the clearance would not occur in the real machine design.
The clearance does not occur in the roller of the prop, because the thermal expansion displacement is absorbed in the elastic deformation of the prop. By ensuring the rigidity of the prop so that it may not affect the floor response, there is no amplification of the horizontal response, as the result of case-3 shows. By the effect of the gamma exothermic effect, the temperature of the common deck rises. The cooling unit is founded in the inside of the deck so that the temperature of the common deck may not rise. As a result of the thermal expansion analysis, it has been proven that the temperature around the key with much proportion of the steel product tends to rise higher than the temperature of the common deck. Therefore, the clearance does not occur in the roller of the key.
5. SIMULATION ANALYSIS
5.1 Analysis Model
Simulation analysis of the test model was conducted. The analysis model is shown the Fig.17. In horizontal direction, analysis model is two-degrees-of-freedom with two-mass model which consists of the common deck and the cylindrical mass. Two nodes are connected by the beam element which has equivalent bending stiffness of the cylindrical mass. The stiffness of the horizontal supporting system is considered. In vertical direction, analysis model is single-degree-of-freedom model. The restoring force characteristics of the coned disk spring and the damper were used the measured results of Fig.7 and Fig.9, respectively.
0 10 20 30 40 50 60 70 80 90 100
0.01 0.1 Period [sec] 1 10
[m
/s
2]
Case-0 Case-1 Case-2 Case-3 Case-4
0 5 10 15 20 25 30 35 40
0.01 0.1 Period [sec] 1 10
[m
/s
2]
Case-0 Case-1 Case-2 Case-3 Case-4
Vertical natural period of equipments and piping Horizontal natural period of
equipments and piping
Fig.16 Floor response spectra of seismic wave test
h=0.01 h=0.01
(a) Horizontal direction (b) Vertical direction
Common deck: 68kN Horizontal load
suspension systems
Coned disk spring with damper
Cylindrical mass: 8.2kN
Mass: 76.2kN
Damper Coned disk spring
Fig.17 Analytical model
3421 Copyright © 2005 by SMiRT18 5.2 Result of Analysis
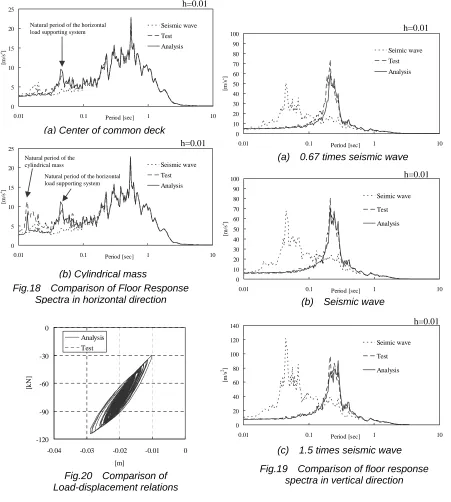
Fig.18 and Fig.19 show the comparison of FRS between analysis and tests results in horizontal and vertical directions, respectively. In horizontal direction, FRS increases at about 0.04sec (25Hz) which is a natural period of the horizontal load supporting system in comparison with the seismic wave. In FRS of cylindrical mass, FRS increases at about 0.014sec (71.4Hz) which is a natural period of the cylindrical mass. The analysis is similar to the test results in both directions. The response of the analysis is bigger than that of the shaking table test, and it is a safe side. Therefore, it was confirmed that this analysis method is applicable to the response estimation for the common deck isolation system.
The comparison of load-displacement relationships of the vertical isolation device for the seismic wave is shown in Fig.20. In this figure, the load is sum total of four isolation devices.
0 20 40 60 80 100 120 140
0.01 0.1 Period [sec] 1 10
[m /s 2] Seimic wave Test Analysis 0 10 20 30 40 50 60 70 80 90 100
0.01 0.1 Period [sec] 1 10
[m /s 2] Seimic wave Test Analysis 0 10 20 30 40 50 60 70 80 90 100
0.01 0.1 Period [sec] 1 10
[m /s 2] Seimic wave Test Analysis 0 5 10 15 20 25
0.01 0.1 Period [sec] 1 10
[m /s 2] Seismic wave Test Analysis 0 5 10 15 20 25
0.01 0.1 Period [sec] 1 10
[m /s 2] Seismic wave Test Analysis h=0.01
Fig.19 Comparison of floor response spectra in vertical direction
h=0.01
h=0.01 h=0.01
h=0.01 (a) Center of common deck
(b) Cylindrical mass
Fig.18 Comparison of Floor Response Spectra in horizontal direction
Fig.20 Comparison of Load-displacement relations
Natural period of the horizontal load supporting system
Natural period of the horizontal load supporting system Natural period of the cylindrical mass -120 -90 -60 -30 0
-0.04 -0.03 -0.02 -0.01 0
[m] [k N ] Analysis Test
(b) Seismic wave
3422 Copyright © 2005 by SMiRT18 6. CONCLUSIONS
The shaking table test using 1/8 scale model of the common deck isolation system was carried out. The characteristics in horizontal and vertical direction of the test model were grasped, and it was confirmed that isolation performance of the proposed isolation system during the earthquakes. As the result, the prospect that the vertical component isolation system applied to the FBR plant could technically realize was obtained.
ACKNOWLEDGMENTS
This study was made as a part of the Ministry of Economy, Trade and Industry of the Japanese government sponsored R&D project on three-dimensional seismic isolation. It has been advanced with Miyamoto of Obayashi Corporation and Kamishima, Moro, Yokoi of Advanced Reactor Technology Co. Ltd.
REFERENCES
1. M. Morishita, S. Kitamura, Y. Kamishima, T. Nakatogawa, A. Miyamoto, and T. Somaki, “Structure of 3-Dimensional Seismic Isolated FBR Plant with Vertical Component Isolation System”, SMiRT-17, K10-1, 2003
2. S. Kitamura, T. Nakatogawa, A. Miyamoto T. Somaki, “Experimental Study on Coned Disk Spring for Vertical Seismic Isolation System”, SMiRT-17, K10-2, 2003
3. Curti G. and Orland M., “Ein neues Berechnungsverfahren fur Tellerfedern”, DRAHT 30-1, pp.17-22, 1979 4. Niepage P., “Uber den Einfluß der Reidung und kreiskegelformiger Last einleitungselement auf die Kennlinie
von Einzeltellerfedrn und Tellerfederpaketen”, Konstruktion, pp.379-384, 1984
5. M.Ichimiya, T. Mizuno and M Konomura “A Promising Sodium-Coold Fast Reactor Concept and its R&D Plan“, Global 2003, November 16-20, New Orleans, 2003.