ABSTRACT
SOLEBELLO, NICHOLAS PAUL. Explaining the Gender Gap in Capital-Enhancing Website Use: The Effect of Male-Oriented Website Content. (Under the direction of Martha Crowley.)
by
Nicholas Paul Solebello
A thesis submitted to the Graduate Faculty of North Carolina State University
In partial fulfillment of the Requirements for the Degree of
Master of Science
Sociology and Anthropology
Raleigh, North Carolina 2009
APPROVED BY:
_______________________ _______________________
L. Richard Della Fave Sinikka Elliott
DEDICATION
I dedicate this thesis in honor of those I left behind.
BIOGRAPHY
ACKNOWLEDGEMENTS
The author began his Master of Science in Sociology in 2008 at North Carolina State University in Raleigh, North Carolina under the direction of Dr. Martha Crowley. It has been a wonderful experience and many people provided their support, advice, and guidance along the way. The author wishes to acknowledge these individuals.
First and foremost, the author most graciously thanks the vast amount of time Dr. Martha Crowley spent over the past year and a half helping to ensure the completion of this document. Her thoroughness and positive attitude have greatly contributed to the completion of this project and the author is indebted to her. The author also wishes to thank the
remaining two members of his committee: Dr. Sinikka Elliott and Dr. Rick Della Fave. Their comments, critiques, and enthusiasm were always helpful and the author is grateful for having both of them as a resource throughout this process. The author wishes to also thank Dr. Ted Greenstein for his initial comments on a very early draft of this thesis.
Special thanks must also be given to many of the upper-level graduate students in the department at NC State. While not exhaustive, the author wishes to thank Brad Ray, Mark Bodkin, Jon Brauer, and Julianne Payne for always allowing him to barge into their offices and ask for help. The author also wishes to thank the members of his cohort for going through this process alongside him and sharing in the struggle.
TABLE OF CONTENTS
LIST OF TABLES ... vi
EXPLAINING THE GENDER GAP IN CAPITAL- ENHANCING WEBSITE USE: THE EFFECT OF MALE-ORIENTED WEBSITE CONTENT ... 1
Digital Divides: Access and Use ... 2
Male-Oriented Websites and Capital-Enhancing Website Use ... 5
Data and Variables ... 8
Analytic Strategy ... 12
Findings ... 13
Discussion/Conclusion ... 15
References Cited ... 21
Tables …………... 23
APPENDICES ... 26
Appendix A. Description of Indices Created for the Analyses ... 27
LIST OF TABLES
Table 1 Means and standard deviations for all variables ... 23 Table 2 Unstandardized coefficients from OLS regressions of work
and family characteristics on frequency and variety of capital-
enhancing Internet use ... 24 Table 3 Unstandardized coefficients from OLS regressions of non-
capital-enhancing websites and control variables on frequency
Explaining the Gender Gap in Capital-Enhancing Website Use: The Effect of Male-Oriented Website Content
The literature analyzing capital-enhancing website use—websites with educational, financial, occupational or networking opportunities that help individuals cultivate human, cultural, and social capital—shows that men visit these websites more frequently than women (Hargittai and Hinnant 2008; Robinson, DiMaggio, and Hargittai 2003; Wasserman and Richmond Abbott 2005). Yet, few researchers offer reasons for why this gender gap in capital-enhancing website use exists. One possible explanation suggests that women’s greater household responsibilities affect the amount of time they spend on the Internet and direct women to use the Internet in stereotypically gendered ways (Kennedy, Wellman, and Klement 2003; Selwyn, Gorard and Furlong 2005). Indeed, women do tend to spend less time online than men (Kennedy et al. 2003). However, researchers have only applied this explanation to gender differences in general Internet use and not capital-enhancing website use specifically. In addition, this explanation does not address the effect that website content potentially has for enticing or deterring potential Internet users.
websites are male-oriented, or cater to the stereotypical interests of men, and provide men with a greater incentive to visit a wider variety of sites and visit these sites more frequently. In other words, male-oriented websites like sports, pornography, and games attract men to use the Internet more, which in turn, encourages them to use the Web in capital-enhancing ways. Indeed, my results from an analysis of three years of GSS data (2000-2004) indicate that the male-oriented content in Internet websites may play a large role in determining gender disparities in capital-enhancing website use. I conclude with a discussion of the implications for gender inequality in the digital age.
Digital Divides: Access and Use
buildings, at work, and in the home have closed this gap in recent years (DiMaggio et al. 2004; Ono and Zavodny 2003).
A growing literature now concentrates on “second-level” digital divides (Hargittai 2002), or areas where Internet inequality occurs in reference to how individuals make use of their computer/Internet access and the differing rewards they receive from these specific uses (see Dewan and Riggins 2006; Mossberger, Tolbert, and Stansbury 2003 for a review). In other words, researchers argue that there are qualitative differences in the benefits gained from computer and Internet use depending on whether an individual uses their computer for leisure activities like gaming, administrative duties like typing reports, or individual benefit through accessing information. Researchers argue that individuals benefit from Internet use the most by visiting “capital-enhancing websites” (DiMaggio et al. 2004; Hargittai 2002; Hargittai and Shafer 2006; Robinson et al. 2003; Wasserman and Richmond-Abbott 2005). These sites have educational, financial, networking, or employment information and provide individuals with more concrete skills, knowledge, and potential advantages than the leisurely or non-capital-enhancing uses of the Internet like playing games or looking up sports scores.
apply to the gender gap in capital-enhancing website use. Part one of Kennedy et al’s (2003) explanation for gender differences in Internet use emphasizes constraints on women’s time relative to men. Not surprisingly, research finds that the more time an individual spends online, the more frequent and diverse their use becomes (Kennedy et al. 2003). However, these researchers argue that gendered domestic work and the presence of children hinder women from spending more time online because these responsibilities tend to
disproportionately fall on women. Similarly, Selwyn et al.’s (2005) qualitative data support this argument, demonstrating that familial relationships and household chore structure shortchange women more than men with respect to amount of time spent on the Internet (and thus, frequency and variety of website use).
activities. Thus, this distinction between tools and toys may reflect men’s lower responsibility for household tasks and greater freedom to relax at home.
I extend previous research by applying these arguments to the gender gap in capital-enhancing website use. I investigate whether gendered household dynamics mediate the relationship between gender and frequency and variety of capital-enhancing website visitation. I use “number of children in the household” as a proxy for gendered household dynamics, following Kennedy et al. (2003). However, to further account for household situations placing gendered demands on women’s time, I also add indicators for marital and employment status.
H1: Men visit capital-enhancing websites more frequently than women. H2: Men visit a wider variety of capital-enhancing websites than women.
H3: Number of children in the household, marital status, and work status mediate the relationship between gender and frequency of capital-enhancing websites visited, and between gender and variety of capital-enhancing website visitation.
Male-Oriented Websites and Capital-Enhancing Website Use
While Kennedy et al.’s (2003) household division of labor explanation may help account for the gender gap in capital-enhancing website use, I present an alternative
Camacho, and Jackson (2004) suggest, minorities use the Internet less because the design and content of websites do not “speak to” their concerns. In essence, they claim that the Internet is a White, middle-class production. I argue that the Internet is a male production as well. In fact, research on technology use often addresses the possibility that socialization and the abundance of men in math, science, and computer-related fields steer women away from (and men towards) using technology like the Internet (e.g. Selwyn 2007; Stienstra 2002; Wyer 2001). For instance, Cooper (2006) finds that since most computer programmers are men, they make media like computer games with boys in mind. Likewise, I argue that when men devise Internet content, they also create it with other men in mind—attracting them to use the Internet more frequently and visit a wider variety of website content, including
capital-enhancing websites. Thus, I argue that this male-oriented website content is at least partially responsible for the gender gap in capital-enhancing website use.
why then, as research shows, do men still visit more capital-enhancing websites than
women? Could there be a link between the more superfluous, non-capital-enhancing uses of the Internet (specifically, sites oriented towards men like sports, pornography and games) and visiting capital-enhancing websites? Peng, Tsai, and Wu’s (2006) study may provide some evidence to confirm this link. As a follow up to Tsai and Lin’s (2004) study on perceptions of the Internet, Peng et al. (2006) find that individuals who perceive the Internet as a “tool” are less likely to use the Internet than individuals who view the Internet as a “toy.” They suggest that this difference occurs because people who perceive the Internet as a toy may have more positive attitudes towards Internet use in general. Thus, if men view the Internet more often as toys and they are more likely to use the Internet because of this, then the websites used for leisure (non-enhancing websites) may have an effect on capital-enhancing website use. Furthermore, I argue that these positive attitudes towards the Internet may result from non-capital-enhancing website content that often caters to the stereotypical interests of men, enticing men to use the Internet more frequently and to a greater extent.
I investigate this potential link and expand previous research by testing whether visiting non-enhancing websites affects an individual’s capital-enhancing website use. I argue that these non-capital-enhancing websites provide men with greater incentive to use the Internet more often and serve as a pathway to use the Internet in capital-enhancing ways.1 This places women at a disadvantage and suggests that Internet content itself is at least
1
partially responsible for the gender gap in capital-enhancing Internet use. Thus, I test whether non-capital-enhancing website visitation mediates the relationship between gender and frequency and variety of capital-enhancing website visitation. In other words, I examine whether using the Internet as a “toy” enhances an individual’s use of the Internet as a “tool.” Yet, I argue that it is not just non-capital-enhancing websites in general that attract a
disproportionate number of men to use the Internet. Instead, I suggest that the male-oriented, non-capital-enhancing websites provide incentive for men to use the Internet more. Thus, as an extension to my previous argument, I also separate the non-capital-enhancing websites into two categories: male-oriented and gender-neutral websites. I then test specifically if the male-oriented website content or gender-neutral content mediates the relationship between gender and capital-enhancing website use.
H4: Visiting non-capital-enhancing websites mediates the relationship between gender and frequency/variety of capital-enhancing website use.
H5: Visiting gender-neutral, non-capital-enhancing websites does not mediate the relationship between gender and frequency/variety of capital-enhancing website visitation.
H6: Visiting male-oriented, non-capital-enhancing websites mediates the relationship between gender and frequency/variety of capital-enhancing website visitation.
Data and Variables
(Robinson et al. 2003; Wasserman and Richmond-Abbott 2005), I employ the GSS data module on Internet use for this analysis. In addition to the two waves used in prior research, I take advantage of a more recent wave, pooling three years of the data together (2000, 2002, and 2004). Thus, this study consists of adults (eighteen and older) who use a computer and browse the Internet at least occasionally (N=1771). In other words, all of the respondents in this study use a computer either at home, at work, or some other place and visit sites in at least one of the website categories listed by the GSS at least once a month. Additionally, I deleted any respondent answering that he or she had computer access but never visited any of the twenty-one website categories listed in the GSS.
Dependent Variables
The GSS (2000-2004) includes data on exposure to 21 types of websites (e.g. science, finances, cooking, or personal sites). I combine respondents’ answers to these variables to form two indices for frequency and variety of capital-enhancing website visitation. The GSS module asks respondents how often they visited each type of website in the past month and gives four response options: 0, 1-2, 3-5, or more than 5. For the frequency of use index, I gave individuals answering in the 1-2 range a score of 1.5. If respondents chose 3-5, they received scores of 4 and those noting “5 or more” visits received scores of 7 (following previous research—Robinson et al. 2003).2 I then sum the scores from each website to give
2
each respondent a total frequency tally. Alternatively, for the variety index, if a respondent answered in the 1-2, 3-5, or more than 5 ranges, the respondent received a score of 1. Instead of measuring how many times an individual visits a particular type of website, a score of 1 represents simply having visited that type of site in the past month. Thus, I compute variety of capital-enhancing website visitation by summing these scores.
Measures of capital-enhancing website visitation used in previous studies vary somewhat. For example, Wasserman and Richmond-Abbott (2005), include government, news, politics, art, music, school, and work related sites. Robinson et al. (2003) include websites related to finances, school, education, work, news, government, politics, travel, and science. Lastly, Hargittai and Hinnant’s (2008) index includes government, politics, news, finances, health, and product information sites. My final index for capital-enhancing website use represents a combination of the indices from previous research in order to create a kind of standard for future investigators to follow. It consists of finances, science, school, education, work, news, government, art, politics, travel, and health websites.3 Thus, for the analyses, my frequency of capital-enhancing website visitation ranges from 1-77 and the variety of visitation index ranges from 1-8.
3
Independent Variables
The main independent variable is a dummy variable for male with females as the reference for all of the analyses performed. The pooled sample between the three GSS years consists of 1771 respondents, 51.6% of whom are women. Like previous research (Kennedy et al. 2003), I measure gendered family household responsibilities with a continuous variable for number of children in the household. I also use dummy variables for marital status that include married (reference), never married and no longer married individuals (divorced, separated, or widowed) and a dummy variable for part-time labor force status (full-time status as reference). Together, number of children, marital status, and workforce status may better represent the possible effects of gendered household dynamics on capital-enhancing Internet use than number of children alone.
non-enhancing websites ranges from 0-35 and represents humor, hobby, cooking, personal, and TV/movie websites. The complete non-capital-enhancing website index represents a combination of all the websites included in the male-oriented and gender-neutral indices. Thus, the non-capital-enhancing website index ranges from 0-56 (see Appendix Table A for lists of all the websites included in each index).
Controls
Men average close to 3 hours more time on the Internet per week than women (9.33 compared to 6.94). Therefore, I control for an individual’s logged hours spent on the Internet per week (mean = 6.89 hours). I also follow previous research (e.g. Robinson et al. 2003) controlling for age, race, and GSS year. Lastly, I control for each individual’s socio-economic index (SEI) which takes into account the income, education, and occupation of each respondent. In sum, Table 1 shows the means and standard deviations for the dependent, independent, and control variables.
Insert Table 1 Here
Analytic Strategy
SEI on the frequency and variety of capital-enhancing website visitation. Then, to investigate hypothesis 3, I add the variables representing potential gendered household characteristics (marital status, number of children, and workforce status) to each model.
Models for hypotheses 4, 5, and 6 test whether frequency of visiting non-capital-enhancing websites mediate the relationship between gender and capital-non-capital-enhancing website use even after controlling for hours on the Internet per week, GSS wave, race, marital status, number of children, and part-time work.4 Thus, I create a model that first tests whether visiting non-capital-enhancing websites mediates the relationship between gender and frequency and variety of capital-enhancing website use. I then estimate two more models that assesses whether frequency of visiting male-oriented or gender-neutral non-capital-enhancing websites mediate the relationship between gender and capital-non-capital-enhancing website visitation. By assessing both of these potential mediators, I test the argument that male-oriented websites mediate the relationship between gender and capital-enhancing website use and not just non-capital-enhancing website use in general.
Findings
Table 2 presents the unstandardized coefficients from the regression models for both frequency and variety of capital-enhancing website use on the gendered household
4
I checked correlation matrices, VIFs, and condition indices to test for multi-collinearity between the non-capital-enhancing indices and the non-capital-enhancing dependent variables but found no collinearity problems if I did not include age or SEI as controls. Note also that for the models testing hypotheses 4, 5, and 6, the
responsibility variables and controls. For variety and frequency of use, the models are nearly identical. In both baseline models, the coefficients for males are positive and significant and remain so even after the inclusion of the household responsibility variables. In fact, the household responsibility variables do little to increase the fit of the baseline model for frequency of capital-enhancing Internet use (R² increased from .2468 in Model 1 to .2482 in Model 2) and none of the variables (marital status, number of children, and workforce status) reach statistical significance. For variety of capital-enhancing Internet use, only the dummy variable for divorced, separated, and widowed individuals reaches significance but again, these variables do little to increase the model’s explanatory power. Thus, the gendered household responsibility variables do not mediate the relationship between gender and frequency or variety of capital-enhancing website use.5
Insert Table 2 here
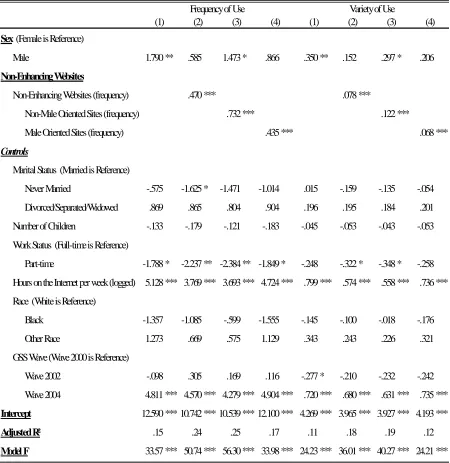
Table 3 presents unstandardized coefficients from the regression models for both frequency and variety of capital-enhancing website use on the variables for frequency of visiting non-capital-enhancing websites. In Model 1 for frequency of capital-enhancing website visitation, the coefficient for males is significant. Inserting the variable for
5
In separate analyses not shown here I tested for interaction effects between gender and the household
frequency of visiting non-capital-enhancing websites increases the R² in Model 2 by 60% and the dummy variable for male no longer reaches significance.
Model 3 for capital-enhancing website visitation introduces the variable for frequency of visiting the non-capital-enhancing, gender-neutral websites. This variable is significant and positive and greatly increases the R² from Model 1. However, the coefficient for males remains positive and significant. In Model 4, the coefficient for visiting the non-capital-enhancing, male-oriented sites is significant and positive. However, in contrast to the results in Model 3, the dummy variable for males becomes insignificant after inserting the variable for visiting the male-oriented websites.6 Including the variable for frequency of visiting male-oriented websites also increases the model fit by 9%. Finally, similar to the results from Table 2, the significance levels and directions of coefficients for variety and frequency of capital-enhancing website visitation in Table 3 show consistent results.
Insert Table 3 Here
Discussion/Conclusion
The Internet has grown rapidly over the past two decades and researchers continue to discuss the potential benefits of Internet use depending on how it is used. Previous research suggests that a large part of the advantages from Internet use stem from visiting
6
enhancing websites that help individuals create human, social, and cultural capital or find information that helps them on the job market. Despite these prospective benefits researchers consistently find that women lag behind men in overall frequency and variety of capital-enhancing website use (e.g. Robinson et al. 2003). This article extends the literature by testing two possible explanations for why this gender gap in capital-enhancing website use exists: 1) household responsibilities and 2) male-oriented website content. Ultimately, I demonstrate that male-oriented website content may be disproportionately attracting men to use the Internet more frequently and use it in capital-enhancing ways.
The final three hypotheses predicted the effects of visiting non-capital-enhancing websites on capital-enhancing website use. As expected, the variable for frequency of visiting non-capital-enhancing websites mediates the relationship between gender and
capital-enhancing website use. On further examination, the results from table 3 show that the variable for gender-neutral, non-enhancing websites does little to mediate the relationship between gender and frequency and variety of visiting capital-enhancing websites. Instead, as predicted in hypothesis 6, the variable for frequency of visiting male-oriented, non-capital-enhancing websites mediates the relationship between gender and capital-non-capital-enhancing website use. Thus, these results lend support to my arguments that it is not just non-enhancing content in general, but the male-oriented websites in particular that disproportionately target and attract men to use computers and the Internet, which in turn, contributes to their use of capital-enhancing websites. In other words, by enticing men to use the Internet as a “toy,” they eventually increase their use of the Internet as a “tool.”
While the results provide evidence for my arguments, I must note a few limitations of this study. First of all, the 21 websites provided by the GSS module do not exhaust the entire range of content found on the web. Notably absent are sites dealing with cars and the buying and selling of other products (e.g. ebay.com). Additionally, it could be argued that the GSS module misses important websites that we could stereotypically consider “female-oriented” like a more general variable for online shopping. Yet the general absence of
websites. Contrastingly, men have at least three male-oriented websites (sports,
pornography, and games). In any case, even adding more stereotypically female websites like shopping might prove to be a moot point considering prior research shows mixed results for women shopping online more often than men. In fact, Kennedy et al. (2003) find that men actually do more online shopping than women. Thus, including more stereotypically female-oriented websites may not change any of my results substantively.
Another limitation may stem from the creation of the index for frequency of capital-enhancing website use. As previously stated, I created both the frequency and variety index from 21 website variables measuring Internet use in the past month. First, considering that a month is a fairly long time, respondents may not be able to accurately assess their total amount of website visitation. Furthermore, since the answer categories are a series of ranges, knowing the respondent’s exact amount of time on the computer is impossible. I attempted to minimize these measurement issues by creating an index for variety of website use. The index for variety of use not only allows me to separate frequency from variety but it guards against some of these problems since the variety index simply measures having been to that website at least once. Furthermore, given the identical results across the indices (male-oriented websites mediate the relationship between gender and capital-enhancing website use), these measurement issues may not matter as much.
REFERENCES
Barbatsis, Gretchen, Melissa Camacho, and Linda Jackson. 2004. “Does It Speak to Me? Visual Aesthetics and the Digital Divide.” Visual Studies 1: 36-51.
Becker, Gary. 2007. “Health as Human Capital: Synthesis and Extensions.” Oxford Economic Papers 59: 379-410.
Bonfadelli, Heinz. 2002. “The Internet and Knowledge Gaps: A Theoretical and Empirical Investigation.” European Journal of Communication 17: 65-84.
Cooper, Joel. 2006. “The Digital Divide: The Special Case of Gender.” Journal of Computer Assisted Learning 22: 320-334.
Dewan, Sanjeev and Frederick J. Riggins. Forthcoming. “The Digital Divide: Current and Future Research Directions.” Journal of the Association for Information Systems. DiMaggio, Paul, Eszter Hargittai, Coral Celeste, and Steven Shafer. 2004. “Digital
inequality: From unequal access to differentiated use” Pp. 355-400 in Social Inequality, edited by K. Neckerman. New York: Russell Sage Foundation. Hargittai, Eszter. 2002. “Second Level Digital Divide: Differences in People’s Online
Skills.” First Monday, Retrieved September 10, 2008 (http://www.firstmonday.org/issues/issue7_4/hargittai/).
Hargittai, Eszter and A. Hinnant. 2008. “Digital Inequality – Differences in Young Adults’ Use of the Internet.” Communication Research 35: 602-621.
Hargittai, Eszter and Steven Shafer. 2006. “Differences in Actual and Perceived Online Skills: The Role of Gender.” Social Science Quarterly 87: 432-448.
Kennedy, Tracy, Barry Wellman, and Kristine Klement. 2003. “Gendering the Digital Divide.” IT & Society 1: 72-96.
Mossberger, Karen, Caroline Tolbert and Mary Stansbury. 2003. Virtual Inequality: Beyond the Digital Divide. Washington, DC: Georgetown University Press.
_______. 2003. “An Expanding Digital Divide? Panel Dynamics in the General Social Survey.” IT & Society 1: 14-26.
Ono, Hiroshi and Madeline Zavodny. 2003. “Gender and the Internet.” Social Science Quarterly 84: 111-121.
Robinson, John, Alan Neustadtl and Meyer Kestnbaum. 2002. “The Online “Diversity Divide”: Public Opinion Differences Among Internet Users and Nonusers.” IT & Society 1: 284-302.
Robinson, John, Paul DiMaggio and Eszter Hargittai. 2003. “New Social Survey Perspectives on the Digital Divide.” IT & Society 1: 1-22.
Selwyn, Neil. 2007. “Hi-Tech = Guy-tech? An Exploration of Undergraduate Students’ Gendered Perceptions of Information and Communication Technologies.” Sex Roles
56: 525-536.
Selwyn, Neil, Stephen Gorard, and John Furlong. 2005. “Whose Internet is it Anyway? Exploring Adults’ (Non)Use of the Internet in Everyday Life,” European Journal of Communication 20: 5-26.
Stienstra, Deborah. 2002. “Gender, Women’s Organizing, and the Internet.” Pp. 187-205 in
Technology, Development, and Democracy: International Conflict and Cooperation in the Information Age, edited by J.E. Allison. Albany, NY: SUNY Press.
Tsai, Chin-Chung and Chia-Ching Lin. 2004. “Taiwanese adolescents’ perceptions and attitudes regarding the Internet: Exploring gender differences.” Adolescence 39: 725– 734.
Wasserman, Ira and Marie Richmond-Abbott. 2005. “Gender and the Internet: Causes of Variation in Access, Level, and Scope of Use.” Social Science Quarterly 86: 252-270.
West, Candace and Don Zimmerman. 1987. “Doing Gender.” Gender and Society 1: 125-52.
TABLES
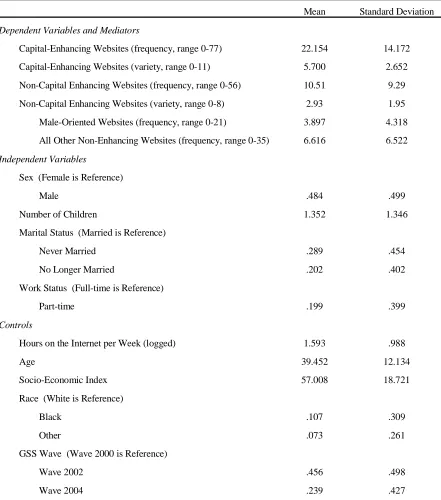
Table 1: Means and Standard Deviations for All Variables
Dependent Variables and Mediators
Capital-Enhancing Websites (frequency, range 0-77)
Capital-Enhancing Websites (variety, range 0-11)
Non-Capital Enhancing Websites (frequency, range 0-56)
Non-Capital Enhancing Websites (variety, range 0-8)
Male-Oriented Websites (frequency, range 0-21)
All Other Non-Enhancing Websites (frequency, range 0-35)
Independent Variables
Sex (Female is Reference)
Male
Number of Children
Marital Status (Married is Reference)
Never Married
No Longer Married
Work Status (Full-time is Reference)
Part-time
Controls
Hours on the Internet per Week (logged)
Age
Socio-Economic Index
Race (White is Reference)
Black
Other
GSS Wave (Wave 2000 is Reference)
Wave 2002
Wave 2004 .239 .427
.456 .498 .073 .261 .107 .309 57.008 18.721 39.452 12.134 1.593 .988 .199 .399 .202 .402 .289 .454 1.352 1.346 .484 .499 6.616 6.522 3.897 4.318 10.51 9.29 2.93 1.95 5.700 2.652 22.154 14.172
Table 2: Unstandardized Coefficients from OLS Regressions of Work and Family Characteristics on Frequency and Variety of Capital-Enhancing Internet Use
Sex (Female is Reference)
Male 1.680 ** 1.709 ** .335 ** .345 **
Work and Family Charateristics Marital Status (Married is Reference)
Divorced/Separated/Widowed 1.169 .267
Never Married .415 .153
Number of Children .187 .021
Work Status (Full-time is Reference)
Part-time -.755 -.076
Controls
Hours on the Internet Per Week (log) 5.007 *** 4.980 *** .781 *** .772 ***
Age -.000 -.016 -.006 -.007
Socio-Economic Index .198 *** .199 *** .034 *** .034 ***
Race (White is Reference)
Black -.810 -1.064 -.068 -.112
Other Race 1.082 1.075 .292 .289
GSS Wave (Wave 2000 is Reference)
Wave 2002 .332 .345 -.204 -.201
Wave 2004 4.628 *** 4.748 *** .694 *** .716 ***
Intercept .846 .951 2.516 *** 2.441 ***
Adjusted R² .22 .22 .17 .16
Model F 63.62 *** 42.69 *** 46.32 *** 31.16 ***
Note: N =1771. * (p<.05), ** (p<.01), *** (p<.0001), two-tailed test.
Frequency of Use Variety of Use
Table 3: Unstandardized Coefficients from OLS Regressions of Non-Capital-Enhancing Websites and Control Variables on Frequency and Variety of Capital-Enhancing Internet Use
Sex (Female is Reference)
Male 1.790 ** .585 1.473 * .866 .350 ** .152 .297 * .206
Non-Enhancing Websites
Non-Enhancing Websites (frequency) .470 *** .078 ***
Non-Male Oriented Sites (frequency) .732 *** .122 ***
Male Oriented Sites (frequency) .435 *** .068 ***
Controls
Marital Status (Married is Reference)
Never Married -.575 -1.625 * -1.471 -1.014 .015 -.159 -.135 -.054 Divorced/Separated/Widowed .869 .865 .804 .904 .196 .195 .184 .201 Number of Children -.133 -.179 -.121 -.183 -.045 -.053 -.043 -.053 Work Status (Full-time is Reference)
Part-time -1.788 * -2.237 ** -2.384 ** -1.849 * -.248 -.322 * -.348 * -.258 Hours on the Internet per week (logged) 5.128 *** 3.769 *** 3.693 *** 4.724 *** .799 *** .574 *** .558 *** .736 *** Race (White is Reference)
Black -1.357 -1.085 -.599 -1.555 -.145 -.100 -.018 -.176 Other Race 1.273 .669 .575 1.129 .343 .243 .226 .321 GSS Wave (Wave 2000 is Reference)
Wave 2002 -.098 .305 .169 .116 -.277 * -.210 -.232 -.242 Wave 2004 4.811 *** 4.570 *** 4.279 *** 4.904 *** .720 *** .680 *** .631 *** .735 ***
Intercept 12.590 *** 10.742 *** 10.539 *** 12.100 *** 4.269 *** 3.965 *** 3.927 *** 4.193 ***
Adjusted R² .15 .24 .25 .17 .11 .18 .19 .12
Model F 33.57 *** 50.74 *** 56.30 *** 33.98 *** 24.23 *** 36.01 *** 40.27 *** 24.21 *** Note: N =1771. * (p<.05), ** (p<.01), *** (p<.0001), two-tailed test.
Frequency of Use Variety of Use
Appendix Table A: Description of Indices Created in the Analyses
Capital-Enhancing Websites
Finances, School, Education, Work, News, Government, Politics, Art, Science, Travel, and Health sites
Non-Capital-Enhancing Websites
Male-Oriented Websites
Sports, Pornography, and Games sites
All Other Non-Capital-Enhancing Websites
A p p e n d ix T a b le B : U n s t a n d a r d iz e d C o e f fic ie n ts fr o m O L S R e g r e s s io n s o f G e n d e r a n d O t h e r C o n tr o ls o n F r e q u e n c y o f N o n - C a p ita l-E n h a n c in g W e b s ite U s e
S e x (F e m a le is R e fe r e n c e )
M a le 2 .7 6 6 * * *
C o n t r o ls
W o r k a n d F a m ily C h a r a c te r is tic s
M a r ita l S ta tu s (M a rr ie d is R e fe r e n c e )
N e v e r M a r rie d 1 .8 4 5 * *
D iv o rc e d /S e p a r a te d /W id o w e d 1 .2 5 9 *
N u m b e r o f C h ild re n .2 6 0
W o rk S ta tu s ( F u ll-tim e is R e fe r e n c e )
P a r t-tim e .5 3 1
D e m o g r a p h ic s a n d O th e r C o n tr o ls
H o u r s o n th e I n te rn e t P e r W e e k (lo g ) 2 .9 2 1 * * *
A g e -.0 9 7 * * *
S o c io -E c o n o m ic In d e x -.0 6 0 * * *
R a c e (W h ite is R e fe r e n c e )
B la c k -1 .0 6 1
O th e r .9 1 8
G S S W a v e (W a v e 2 0 0 0 is R e fe r e n c e )
W a v e 2 0 0 2 -1 .0 1 3 *
W a v e 2 0 0 4 .6 8 3
I n te r c e p t 1 1 .2 0 8 * * *
A d j u s t e d R² . 1 8
M o d e l F 3 2 . 3 5 * * *
N o te : N = 1 7 7 1 . * ( p < .0 5 ), * * (p < .0 1 ), * * * (p < .0 0 0 1 ) , tw o -ta ile d t e s ts