University of Windsor University of Windsor
Scholarship at UWindsor
Scholarship at UWindsor
Electronic Theses and Dissertations Theses, Dissertations, and Major Papers
2017
Intensive sampling and comparison of methods in detection of
Intensive sampling and comparison of methods in detection of
non-indigenous species
non-indigenous species
Sharon Lavigne University of Windsor
Follow this and additional works at: https://scholar.uwindsor.ca/etd
Recommended Citation Recommended Citation
Lavigne, Sharon, "Intensive sampling and comparison of methods in detection of non-indigenous species" (2017). Electronic Theses and Dissertations. 7372.
https://scholar.uwindsor.ca/etd/7372
This online database contains the full-text of PhD dissertations and Masters’ theses of University of Windsor students from 1954 forward. These documents are made available for personal study and research purposes only, in accordance with the Canadian Copyright Act and the Creative Commons license—CC BY-NC-ND (Attribution, Non-Commercial, No Derivative Works). Under this license, works must always be attributed to the copyright holder (original author), cannot be used for any commercial purposes, and may not be altered. Any other use would require the permission of the copyright holder. Students may inquire about withdrawing their dissertation and/or thesis from this database. For additional inquiries, please contact the repository administrator via email
INTENSIVE SAMPLING AND COMPARISON OF METHODS IN DETECTION OF
NON-INDIGENOUS SPECIES
by
Sharon Lavigne
A Thesis
Submitted to the Faculty of Graduate Studies
through the Great Lakes Institute for Environmental Research
in Partial Fulfillment of the Requirements for
the Degree of Master of Science
at the University of Windsor
Windsor, Ontario, Canada
2018
INTENSIVE SAMPLING AND COMPARISON OF METHODS IN DETECTION OF
NON-INDIGENOUS SPECIES
by Sharon Lavigne
APPROVED BY:
______________________________________________ A. Fisk
Department of Earth and Environmental Sciences
______________________________________________ G. Haffner
Great Lakes Institute for Environmental Research
______________________________________________ H. MacIsaac, Advisor
Great Lakes Institute for Environmental Research
iii DECLARATION OF ORIGINALITY
I hereby certify that I am the sole author of this thesis and that no part of this
thesis has been published or submitted for publication.
I certify that, to the best of my knowledge, my thesis does not infringe upon
anyone’s copyright nor violate any proprietary rights and that any ideas, techniques,
quotations, or any other material from the work of other people included in my thesis,
published or otherwise, are fully acknowledged in accordance with the standard
referencing practices. Furthermore, to the extent that I have included copyrighted
material that surpasses the bounds of fair dealing within the meaning of the Canada
Copyright Act, I certify that I have obtained a written permission from the copyright
owner(s) to include such material(s) in my thesis and have included copies of such
copyright clearances to my appendix.
I declare that this is a true copy of my thesis, including any final revisions, as
approved by my thesis committee and the Graduate Studies office, and that this thesis has
iv ABSTRACT
Non-indigenous species (NIS) newly introduced to a novel environment usually
experience a lag time before the population grows to a detectable level. Management of
the NIS during the lag phase provides a better opportunity for eradication than at later
stages when the population is larger and established. However, low population density
limits detection by conventional methods. Here I tested the effect of intensive sampling
on a population of a newly introduced NIS, zebra mussels (Dreissena polymorpha), in
Lake Winnipeg. Zebra mussel presence can be determined by the presence of their larvae
(veligers). I hypothesized that veligers will be detected in the south basin where they
were previously reported, but not in the north basin where they were never reported. I
also compared detection success as well as the cost and time of three methods of analysis
of plankton samples: cross-polarized light microscopy (CPLM), flow cytometry and
microscopy (FlowCAM), and environmental DNA (eDNA). I detected veligers
throughout Lake Winnipeg, even in the north basin, with varying abundances. As
expected, veliger abundance was highest in the south, and very low in the north.
Abundance and prevalence were significantly lower with FlowCAM and eDNA analysis,
indicating lower success when compared to CPLM. FlowCAM is the most expensive
method used, while eDNA is the least expensive. eDNA represents the cheapest and
fastest method, and combined with intensive sampling, is the best candidate for wide
v DEDICATION
vi ACKNOWLEDGEMENTS
I am grateful for the support of my supervisor Dr. Hugh MacIsaac throughout this
thesis. I would like to thank my committee members, Dr. Doug Haffner and Dr. Aaron
Fisk, for their interest in my research. Thank you to Dr. Dan Heath for the access to his
lab and equipment. The FlowCAM used in my thesis was generously lent to us by Dr.
Charles Ramcharan of Laurentian University.
Dr. Mattias Johansson has helped tremendously with field work and data analysis.
All my samples were collected with the capable field assistance of Colin Van Overdijk.
I had a lot of help with the analysis of the substantial amounts of samples: Sarah
Jayne Collins, Joelle Pecz, Jezel Gicole, Taylor Haludek, and Ian MacIsaac.
Thank you to my lab members Marco, Keara, Deanna, Steve, Samir, Emma, Josh,
and Dylan for answering my never-ending barrage of questions.
My office-mates Clare, Karista, Celine, Danielle, Sarah Lehnert, and Natalie have
been great support during this project.
Thank you to Alice Grgicak-Mannion for GIS support and the creation of the map
of my sampling sites.
Special thanks to Mary-Lou and Christine for the help and moral support.
This study was funded by NSERC CREATE Great Lakes to Dr. Paul Sibley,
vii TABLE OF CONTENTS
DECLARATION OF ORIGINALITY iii
ABSTRACT iv
DEDICATION v
ACKNOWLEDGEMENTS vi
LIST OF TABLES viii
LIST OF FIGURES ix
INTRODUCTION 1
METHODS 10
RESULTS 15
DISCUSSION 18
CONCLUSION 24
REFERENCES 39
viii LIST OF TABLES
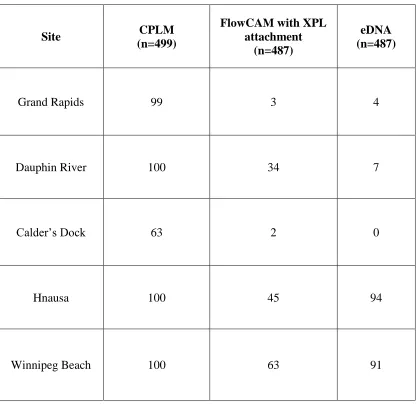
Table 1: Prevalence (%) of veliger detection in plankton samples using three methods of
analysis for all five sites sampled in Lake Winnipeg. 26
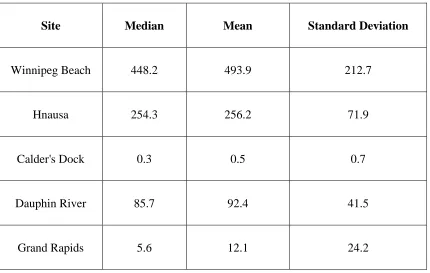
Table 2: Median and means of microscopic abundance of veligers for five sites in Lake
Winnipeg. 27
ix LIST OF FIGURES
Figure 1: Stepwise progression of a successful biological invasion. Adapted from
Blackburn et al. (2011) ...29
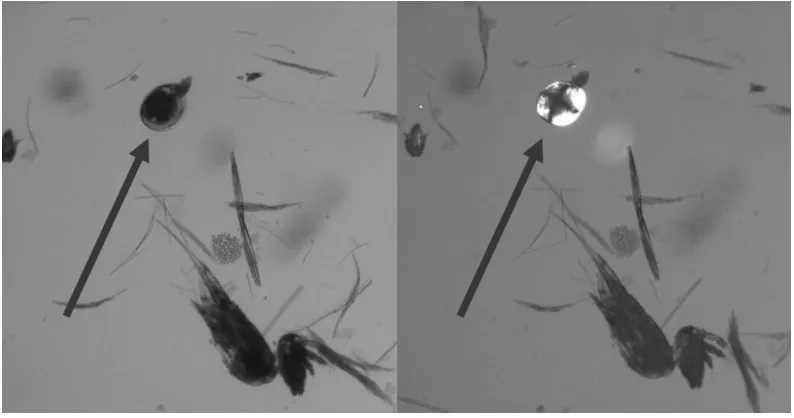
Figure 2: Images of plankton under transmitted light and cross-polarized light ...30
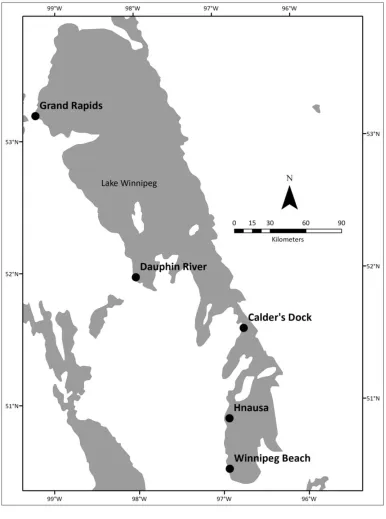
Figure 3: Sampling sites on Lake Winnipeg, Manitoba ...31
Figure 4: Box-and-whiskers plot displaying distribution of data: median, 50% of data
closest to median (box), and minimum and maximum (whiskers) of veliger
abundance obtained using cross- polarized microscopy at each site...32
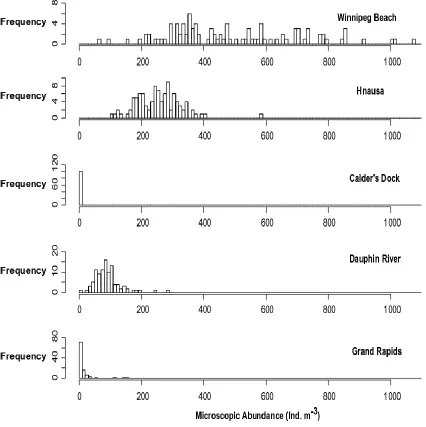
Figure 5: Distribution of microscopic-based, veliger abundance at the five sampled sites33
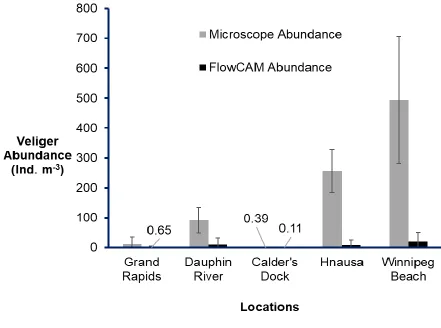
Figure 6: Comparison of veliger abundance from FlowCAM and microscopy. ...34
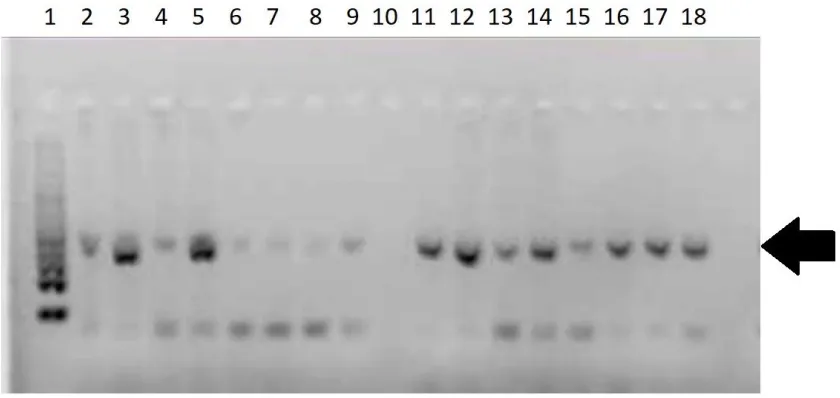
Figure 7: Gel image showing bands for positive detection of zebra mussel …. ...35
Figure 8: Comparison of prevalence of zebra mussels in samples analyzed using three
methods ...36
Figure 9: Detection success using FlowCAM (3ml) and eDNA (1mL) as a function of
microscope-based abundance ...37
Figure 10: Probability of detecting at least one zebra mussel veliger using three different
methods (FlowCAM, eDNA and CPLM) in analysis of 3mL subsamples of
1 INTRODUCTION
Non-indigenous species (NIS) are species moved from their native ranges into new
regions, typically through anthropogenic processes (Ricciardi 2007). The rate of
movement of NIS across the globe is increasing due to human activities, such as trade
and travel (Ricciardi 2007; Hulme 2009). While most NIS do not adversely impact
environments they are introduced into, some species can cause economic and/or
ecological harm. NIS that cause harm are termed invasive species (Lockwood et al. 2013;
Ricciardi and Cohen 2007).
Invasive species have impacted ecosystems and economies of many countries
(Vitousek et al. 1997; Horan and Lupi 2010; Havel et al. 2015). In the United States,
invasive species have been estimated to cost almost $120 billion per year in damages,
losses and control (Pimentel et al. 2005). Invasive species prey on native species,
compete with them for food and space, or parasitize or infect them (Nalepa et al. 1996;
Courchamp et al. 2003; Pimentel et al. 2005; Vila et al. 2011). Invasive species have also
been identified as the highest impact stressor in the Laurentian Great Lakes based on
expert opinion (Smith et al. 2015).
Only a fraction of NIS will, however, become invasive (Williamson and Fitter
1996). Successful invasions happen in a step-wise fashion, overcoming barriers at each
step (see Figure 1; Blackburn et al. 2011). To become a successful invader, a species
must undergo uptake at the donor region, survive transport, and be released into the
recipient region. As an example, the round goby (Neogobius melanostomus) was most
likely picked up in ships’ ballast from Eurasia (uptake), transported to North America,
2
(release) (Charlebois et al. 2001). To establish a reproducing population, the NIS needs to
survive and reproduce. In the case of the round goby, the species established populations
Lake Saint Clair, preying on zebra mussels - a species with which they co-evolved (Ray
and Corkum 1997; Clapp et al. 2001; Djuricich and Janssen 2001) - and other species. In
the final step of many invasions, the now-established NIS will spread from the site of
original release to other locations in the recipient region (Lockwood et al. 2013). The
round goby has since spread throughout the Great Lakes (Kornis et al. 2012).
Species that are introduced in one region can fail to invade in another (Zenni and
Nuñez 2013). Conditions in some environments may be incompatible with the growth
requirements of the introduced species. For example, ocean currents were detrimental to
larval deposition of introduced fishes (Johnston and Purkis 2016). Plants that thrive in dry
areas and nutrient-poor soil could fail to invade areas with waterlogged soil and high
nutrient levels (Closset-Kopp et al. 2011). The Chinese mitten crab (Eriocheir sinensis)
requires water with at least 15% salinity to reproduce. This means that Chinese mitten
crabs are unable to establish in freshwater systems that are far from salt or brackish water
(Herborg et al. 2007). Invasion failure can also occur when the introduced, dioecious
species cannot find a mate at low population abundance (Allee effect), and thus is unable
to establish a reproducing population (Contarini et al. 2009).
In cases of successful invasions, management measures can become costly, so
eradication of an invasive species before it establishes or spreads is preferable (Leung et
al. 2002; Mehta et al. 2007). Many species exhibit a lag phase after introduction - where
their population remains low - before increasing in size (Kowarik 1995; Crooks and
3
invasive species can be most effective during this lag phase (Mehta et al. 2007). For
example, Caulerpa taxiflora, a filamentous alga that has colonized many areas of
Mediterranean Sea (Meinesz and Hesse 1991), was discovered off the coast of California
in 2000 (Jousson et al. 2000). A rapid response team was assembled and successfully
exterminated the small populations before they could expand (Williams and Schroeder
2004; Anderson 2005).
While low population levels during lag phase can facilitate the eradication of NIS,
it also makes it difficult to detect individuals (Gu and Swihart 2004). Increasing sampling
intensity can increase the chances of successful detection during lag phase, and reduce
the possibility of false negatives in detection (Harvey et al. 2009; Counihan and Bollens
2017). Detection accuracy – the ability to successfully determine true presence or
absence (Václavík and Meentemeyer 2009) – of NIS is important for rapid response
programs. Accurate early detection of a NIS can potentially reduce unwanted impacts of
that species via successful eradication programs (Bogich et al. 2008; vander Zanden et al.
2010; Horan and Lupi 2010). Detection sensitivity – probability that a species is correctly
identified when present – is crucial for the effective eradication and control of NIS
(Hayes et al. 2005).
Importantly, we must be aware of, and attempt to reduce, Type I and Type II errors
(Banerjee et al. 2009). Type I errors are false positives, where a species not present in the
area/sample is reported as present. False positives are serious issues as efforts can be
wasted seeking to validate presence of the species, or in attempts to eradicate it (Wilson
et al. 2016). If eradication programs are initiated because of false positive detection of an
4
control zebra mussels could affect non-target aquatic species (Cope et al. 1997; Fernald
and Watson 2014). Type II errors refer to false negatives, where we fail to detect a
species that is present. False negative errors in the detection of invasive species are
particularly problematic as they allow species present at low abundance to remain
undetected (MacIsaac et al. 2002; Hayes et al. 2005; Fitzpatrick et al. 2009). A false
negative could lead to failure to deploy eradication or control efforts in sufficient time to
effectively manage the species (Myers et al. 2000).
Zebra mussels and quagga mussels, Dreissena rostriformis bugensis, are invasive
species introduced to Laurentian Great Lakes in the mid- to late 1980s (Mills et al. 1993;
Carlton 2008). These aquatic bivalves bio-foul submerged structures and clog pipes that
draw water from infested waterways (Prescott et al. 2014). Presence of dreissenid
mussels can cause an increase in the running costs of water treatment and power
generation plants (Sarrouh and Ramadan 1994; Pimentel et al. 2005; Connelly et al.
2007; Prescott et al. 2014). The mussels have also caused declines in populations of
native unionid mussels in the Great Lakes (Nalepa et al. 1996; Zanatta et al. 2015). In this
study, I focused on zebra mussels. Zebra mussels reproduce by releasing gametes into
the water when temperature exceeds 12°C (Borcherding 1991). Zebra mussel larvae,
called veligers, form after external fertilization, and stay suspended in the water for 10 to
15 days or more (depending on temperature) before settling onto hard substrate (Hebert et
al. 1989). Veligers can be used as an indicator of the presence of dreissenid mussels in
the water (Johnson 1995; Frischer et al. 2005).
While eradication of dreissenids from a large lake is infeasible (Nalepa 2014), early
5
prevent fouling by installing antifouling materials on submerged surfaces. There are also
treatments such as dissolved air flotation, ozonation, deep bed biological activated
carbon, chlorine and UV to prevent zebra mussels from entering drinking water reservoir,
thereby preventing further cost downstream of removal or mussels from the reservoir
(Chakraborti et al. 2014). Early detection of zebra mussels allows decisions to be made to
curb the downstream cost of dealing with the species (Hosler 2011).
Lake Winnipeg is the tenth largest freshwater lake in the world by surface area
(Wassenaar and Rao 2012). Located in Manitoba, the lake is divided into two basins,
connected via a narrow channel. At a volume of 294km3, Lake Winnipeg is smaller by
volume as well as shallower compared to the Laurentian Great Lakes, and has little or no
summer stratification (Leon et al. 2012; Zhao et al. 2012).
Even though geographically isolated from the Laurentian Great Lakes, Lake
Winnipeg is not invulnerable to invasive species. At least three NIS that can affect food
webs – rainbow smelt (Osmerus mordax), white bass (Morone chrysops), and spiny water
flea (Bythotrephes longimanus) – invaded Lake Winnipeg previously (Hobson et al.
2012; Sheppard et al. 2012; Hann and Salki 2017). There are historically 11 native
unionid mussels in Lake Winnipeg (Pip 2006), all of which produce glochidia larvae
(which attach to fish), rather than free-floating veligers (Coker and Surber 1911; Trdan
1981), thus any veligers present in plankton samples must be either quagga and/or zebra
mussels.
Zebra mussels were detected in the Red River, North Dakota, which flows into
Lake Winnipeg, in 2009 (Wassenaar and Rao 2012). In 2013, the species was found in
6
lake by boaters moving bio-fouled vessels overland (Janusz 2014) or via advective flow
from the Red River (L. Janusz, pers. comm.). Periodic sampling by the Manitoba Aquatic
Invasive Species Program, Fisheries Branch, Conservation and Water Stewardship
reported that there were no zebra mussels detected in the in the north basin of Lake
Winnipeg before October 2015 (CWS 2015). The reported presence of zebra mussels in
the south basin but seeming absence in the north basin provided an opportunity to test
detection limit for a variety of different methods of sampling and analysis.
When a species is present in very small numbers, large efforts are needed to detect
them. This can be a problem if resources are limited. That is why we must make detection
sensitivity (ability to detected species at very low abundance) by increasing sampling
effort and efficiency (Hoffman et al. 2016). While intensive sampling can increase the
chance of capturing an individual of a species that is present in low abundance, the
method of sample analysis can affect detection success (Trebitz et al. 2017;
Stanislawczyk et al. 2017).
New methods are always emerging to improve success and accuracy of NIS
detection. For example, use of light-based traps instead of plankton tows increased the
chance of capturing the mysid Hemimysis anomala (Brown et al. 2017). Invasive plants
can be detected and mapped in shorter time using remote sensing imagery than
conventional field surveys (Bradley 2014). Use of environmental DNA for species
detection is a relatively new technique that appears to be successful for many species
(Taberlet et al. 2012). Sampling of 16 marine and freshwater ports in Canada showed the
ability of DNA detection in identifying multiple NIS that have been previously detected
7
In this study, I explored effectiveness of three methods of sample analysis for zebra
mussel detection, with a focus on veliger larvae. The veliger is the planktotrophic stage of
development, lasting from 10 to 90 days (Reed et al. 1998). This stage of development
allows dispersal via currents or movement by water moved by boaters (Padilla et al.
1996). Veliger abundance is a function of adult zebra mussel abundance, fecundity, and
water temperature (Reed et al. 1998). The first method of analysis was CPLM. The
birefringent properties of veligers’ shells cause them to show up brightly lit under
cross-polarized light (Johnson 1995; Figure 2), and veligers can be efficiently enumerated
using this approach. Prior to development of cross-polarized light, veligers were
identified under microscope by taxonomists, which, in addition to being tedious and time
consuming (Becerra and Valdecasas 2004), can be difficult because the animals appear
visually similar to ostracods (Marsden 1991). Because it is much easier than taxonomic
identification, CPLM is widely used for veliger detection in monitoring and surveillance
programs (Claudi and Mackie 2010; Hosler 2011; Evans et al. 2011).
The second method of analysis was use of a semi-automated particle visual
analyzer (Culverhouse et al. 2006). Two popular systems are Flow Cytometer And
Microscope (FlowCAM) (Hosler 2011; Day et al. 2012) and Zooscan (Gorsky et al.
2010). I used FlowCAM for plankton analysis in this thesis. FlowCAM captures images
of microscopic particles as they pass through the flow cell (Fluid Imaging Technologies
2011). The images were stored and can be sorted by variables such as size and shape.
Plankton imaging systems were developed to reduce plankton processing time and can
overcome the problem of difficult taxonomic identification and human error from fatigue
8
different applications e.g., monitoring the change of plankton community structure in the
face of climate change (Graham and Camp 2017), study of protein structures in drugs
prepared for pharmaceutical applications (Zölls et al. 2013), detection of grazing
protozoa in algae cultured for biofuels (Day et al. 2012), and identification of
metazooplankton (Le Bourg et al. 2015). FlowCAM has also been used to identify red
tide cells which are associated with harmful algal blooms, as it requires less time and
effort than conventional microscopy (Buskey and Hyatt 2006). FlowCAM differed little
with microscope in analyzing plankton samples (Alvarez et al. 2013). Fitted with a
cross-polarizing filter (XPL attachment), the FlowCAM can be enhanced for veliger detection
(Spaulding 2009). The XPL attachment works the same way as the cross-polarizing
lenses on microscopes; it will cause veligers to shine brightly against the background,
making them easier to see. Highly-visible, birefringent veligers increase the chance of
capture by FlowCAM software.
Finally, I used a molecular method of detection by polymerase chain reaction
(PCR), amplifying environmental DNA (eDNA) (Ram et al. 2011; Egan et al. 2015).
eDNA is DNA shed from organisms into the environment, which can then be isolated and
analysed (Rees et al. 2014). Detection by eDNA makes use of species-specific primers to
amplify the DNA of target species, allowing cross-referencing against established online
databases for rapid identification.eDNA can be used for the identification of species in
microbial communities (Venter et al. 2004), as well as macro-organisms (Ficetola et al.
2008). It has been used to detect many different organisms: fish, amphibians, mammals
and reptiles (Rees et al. 2014). Increasing the number of field replicates in eDNA
9
2015). Mitochondrial DNA (mtDNA) is a specific fragment of DNA often used in the
detection of species. mtDNA is present in higher copies than nuclear DNA because
mitochondria are numerous within a cell. Both mtDNA, 16S rRNA and cytochrome
oxidase I gene (COI) have been used for detection of zebra mussels (Egan et al. 2015;
Ardura et al. 2017). Most eDNA assays test water samples but I increased the chance of
detection by testing plankton samples (Peñarrubia et al. 2016; Ardura et al. 2017). eDNA
detection has been successfully optimized for detection of another invasive bivalve
golden mussel (Limnoperna fortunei) in water from both field-collected and laboratory
tanks with mussels (Xia et al. 2017). Methods of detecting eDNA vary; earlier research
used conventional PCR (Jerde et al., 2011), while more recently there has been a shift
toward real-time PCR (RT-PCR) or quantitative (qPCR) (Rees et al., 2014) and
next-generation sequencing (Shokralla et al., 2012).
I hypothesized that I would be able to detect the presence of zebra mussels in the
south basin where they have been reported, but not in the north where the species is not
known to occur. I tested this hypothesis by comprehensively sampling both north and
south basins and analyzed samples using all three methods. I hypothesized that
FlowCAM equipped with cross-polarizing lenses will perform better than CPLM in
detecting veligers in samples (Stanislawczyk et al. 2017). I also hypothesized that eDNA
detection will detect zebra mussels in the samples better than either of the alternatives
(Egan et al. 2015). I tested these hypotheses by analyzing the samples obtained from
10 METHODS
I sampled Lake Winnipeg, Manitoba intensively to increase veliger detection
success (Marsden 1991; Counihan and Bollens 2017). I sampled the lake in July at the
presumed time of zebra mussel spawning season to ensure the capture of veligers. I
sampled five sites from 23 July to 27 July 2015 in the following order: Winnipeg Beach,
Grand Rapids, Dauphin River, Calder’s Dock and Hnausa (Map shown in Figure 3;
coordinates provided in supplementary materials). The five sites were selected to
determine the distribution of veligers population from south to north of the lake. Samples
were collected with vertical hauls using plankton nets (63µm mesh, 50cm diameter
mouth and 150cm length). New nets were used at each site to prevent
cross-contamination between sites. To decrease the chance of Type II error of missing a veliger
that is present in the lake water, I sampled intensively at each site. At each site, 100
plankton tows were made as the boat drifted with the current, yielding a total of 500
samples. The GPS coordinates of the start and end points for each sampling location were
recorded. Vertical hauls were collected from just above lake bottom (5.5m to 15m
depths) and hauled back up using a hand over hand motion at a rate of about 0.5m/second
(Marsden 1991). Depth of each haul was recorded. After each haul, the net was rinsed to
limit contamination between hauls. The boat bilge was drained and dried between each
site to prevent contamination. All samples were immediately concentrated in a 40µm
sieve then preserved in 95% ethanol and stored at ambient temperature until processing in
the laboratory.
In the laboratory, all samples were filtered through a sieve with 300µm Nitex mesh
11
are between 200-250µm (Hebert et al. 1989), so filtering out the >300um fraction of
plankton in the samples should not reduce veliger abundance in samples while making
detection of the species easier (Johnson 1995). To prevent false positives and
cross-contamination, sieves were washed and soaked in five percent bleach solution for five
minutes between samples. Filtered samples were resuspended in 50mL of 95% ethanol
and stored in 50mL polypropylene conical tubes. All samples collected were then
analyzed using methods described below for optimal veliger/mussel detection.
Cross-polarized light microscopy
Following (Johnson 1995), I used cross-polarized lenses on a stereomicroscope to
detect veligers in samples. Filtered whole samples were studied under cross-polarized
light on a Leica transmitting light stereomicroscope at 16× magnification. Polarizing
lenses were custom-made by Joseph F.J. Zeman, A-Z Microscope Limited (291
Cheapside Street, London, Ontario, N6A 2A3). Because plastic counting trays are also
birefringent and interfered with veliger visualization, glass petri dishes were used.
Usually, all taxa in a sample are identified and a rare-fraction curve is formed to establish
species richness (Counihan and Bollens 2017). However, to increase efficiency, I only
identified and counted Dreissena veligers. Numbers of veligers were recorded using
laboratory tally counters.
Abundance of veligers in samples was calculated using equations 1 and 2.
Equation 1
Am = microscopic abundance (Ind. m-3), cm = total counts from microscopy (Ind.),
12
Equation 2
Where r = radius of plankton net opening (0.5m) and h = depth of plankton tow
(m).
To determine the effect of subsampling on success of detection of veligers in our
samples, I also analyzed different subsample volumes extracted from the 50mL sample
tubes using graduated pipettes. The subsample volumes were: 3mL, 5mL, 10mL, 15mL,
20mL, 25mL, 30mL, and 40mL.
FlowCAM
The plankton samples in 50mL polypropylene conical tubes were shaken
vigorously by hand, and a three-mL subsample was removed using a disposable plastic
pipette. The subsample was mixed with about three mL of polyvinylpyrrolidone (PVP)
solution to increase viscosity and to slow the movement of particles through the flow cell.
The objective used on the FlowCAM was 4× magnification. The flow of plankton
through the flow cell was set to the lowest setting to ensure that the maximum number of
particles was captured. An XPL (cross-polarizing lens) filter was attached to the
FlowCAM to increase visibility of veligers. Particles were imaged using the Image
Management System (IMS) under autoimaging mode. Captured images of plankton were
analyzed using Visual Spreadsheet (VS). Veligers were easily confirmed from manual,
visual inspection of saved images (Fluid Imaging Technologies 2011).
13
Equation 3
Where Af = abundance by FlowCAM (Ind. m-3), cf = counts from FlowCAM (Ind.),
and V = volume of lake water filtered (m3) (as defined in Equation 2).
To assess the possibility that three ml subsamples created volume-based artifacts, I
resampled the same samples using subsample volumes of 1mL, 5mL, 10mL, 15mL, and
25 mL using one high abundance sample and one low abundance sample.
Environmental DNA
Total genomic DNA was extracted from bulk plankton samples obtained from
plankton tows (Zaiko et al. 2015; Ardura et al. 2017). 1 mL volume of was removed from
hand-shaken 50ml tubes using a disposable plastic pipette and placed in 1.5mL
microcentrifuge tubes. The plankton was centrifuged to concentrate all solids at the
bottom of the microcentrifuge tube. Ethanol was discarded, and solid contents of the
tubes were dried in a Vacufuge Concentrator. Digestion buffer and proteinase K was
placed into the tubes for overnight digestion before plate-based extraction (Elphinstone et
al. 2003). I used conventional PCR instead of real time quatitative PCR (qPCR) (Heid et
al. 1996) because I was only looking at absence/presence of the species, not abundance.
The COI gene was PCR amplified using primers DpCOI-F
GGGATTCGGAAATTGATTGGTAC-3′) and DpCOI-R
(5′-GAATCTGGTCACACCAATAGATGTGC-3′) (Egan et al. 2015). All PCR reactions
were performed in 11μL reactions containing 1μL of template DNA, 0.8μL of Mg2SO4
14
polymerase (BioBasic). Cycling conditions for PCR were: an initial denaturation step of
95°C for 1 min, 30 cycles of 94°C for 30 sec, 59°C (COI) for 45 sec, and 72°C for 1 min,
and a final extension at 72°C for 8 min. To assess positive detections, PCR products were
visualized on a 2% agarose gel.
I also included a sensitivity test for zebra mussel veligers. One, three, five and ten
individual veligers were extracted and amplified in the same PCR protocol described to
determine the minimum number of veligers needed to amplify the DNA.
Statistical analysis
I conducted a multiple means comparison (Tukey contrasts) after ANOVA on
microscopic abundances between Winnipeg Beach (n=100), Hnausa (n=100), Calder’s
Dock (n=100), Dauphin River (n=99), and Grand Rapids (n=100) using the “multcomp”
and “sandwich” package in R (Herberich et al 2010; R Development Core Team 2016).
This statistical test is robust for comparing means when data are not normally distributed.
I also conducted conducted Chi-square tests with Yates’ correction on contingency
tables on prevalence at different locations obtained by the three different methods: CPLM
(n=487), FlowCAM (n=487), and eDNA (n=487); Winnipeg Beach (n=97), Hnausa
(n=97), Calder’s Dock (n=97), Dauphin River (n=97), and Grand Rapids (n=97).
Prevalence data from whole sample CPLM (n=499), 1mL subsample eDNA
(n=487) and 3ml subsample FlowCAM (n=487) was analyzed using R package “GLM”
(R Development Core Team 2016) to determine the probability of detecting at least one
veliger with increasing number of subsamples processed.
I used one-tailed paired t-test to compare the prevalence obtained from Calder’s
15
(n=49). 3mL subsample prevalence data from Calder’s Dock was used to calculate the
probability of detecting at least one veliger with increasing samples analyzed with basic
R (R development Core Team 2016). I did this by sampling the prevalence data at
random 100 times with the corresponding number of samples to obtain the probability of
detecting at least one veliger.
RESULTS
I successfully detected veligers at all five sites that I sampled for plankton using
CPLM. The prevalence (percentage of samples that had at least one veliger) for all
samples from all sites was 94% (Table 1). As expected, 100% of samples from the south
basin (Winnipeg Beach and Hnausa) tested positive for veligers. Surprisingly, in the
north basin, Dauphin River also had 100% prevalence, while Grand Rapids was very
close (99% prevalence). Prevalence was substantially lower (63%) in the lake’s
mid-channel (Calder’s Dock) (Table 1; Figure 8). One sample was lost from the Dauphin
River site due to leakage and was not analyzed.
30% of the samples tested positive for the presence of veligers using FlowCAM
analysis of 3mL subsamples (Table 1). There was a range of FlowCAM prevalence
across the sites, with the highest prevalence in Winnipeg Beach and the lowest
prevalence in Calder’s Dock (Figure 8). There were significant differences between
prevalence at all locations (Chi-square test with Yates’ correction, p<0.05 for all pairwise
comparisons) except for Grand Rapids and Calder’s Dock (p=0.65), and Hnausa and
Dauphin River (p=0.16). There was a significant difference in prevalence between CPLM
16
Detection using DNA yielded only presence/absence of zebra mussels. While
abundance of NIS tells us the stage of invasion, the presence/absence data can alert
monitoring programs to the sites (Catford et al. 2012). Sensitivity testing indicated that
positive detection was possible with one veliger digested (Figure 7). I obtained positive
detection of zebra mussels at all but one site in Lake Winnipeg; there were no positive
detections at Calder’s Dock using eDNA. eDNA prevalence differed significantly (i.e.
was lower) than microscopic prevalence at all locations (Chi-squared test with Yates’
correction, p<0.05 for each pairwise comparison) except for Hnausa (Chi-squared test
with Yates’ correction, p=0.48). At all locations, microscopic prevalence was highest,
while eDNA prevalence was higher than FlowCAM prevalence at the high abundance
(south basin) locations. For the low abundance (north basin and channel) locations,
eDNA and FlowCAM had lower or similar prevalence (Table 1).
I observed a range of microscope abundances of veligers across the sites in Lake
Winnipeg (Table 2; Figure 4 and 5). The highest microscopic abundance was recorded at
Winnipeg Beach, the southernmost site, followed by Hnausa, which is also in the south
basin. The third highest abundance was Dauphin River in the north basin, followed by
Grand Rapids, the northernmost site. The lowest microscopic abundance was observed in
the channel at Calder’s Dock. There was a significant difference in microscopic
abundance between sites (Tukey contrasts, p<0.001 for all pairwise site comparisons).
FlowCAM abundance was significantly lower than microscopic abundance at all
sites (Tukey contrasts, p<0.001 for all pairwise method comparison). There was
significant difference in FlowCAM abundance between sites (Tukey contrasts, p<0.05 for
17
Hnausa and Dauphin River (p=0.980) (Figure 6). In the test for volume-based artifacts, I
found no significant difference in the number of veligers detected with increasing
subsample volume for either the low abundance location (ANOVA, df =1,16, F = 0.540,
p = 0.473) or high abundance location (ANOVA, df =1,16, F = 0.355, p = 0.560). Many
of the images captured by FlowCAM IMS software were not veligers, and many veligers
were captured only as partial images. Manual inspection of the captured FlowCAM
images using VS software confirmed that most images were debris or other plankton.
For example, in sample #1-91, I observed only two veligers out of 2182 captured images,
while sample #3-57 contained only one veliger out of 1330 captured images, and sample
#5-51 contained one veliger out of 1318 captured images.
For samples from all sites, there was a significant difference between 3ml
FlowCAM and 1ml eDNA in detection success (generalized linear model, p<0.01);
detection success increased more quickly for eDNA than FlowCAM with increasing
microscopic abundance (Figure 9).
In our analysis of 3ml subsamples from Calder’s Dock, prevalence was
significantly higher with microscopy than either FlowCAM (two-tailed paired t-test,
p<0.005) or eDNA (two-tailed paired t-test, p<0.005). However, prevalence did not differ
significantly between FlowCAM and eDNA in 3 ml subsamples (two-tailed paired t-test,
p=0.32). Probability of detecting at least one veliger increased with number of samples
analyzed for all three methods (Figure 10). Probability of detecting at least one veliger
using CPLM increased significantly faster than the two other methods with increasing
18
Microscopic analysis of 3mL subsamples resulted in the highest probability of detecting
at least one veliger at all numbers of samples analyzed.
DISCUSSION
Increasing sampling effort in plankton sampling can increase the success of
detection of zebra mussel veligers (Counihan and Bollens 2017). However, most
monitoring programs are limited by cost and time of sampling. So how much sampling is
enough? Here, I have shown successful detection of zebra mussel veligers in a newly
invaded system via intensive sampling and different methods of analysis. Despite being
only recently discovered in Lake Winnipeg, veligers were detected at all five lake sites
using all three methods except for Calder’s Dock using eDNA (Table 1). By sampling
intensively, I detected veligers in the north basin where they were previously unreported.
This indicated that sampling intensity of monitoring programs should be increased to
improve success of detection of veligers. Zebra mussel veligers were found in the north
basin of Lake Winnipeg as early as July 2015. These northern sites - Dauphin River and
Grand Rapids - had veliger prevalence rates of 100 and 99%, respectively. Despite these
high prevalence rates, mussel abundance in the north basin and channel was very low,
universally lower than 300 Ind. m-3. The south basin, by contrast, was considered high
abundance, with an average of 800 Ind. m-3. Veliger abundance in Lake Winnipeg
remains very low, with a maximum abundance of 1075 Ind. m-3. In contrast, Lake Erie
had about 3000 Ind. m3 in 1989 at the initial stages of invasion (Riessen et al. 1993),
increasing to 40,000 to 400,000 Ind. m-3 in the summer of 1990 (MacIsaac et al. 1992).
The very low abundance in Lake Winnipeg might be an indication of the lag phase of the
19
Summer mean surface water temperature in the lake is well within the reported thermal
tolerance of zebra mussel. Mean summer water temperature from 1999 to 2007 was
19.7°C in the north basin and 21.5°C in the south basin and channel, with little
stratification (Environment Canada 2011). Of all the Great Lakes, Lake Erie is the most
similar in volume and surface area to Lake Winnipeg. Water temperature of Lake Erie
can reach 25°C in the summer and 0°C in winter (NOAA 2016). Zebra mussels can
survive and thrive in Lake Erie (Schloesser et al. 1996). Zebra mussels have the potential
to do the same in Lake Winnipeg (Therriault et al., 2013).
Low abundance and high prevalence of veligers in Lake Winnipeg may indicate
that there are small populations of adult zebra mussels throughout the lake, even in the
north basin. Veligers can be produced by these populations, causingveligers to be
detected in all the sample tows, albeit in low abundance. Adult zebra mussels were
detected by monitoring programs in the south basin long before reports of detections in
the north basin (CWS 2015). As expected, abundance of veligers was higher in the south
basin where they were established compared to the north basin where they only recently
invaded. Samples from Calder’s Dock had the lowest abundance, possibly due to high
flow rate through the narrow channel (Zhao et al. 2012). Veligers experience high
mortality rates when exposed to turbulent water or hydrodynamic forces in laboratory
experiments (Rehmann et al. 2003; Horvath and Crane 2010). Veligers might experience
increased mortality at the channel because of turbulence from the high flow rate.
Veligers could spread from the initial site of invasion throughout Lake Winnipeg
via water currents or as postveligers attached to drifting macrophytes or debris (Johnson
20
through the central channel, and into the north basin (Zhao et al. 2012). High abundance
of veligers in the south basin and lower abundance in the north basin (Figure 4) are
consistent with this view.
Effective monitoring is needed for the early detection of invasive dreissenid
mussels to prevent costly management efforts. While intensive sampling can increase the
chance of detection, methods of analysis needs to be quick, sensitive and cost effective.
Ideally, methods of analysis must be able to process large numbers of samples obtained
from intensive sampling effectively (i.e. with high sensitivity) (Counihan and Bollens
2017). Most research has focused on the optimization of one method of detection. Even
when comparing the three methods, different samples were analyzed (Frischer et al.
2012). In this experiment, I tested all three methods on the same samples.
I observed significantly lower prevalence and abundance with FlowCAM and
eDNA as compared to CPLM, indicating that the former two approaches were more
prone to false negatives. False negatives with FlowCAM were caused by the IMS
software not recognizing veligers. I noted that some veligers passed through the flow cell
in the FlowCAM but were not captured by the software, causing the FlowCAM values to
be lower than microscopic identification even though both approaches used
cross-polarizing lenses. Visual inspection of captured FlowCAM images revealed that many
particles captured were not veligers, raising the possibility of false positives. Possible
type I errors with the FlowCAM could occur when the software captures images of
birefringent sand particles or microplastics (Jaeger 2005; Lusher et al. 2017). Newer
software is touted to be better at detect veligers (Fluid Imaging Technologies 2017).
21
(Stanislawczyk et al. 2017), in this case FlowCAM did not outperform the microscopic
method.
All sites had at least one positive result for the presence of zebra mussel eDNA
except Calder’s Dock (Table 1). This indicated that eDNA detection did not work well at
sites where animal abundance was very low. It is possible that inhibition occurred in
some of the sites with prolific phytoplankton, which would lead to false negatives. As
preliminary work determined that one veliger was enough to obtain a positive detection
result, overall abundance at Calder’s Dock must have been very low (Figure 7). However,
for low abundance samples, one mL of subsample (taken from a 50mL sample) may have
been insufficient as it had a low probability of containing a veliger. 1 mL subsampling at
Calder’s Dock resulted in 0% prevalence (zebra mussel DNA detection) in all samples. I
recommend digesting larger volumes, and whole samples if possible, of plankton for
eDNA analysis.
False negatives from eDNA in aquatic environments can result from DNA shed by
species swimming through the sampling field but departing the location. The sedentary
nature of adult zebra mussels means that there was a smaller chance of false positives
from migrating individuals. While there exist many markers and techniques (Ardura et al.
2017; Gingera et al. 2017), I found that eDNA detection combined with intensive
sampling resulted in a high chance of detection at high abundance sites. eDNA protocols
vary with the study organism and environment (Goldberg et al. 2016). In my study, I was
able to obtain positive detection of zebra mussels from one veliger using conventional
22
(Xia et al. 2018), conventional PCR was sufficiently sensitive to DNA concentration as
low as 7.25 × 10⁻¹¹ ng/µL (Jerde et al. 2010).
Microscopic analyses of 3mL samples had the highest probability of detecting at
least one veliger (Figure 10). Microscopic analysis will give the best chance of veliger
detection between the three methods when only small numbers of subsamples are
analyzed. For 3mL subsampling of samples from Calder’s Dock, eDNA had the lowest
probability of detecting at least one veliger. Again, eDNA does not perform better than
CLPM when the abundance is very low.
While accuracy and reliability of the three methods of analysis are important and
have been discussed (Frischer et al. 2012), feasibility, ease of use, and economics of
using different methods have not been explored. Cost-effectiveness of these methods is
important, as it may inform which detection method should be utilized in future (Roos et
al. 1998). Depending on budget, time constraints, and availability of equipment, one of
these three methods is better suited for the needs of their monitoring programs. Resources
such as time and money can be limited for the management of ecological systems so
making informed decisions is important (Chadès et al. 2017; Kling et al. 2017). NIS
monitoring programs can benefit from lowering costs and increasing efficiency (Bogich
et al. 2008; Hauser and McCarthy 2009). The time and money saved could then be used
to manage or prevent an invasion. To that end, I examined the cost and time taken for
each method to analyzed 500 samples. I collected the startup cost of buying new
equipment for each method. All the necessary paraphernalia for each method was also
23
FlowCAM costs were obtained from an invoice from Fluid Imaging. The cost of running
PCRs and qPCRs was obtained from Riedel at al. 2014 and Schlatter et al. 2015.
CPLM was mid-range in startup cost, when compared with eDNA and FlowCAM.
Although FlowCAM cost the most, if you are using it for other purposes, it would be
justified (because it can be used for a variety for other applications.) FlowCAM is
particularly good at phytoplankton identification (Camoying and Yñiguez 2016). eDNA
detection was the fastest method and most cost effective. This method would be the best
choice for time and budget constraints. Its ability to detect zebra mussels was also
significantly better than FlowCAM (Figure 9).
I calculated the cost needed to process each sample. I also calculated the labor and
time I took to analyze 500 plankton samples (Table 3). The startup cost of purchasing
FlowCAM and accessories was by far the highest. The second most expensive startup
cost was CPLM, while the lowest in startup cost was eDNA.
The cost of analyzing one sample by CPLM was CAD4.30 for labour only. The
cost of running a sample through FlowCAM was CAD6.90, including labor and
consumables. The cost per sample analyzed using conventional PCR was calculated to be
CAD6.40 (Table 3). I assumed that one PCR reaction gave us the definitive
present/absence result for each sample and training takes the same amount of time for all.
I have also included the cost of using qPCR instead of conventional PCR. The cost of
using qPCR is CAD8.60 per sample analyzed (Table 3).
eDNA was the fastest method of analyzing many samples (Table 3). It was possible
to DNA extract and PCR amplify many samples in three days. This requires a molecular
24
be reused after this method. eDNA paired with intensive sampling was a very quick way
to confirm presence, because one positive test was required to confirm that the species
was present (more positives is, of course, better). This method should be explored in
future, in particular the use of qPCR for eDNA detection. While qPCR is more sensitive
than conventional PCR at detecting eDNA (Xia et al. 2018), the cost of using qPCR is
higher than the cost of conventional PCR (Riedel et al. 2014). When made possible by
finding, monitoring programs that utilize eDNA detection for NIS should opt of qPCR
methods.
The abundance of veligers can greatly change in one spawning season (Riessen et
al. 1993). The abundance and prevalence obtained from this study was from a single
sampling event. Increasing the number of sampling events can provide a better idea of
variation in veliger abundance and prevalence over the course of a year.
While I rinsed plankton nets between tows to prevent cross-contamination of
veligers between samples, there was a chance of transfer of veligers. If this occurred, the
veliger from one sample ends up in another, potentially causing a false negative in the
first and a false positive in the second. In addition, the presence of sand (which are also
birefringent) in the samples could cause a type I error. Finally, it was possible that a
veliger could be missed when conducting microscopy, causing a type II error.
CONCLUSION
Detection of zebra mussels through veligers is most successful using CLPM due to
their birefringence. Although time-consuming, whole sample CPLM gave the highest
probability of detecting at least one veliger at the lowest number of samples processed.
25
tows are analyzed. eDNA with conventional PCR was the fastest and lowest-cost in
detection of zebra mussels. While not as good as the CPLM at detecting veligers at low
abundance, eDNA detection will be useful for monitoring programs involving large areas
with multiple lakes. Many samples can be analyzed in a timely and cost-efficient manner.
If large samples of plankton can be effectively processed for DNA extraction and PCR
26
Table 1: Prevalence (%) of zebra mussel detection in the samples using CPLM,
FlowCAM+XPL, and eDNA. 100 samples were collected from each five 5 sites sampled
for plankton in Lake Winnipeg. eDNA detection was of DNA amplification of zebra
mussels COI mtDNA.
Site CPLM
(n=499)
FlowCAM with XPL attachment
(n=487)
eDNA (n=487)
Grand Rapids 99 3 4
Dauphin River 100 34 7
Calder’s Dock 63 2 0
Hnausa 100 45 94
27
Table 2: Whole counts of veliger in samples were divided by volume of water filtered per
plankton tow to obtain lake abundance (Ind. m-3). Median and means of microscopic
abundance of veligers were calculated for five sampled sites in Lake Winnipeg.
Site Median Mean Standard Deviation
Winnipeg Beach 448.2 493.9 212.7
Hnausa 254.3 256.2 71.9
Calder's Dock 0.3 0.5 0.7
Dauphin River 85.7 92.4 41.5
28
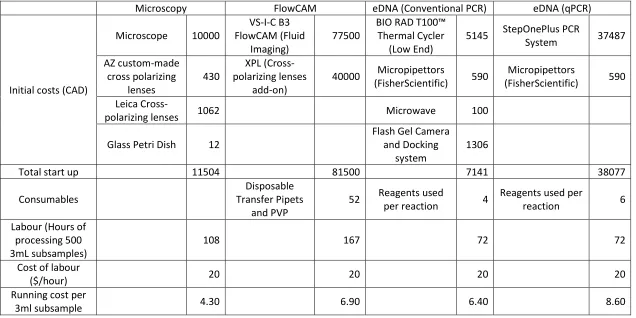
Table 3: Cost and labour comparison of three methods of analysis of 500 plankton samples collected from Lake Winnipeg for the
detection of zebra mussels. Cost of equipment compiled from our own purchases and invoices. PCR costs from (Riedel et al. 2014;
Schlatter et al. 2015). All costs are in Canadian dollars (CAD).
Microscopy FlowCAM eDNA (Conventional PCR) eDNA (qPCR)
Initial costs (CAD)
Microscope 10000
VS-I-C B3 FlowCAM (Fluid
Imaging)
77500
BIO RAD T100™ Thermal Cycler
(Low End)
5145 StepOnePlus PCR
System 37487
AZ custom-made cross polarizing lenses 430 XPL (Cross-polarizing lenses add-on)
40000 Micropipettors
(FisherScientific) 590
Micropipettors
(FisherScientific) 590
Leica
Cross-polarizing lenses 1062 Microwave 100
Glass Petri Dish 12
Flash Gel Camera and Docking
system
1306
Total start up 11504 81500 7141 38077
Consumables
Disposable Transfer Pipets
and PVP
52 Reagents used
per reaction 4
Reagents used per
reaction 6
Labour (Hours of processing 500 3mL subsamples)
108 167 72 72
Cost of labour
($/hour) 20 20 20 20
Running cost per
29
Figure 1: Simplified step wise progression of a successful biological invasion. The arrows represent each step of an invasion. Boxes
represent barriers to be overcome for a species to be a successful invader. Overcoming a geographic barrier, transport is the movement
of the species from the donor region to the recipient region, usually by anthropogenic means. Introduction is the release of the species
from captivation into the environment at the recipient region. Species can also be released directly into the novel environment after
transport (e.g. ballast water discharge). During establishment, the species must be able to survive and reproduce to form a population.
30
Figure 2: Image of plankton under transmitted light and under cross-polarized
microscopy. The pictures show the same field of vision on a microscope. Pictured left,
veliger (indicated by arrow) is difficult to distinguish from other plankton. Pictured right,
the same veliger (indicated by arrow) under cross-polarized light appears bright owing to
31
Figure 3: Map of Lake Winnipeg, Manitoba. Black dots indicate plankton tow sampling
sites. Grand Rapids and Dauphin River are sites in the north basin of the lake. Calder’s
Dock is the site in the channel that connects the north and south basin. Hnausa and
32
Figure 4: Box-and-whiskers plot displaying median and range of veliger abundance
obtained using cross- polarized microscopy at each site. The thick line represents the
median abundance. The box indicates 50% of the data closest to the median. The
whiskers (the lines on either side) are maximum and minimum. Dots are outliers. There
33
Figure 5: Distribution of microscopic veliger abundance at the five sampled sites, starting
from the southernmost site to the northernmost site. The columns represent the number of
34
Figure 6: Comparison of mean FlowCAM (3mL subsample) and microscopic (whole
sample) veliger abundance. There was significant difference between FlowCAM and
microscopic abundance at each site (Tukey contrast of multiple means, p<0.05). Error
35
Figure 7: Positive detection of zebra mussel DNA (mtDNA COI amplification) in
sensitivity test. Bands on agarose gel are amplified DNA (arrow). Lane 1: Ladder
(100bp); Lane 2 to 5: One veliger; Lanes 6 to 9: One veliger + other plankton and
particles; Lane 11 to 14: Three veligers; Lanes 15 to 18: Three veligers + other plankton
36
Figure 8: Prevalence of zebra mussels in samples analyzed using CPLM, FlowCAM and
eDNA. There was significant difference in prevalence of all methods at each location
(Chi-squared test with Yates’ correction, p<0.05 for all pairwise comparison) except for
37
Figure 9: Detection of zebra mussel presence using eDNA (1mL) and FlowCAM (3mL);
Detection was plotted as 1, failure to detect as 0. There was a significant difference in
detection using FlowCAM versus eDNA (generalized linear model logistic regression,
38
Figure 10: Probability of detecting at least one zebra mussel veliger with increasing
number of samples analyzed. Three different methods (FlowCAM, eDNA and CPLM)
were tested using 3mL subsamples (of 98 total) of plankton collected from Calder’s Dock
in Lake Winnipeg. Prevalence was randomly sampled using R to determine detection
probability with increasing number of samples analyzed. There were significant
differences in the probability of detection between three methods (generalized linear
39 REFERENCES
Alvarez E., Moyano M., Lopez-Urrutia Á., Nogueira E., & Scharek R. 2013. Routine
determination of plankton community composition and size structure: a comparison
between FlowCAM and light microscopy. Journal of Plankton Research 36: 170–
184.
Anderson L. 2005. California’s reaction to Caulerpataxifolia: A model for invasive
species rapid response. Biological Invasions 7:1003–1016.
Ardura A., Zaiko A., Borrell Y., Samuiloviene A., & Garcia-Vazquez E. 2017. Novel
tools for early detection of a global aquatic invasive, the zebra mussel Dreissena
polymorpha. Aquatic Conservation: Marine and Freshwater Ecosystems 27:
165-176
Banerjee A., Chitnis U., Jadhav S., Bhawalkar J., & Chaudhury S. 2009. Hypothesis
testing, type I and type II errors. Industrial Psychiatry Journal 18: 127.
Becerra J., & Valdecasas A.G. 2004. Landmark superimposition for taxonomic
identification. 2004. Biological Journal of the Linnean Society 81: 267–74.
Benfield M., Grosjean P., Culverhouse P., Irigolen X., Sieracki M., Lopez-Urrutia A.,
Dam H., Hu Q., Davis C., Hanson A., Pilskaln C., Riseman E., Schulz H., Utgoff
P., & Gorsky G. 2007. RAPID: research on automated plankton identification.
Oceanography 20: 172–187.
Blackburn T., Pyšek P., Bacher S., Carlton J.T., Duncan R.P., Jarošík V., Wilson J.R.U.,
& Richardson D.M. 2011. A proposed unified framework for biological invasions.
40
Bobeldyk A.M., Bossenbroek J.M., Evans-White M.A., Lodge D.M., & Lamberti G.A.
2005. Secondary spread of zebra mussels (Dreissenapolymorpha) in coupled
lake-stream systems. Ecoscience 12: 339–46.
Bogich T.L., Liebhold A.M., & Shea K. 2008. To sample or eradicate? A cost
minimization model for monitoring and managing an invasive species. Journal of
AppliedEcology 45: 1134–1142.
Borcherding J. 1991. The annual reproductive-cycle of the fresh-water mussel Dreissena
polymorpha Pallas in lakes. Oecologia 87: 208–218.
Bradley B. 2014. Remote detection of invasive plants: A review of spectral, textural and
phenological approaches. Biological Invasions 16: 1411-1425.
Brown E., Chain F., Zhan A., MacIsaac H., & Cristescu M. 2016. Early detection of
aquatic invaders using metabarcoding reveals a high number of non-indigenous
species in Canadian ports. Diversity and Distributions 22: 1045–1059.
Brown M., Roth J., Smith B., & Boscarino B. 2017. The light at the end of the funnel?:
Using light-based traps for the detection and collection of a nearshore aquatic,
invasive invertebrate, Hemimysis anomala. Journal of Great Lakes Research 43:
717-727.
Buskey E.J., & Hyatt C.J. 2006. Use of the FlowCAM for semi-automated recognition
and enumeration of red tide cells (Kareniabrevis) in natural plankton samples.
Harmful Algae 5: 685-692.
Catford J.A., Vesk, P.A., Richardson D.M. and Pyšek P. 2012. Quantifying levels of
biological invasion: towards the objective classification of invaded and invasible
41
Carlton J.T. 2008. The zebra mussel Dreissenapolymorpha found in North America in
1986 and 1987. Journal of Great Lakes Research 34: 770–773.
Chadès I., Nicol S., Rout T.M., Péron M., Dujardin Y., Pichancourt J.-B., Hastings A., &
Hauser C.E. 2017. Optimization methods to solve adaptive management problems.
TheoreticalEcology 10:1–20.
Chakraborti R.K., Madon S., Kaur J., & Gabel D. 2014. Management and control of
Dreissenid mussels in water infrastructure facilities of the southwestern United
States. Quagga and zebra mussels: biology, impacts, and controls. Second edition.
Edited by Nalepa T.F. and Schloesser D.W. pp. 243–257. CRC Press, Boca Raton.
ISBN: 978-1-4398-5436-5
Charlebois P., Corkum L., Jude D., & Knight C. 2001. The round goby (Neogobius
melanostomus) invasion: current research and future needs. Journal of Great Lakes
Research 27: 263–266.
Clapp D.F., Schneeberger P.J., Jude D.J., Madison G., & Pistis C. 2001. Monitoring
round goby (Neogobiusmelanostomus) population expansion in Eastern and
Northern Lake Michigan. Journalof Great Lakes Research 27: 335–341.
Claudi R. & Mackie G. 2010. Monitoring and control of macrofouling mollusks in fresh
water systems. Second Edition. Pp. 210-211. CRC Press, Boca Raton ISBN
978-1-4398-0050-8
Closset-Kopp D., Saguez R., & Decocq G. 2011. Differential growth patterns and fitness
may explain contrasted performances of the invasive Prunus serotina in its exotic
42
Coker R. & Surber T. 1911. A note on the metamorphosis of the mussel Lampsilis
lævissimus. Biological Bulletin 20: 179–182.
Connelly N.A., O’Neill C.R., Knuth B.A., & Brown T.L. 2007. Economic impacts of
zebra mussels on drinking water treatment and electric power generation facilities.
EnvironmentalManagement 40: 105–112.
Contarini M., Onufrieva K.S., Thorpe K.W., Raffa K.F., & Tobin P.C. 2009.
Mate-finding failure as an important cause of Allee effects along the leading edge of an
invading insect population. Entomologia Experimentalis et Applicata 133: 307–
314.
Cope W., Bartsch M., & Marking L. 1997. Efficacy of candidate chemicals for
preventing attachment of zebra mussels (Dreissena polymorpha). Environmental
Toxicology and Chemistry 16: 1930–1934.
Counihan T.D. & Bollens S.M. 2017. Early detection monitoring for larval dreissenid
mussels: how much plankton sampling is enough? Environmental Monitoring and
Assessment 189: 98.
Courchamp F., Chapuis J.L., & Pascal M. 2003. Mammal invaders on islands: impact,
control and control impact. BiologicalReviews 78: 347–383.
Culverhouse, P.F., Williams R., Benfield M., Flood P.R., Sell A.F., Mazzocchi M.G.,
Buttino I., & Sieracki M. (2006). Automatic image analysis of plankton: future
perspectives. Marine Ecology Progress Series 312: 297-309.
Culverhouse P.F., Williams R., Reguera B., Herry V., & González-Gil S. 2003. Do
experts make mistakes? A comparison of human and machine identification of
43
CWS. 2015. Manitoba Conservation and Water Stewardship reports fall monitoring show
zebra mussels are now present in the north basin of Lake Winnipeg. [news release]
Available at: http://news.gov.mb.ca/news/?item=36496 (accessed 20 June 2017).
Day J.G., Thomas N.J., Achilles-Day U.E.M., & Leakey R.J.G. 2012. Early detection of
protozoan grazers in algal biofuel cultures. BioresourceTechnology 114: 715–719.
DFO. 2014. Science Response 2014/031 - Lake Winnipeg Zebra Mussel treatment
[report] Available at:
http://www.dfo-mpo.gc.ca/csas-sccs/publications/scr-rs/2014/2014_031-eng.html (accessed 20 September 17)
Djuricich P. & Janssen J. 2001. Impact of round goby predation on zebra mussel size
distribution at Calumet Harbor, Lake Michigan. Journal of Great Lakes Research
27: 312–318.
Egan S.P., Grey E., Olds B., Feder J.L., Ruggiero S.T., Tanner C.E., & Lodge D.M.
2015. Rapid molecular detection of invasive species in ballast and harbor water by
integrating environmental DNA and light transmission spectroscopy.
Environmental Science and Technology 49: 4113–4121.
Elphinstone M.S., Hinten G.N., Anderson M.J., & Nock C.J. 2003. An inexpensive and
high-throughput procedure to extract and purify total genomic DNA for population
studies. Molecular Ecology Notes 3: 317–320.
Environment Canada. 2011. State of Lake Winnipeg: 1999 to 2007 highlights. [report]
Available at:
https://www.gov.mb.ca/waterstewardship/water_quality/state_lk_winnipeg_report/
pdf/state_of_lake_winnipeg_rpt_technical_low_resolution.pdf (accessed 27 Dec
44
Evans D.O., Skinner A.J., Allen R., & McMurtry M.J. 2011. Invasion of zebra mussel,
Dreissenapolymorpha, in Lake Simcoe. Journal of Great Lakes Research 37: 36–
45.
Fernald R. & Watson B. 2014. Eradication of zebra mussels (Dreissenapolymorpha)
from Millbrook Quarry, Virginia. Quagga and zebra mussels: biology, impacts, and
controls. Second edition. Edited by Nalepa T.F. and Schloesser D.W. pp. 195–213.
CRC Press, Boca Raton. ISBN: 978-1-4398-5436-5.
Ficetola G., Miaud C., Pompanon F., & Taberlet P. 2008. Species detection using
environmental DNA from water samples. Biology Letters 4: 423–25.
Ficetola G., Pansu J., Bonin A., Coissac E., Giguet-Covex C., De Barba M., Gielly L.,
Lope C., Boyer F., Pompanon F., Rayé G. & Taberlet P. 2015. Replication levels,
false presences and the estimation of the presence/absence from eDNA
metabarcoding data. Molecular Ecology Resources 15: 543–556.
Fitzpatrick M.C., Preisser E.L., Ellison A.M., & Elkinton J.S. 2009. Observer bias and
the detection of low-density populations. Ecological Applications 19: 1673–1679.
Fluid Imaging Technologies. 2011. FlowCAM Manual. Available at:
http://www.ihb.cas.cn/fxcszx/fxcs_xgxz/201203/P020120329576952031804.pdf.
Fluid Imaging Technologies. 2017. Available at:
http://info.fluidimaging.com/hs-
fs/hub/300163/file-1868360604-pdf/documents/Application_Notes/Invasive-Species-Birefringence-App-Note.pdf?t=1498652528613. (accessed 28 June 2017)
Frischer M.E., McGrath B.R., Hansen A.S., Vescio P.A., Wyllie J.A., Wimbush J. &
Nierzwicki-Bauer S.A. 2005. Introduction pathways, differential survival of adult
45
strategies, in an Adirondack lake, Lake George, NY. Lake and Reservoir
Management 21: 391–402.
Frischer M.E., Kelly K.L., & Nierzwicki-Bauer S. 2012. Accuracy and reliability of
Dreissena spp. larvae detection by CPLM, imaging flow cytometry, and
polymerase chain reaction assays. Lake and Reservoir Management 28: 265–276.
Gingera T.D., Bajno R., Docker M.F., & Reist J.D. 2017. Environmental DNA as a
detection tool for zebra mussels at the forefront of an invasion event in Lake
Winnipeg, Manitoba, Canada. Management of Biological Invasions 8: 287-300
Goldberg C.S., Turner C.R., Deiner K., Klymus K.E., Thomsen P.F., Murphy M.A.,
Spear S.F., McKee A., Oyler-McCance S.J., Cornman R.S., Laramie M.B., Mahon
A.R., Lance R.F., Pilliod D.S., Strickler K.M., Waits L.P., Fremier A.K., Takahara
T., Herder J.E. and Taberlet P. 2016. Critical considerations for the application of
environmental DNA methods to detect aquatic species. Methods in Ecology and
Evolution 7: 1299–1307.Gorsky G., Ohman M.D., Picheral M., Gasparini S.,
Stemmann L., Romagnan J., Cawood A., Pesant S., García-Comas C., & Prejger F.
2010. Digital zooplankton image analysis using the ZooScan integrated system.
Journal of Plankton Research 32:285-303.
Graham G. & Camp R. 2017. Instrumentation advance speeds plankton study. Sea
Technology 58:30-32.
Gu W.D. & Swihart R.K. 2004. Absent or undetected? Effects of non-detection of species