Transactions of the 17th International Conference on
Structural Mechanics in Reactor Technology (SMiRT 17) Prague, Czech Republic, August 17 –22, 2003
Paper # M02-2
Development of Seismic Hazard Curves for the Portfolio of Facilities
Sei’ichiro Fukushima1), Harumi Yashiro2)
1) Tokyo Electric Power Services Co. Ltd., Tokyo, Japan 2) Asian Disaster Reduction Center, Hyogo, Japan
ABSTRACT
In seismic PSA, a probabilistic seismic hazard curve (PSHC) is obtained for a given site. This may be adequate in case that the facilities of interest are placed in the small area. For example, the same PSHC can be used for the reactor building, the turbine building and the control building, which are constructed in the same power station. On the contrary, if the soundness of portfolio of facilities is required be examined, PSHC cannot be used. Adopting the unique PSHC to each facility is not adequate. And, calculating PSHC for each site means that different earthquakes may be considered simultaneously.
In this paper, the concept of conditional PSHC is introduced. In calculating PSHC, a lot of element earthquakes with its magnitude, location, annual frequency of occurrence are generated. The conditional PSHC is the one calculated with the element earthquakes that are used for the PSHC of the primary facility. Obviously, the element earthquakes will vary in the different level of ground motion intensity. Therefore, identification of element earthquakes is carried out for several level of intensity.
This method is adopted to the model portfolio consisting of 25 buildings; the primary facility is located in Tokyo and the secondary facilities are located in Kanto district. The result shows PSHCs for facilities and the relative intensities of the seismic motion of the secondary facilities to that of the primary facility.
It is concluded that this method can enable to perform seismic PSA of the portfolio consisting of some facilities located in the different sites. For example, seismic PSA of nuclear power plant considering the outage caused by the failure of transmission system can be carried out.
KEY WORDS: seismic PSA, nuclear power plant, loss of off-site power, seismic hazard, portfolio of facilities, ground motion intensity, peak ground acceleration, correlation of intensity, conditional hazard, seismic source model, characteristic earthquake, background earthquake,
INTRODUCTION
In seismic PSA, it is said that a loss of off-site power (LOSP) is one of the dominant events to core damage. LOSPs are caused by the damage to the facilities in the site and by that to the facilities connected to the site through transmission lines. The same PSHC may be adopted to both the reactor building and facilities related to LOSP in the site since they are located close to one another. On the other hand, the different PSHC must be adopted to the LOSP related facilities located in the different site. For the latter case, it must be noted that the PSHC for the LOSP related facilities cannot be calculated independently of that for the reactor building since LOSP itself should be considered with damage to reactor building. Therefore the PSHC for the LOSP related facilities outside of the site must be calculated considering the correlation to that for the reactor building.
This paper proposes the methodology to evaluate the PSHC for the facilities whose damage must be examined with that to the primary facility of concern. By adopting the proposed methodology to the model portfolio where the primary facility exists, the PSHC for the primary facility and those for the secondary facilities are calculated. Also given is the ratio of the intensity of seismic motion of the secondary facilities to that of the primary facility.
METHODOLOGY
In this paper, PSHC for the facility of concern (primary facility) is calculated by the following procedure, generating small earthquakes (events) with its magnitude and annual occurrence frequency, calculating the annual exceedence frequency for given intensities,
summing up annual exceedence frequency of each event, and,
converting the annual exceedence frequency into annual exceedence probability if necessary.
PSHCs for the other facilities (secondary facilities) are calculated by the following procedure, calculating the contribution of each event to the given bin of intensity,
Generation of Events
In this paper, 2 types of seismic source are employed; one corresponding to the area where large earthquakes occur, and the other corresponding to the area where small earthquakes occur. As shown in Fig.1, large earthquakes are modeled as a characteristics earthquake with its rapture plane given as a function of JMA magnitude, and small earthquakes are characterized by Gutenberg-Richter relationship with its rapture plane given as a unit grid.
Figure 1 Generation of Event
Annual Exceedence Frequency
Relationship between given intensity and its annual exceedence probability by each event is given as follows,
Φ × × ×
= >
β ν
ν ln( / )
) (
1 ) ( ]
[ A a
m n m p a
A i
i i k k
i (1)
where, νi[A>a] is annual frequency that ground motion intensity A by event i is greater than the given level a, νk
is annual occurrence frequency of earthquake in source k where the event i occurs, pk(mi) is relative probability of occurrence of magnitude mi in the source k, n(mi) is the number of rapture plane corresponding to magnitude mi, Ai is median intensity obtained by attenuation relation for event i, β is log-normal standard deviation of the attenuation relation, and Φ[•] is the normal Gaussian distribution function.
By summing Eqn. (1) for all events, the annual exceedence frequency ν[A>a] is calculated as follows,
] [ ] [
1
a A a
A N
i i
> =
>
∑
=
ν
ν (2)
where, N is the number of the generated events.
Contribution of Event to the Given Intensity
In this paper, the contribution of event to the given intensity is defined by the occurrence frequency of the event and the scatter of attenuation relation. For the given intensity a0 and event i, the scatter of attenuation relation σi(a0)
is given as follows,
β σ ( ) ln( / 0)
0
a A
a i
i = . (3)
randomly located
randomly located rupture plane
source zone
magnitude number
rupture plane
source zone
magnitude number
Large Earthquake
On the other hand, the occurrence frequency of the event is given as follows, +∆ Φ − −∆ Φ × × × = β β ν
ν ln( /( /2)) ln( /( /2))
) ( 1 ) ( )
( 0 0
0 a a A a a A m n m p
a i i
i i k k
i (4)
where, ∆a is a width of bin corresponding to a0.
It must be noted that Eqns. (3) and (4) are defined for the primary facility and are used to calculate PSHCs of secondary facilities.
Calculation of Intensity of Secondary Facilities
By assuming that the scattering of attenuation relation is caused by the source mechanism, same scatter may be applied to secondary facilities so that the intensities Aj(a0)
i for facility j by event i is calculated as follows, )
) ( exp( )
(a0 = A × σ a0 ×β
A j i
i j
i (5)
where, Aj(a0)
i is an intensity for facility j by event i when the intensity for the primary facility is a0.
j i
A is the median intensity for facility j by event i.
Though the intensity for the primary facility is a0 for all events, it may scatter for the secondary facilities. So,
this paper employs the mean intensity which represents the conditional intensity for the secondary facilities A~j(a0)as follows,
∑
∑
= = × = N i i N i j i i j a a A a a A 1 01 0 0
0 ) ( ) ( ) ( ) ( ~ ν ν . (6)
Calculation of PSHCs for Secondary Facilities
As mentioned above, Eqn. (6) gives the conditional intensity for the secondary facilities and Eqn. (4) gives the annual occurrence frequency of the corresponding intensity. By combining these equations, PSHCs of the secondary facilities are obtained.
APPLICATION
As an application, a model portfolio is examined so that the PSHC for the primary facility and the conditional PSHCs for the secondary facilities are calculated simultaneously.
Seismic Source Model and Portfolio of Facilities
Figure 2 shows the source models for Kanto region in Japan. Characteristics of each source model are summarized in Table 1, which are based on the Annaka & Yashiro (1998).
1 2 3 4 5 6 7 8 9 10 11 12 S1 S2 S3 A1 A2 A3 A4
Table 1 Characteristics of Source Models
A portfolio consisting of 25 facilities is employed. The arrangement of facilities is shown in Table 2 and Fig. 3. The primary facility (Facility #1) is located in Tokyo, and the secondary facilities surrounding the primary facility are distributed in Kanto district.
Table 2 Location of Facilities forming Portfolio
Figure 3 Portfolio of Facilities
Souece # M Return Period Souece # M Return Period Souece # M A-balue b-value
1 7.0-7.6 1182 9 7.0-7.4 1182 A1 5.0-7.0 2.344 0.9
2 6.9-7.3 5212 10 6.6-7.0 5212 A2 5.0-7.0 4.235 0.9
3 7.0-7.4 79283 11 7.5-7.9 79283 A3 5.0-7.0 1.645 0.9
4 6.8-7.2 5931 12 7.1-7.5 5931 A4 5.0-7.0 3.344 0.9
5 7.1-7.5 8710
6 6.8-7.2 5676 S1 7.8-8.2 200
7 6.9-7.3 7239 S2 7.8-8.2 1000
8 7.1-7.5 2842 S3 6.8-7.2 73
Source for Large Earthquakes Source for Small Earthquakes
# Type Longitude Latitude city # Type Longitude Latitude city
1 primary 139.708 35.690 shinjuku 14 secondary 139.906 35.651 urayasu
2 secondary 140.475 36.363 mito 15 secondary 139.724 35.576 ota
3 secondary 139.886 36.552 utunomiya 16 secondary 139.640 35.696 suginami
4 secondary 139.067 36.386 maebashi 17 secondary 139.772 35.808 adachi
5 secondary 139.489 35.922 kawagoe 18 secondary 139.872 35.703 edogawa
6 secondary 139.392 36.144 kumagai 19 secondary 139.642 35.441 yokohama
7 secondary 139.727 35.805 kawaguchi 20 secondary 139.706 35.528 kawasaki
8 secondary 139.649 35.858 urawa 21 secondary 139.675 35.279 yokosuka
9 secondary 139.472 35.796 tokorozawa 22 secondary 139.495 35.336 fujisawa
10 secondary 140.110 35.604 chiba 23 secondary 139.156 35.261 odawara
11 secondary 139.986 35.691 funabashi 24 secondary 139.376 35.568 sagamihara
12 secondary 139.920 35.373 kisarazu 25 secondary 138.571 35.659 kofu
13 secondary 139.906 35.784 matsudo
1
2 3
4
5
6 7
8 9
10 11
12 13
14 15
16 18
17
1920
21 22 23
Comparison of Probabilistic Seismic Hazard Curves
In Fig. 4, four typical conditional PSHCs are shown with the PSHC for the primary facility. The broken line corresponds to the former, and the solid line to the latter. Type A is the conditional PSHC for the facilities located in the northern part of Kanto district, where seismic activity is low compared to the site of the primary facility. Type B is the conditional PSHC for the facilities located in the area close to the primary facility. Type C is the conditional PSHC for the facilities located in the area above the seismic source #S1, where the large earthquake occurs with the return period of 200 yr. Type D is the conditional PSHC for the facilities in the high seismic activity area which is far from the primary facility.
Due to the differences in the seismic activity and the distance from the primary facility, each type of PSHC has its own features; Type A is lower than the PSHC for the primary facility, Type B is identical to that, and Type C is higher than that, respectively. Type D has a feature that it is lower in the low acceleration range and higher in the high acceleration range, since the individual small earthquakes around the facility contribute to the low acceleration range and has little correlation with those for the primary facilities.
Figure 4 Comparison of PSHC
Comparison of Acceleration for Given Annual Exceedence Probability
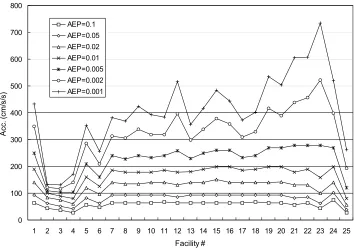
Figure 5 shows the accelerations calculated for the given annual exceedence probabilities (AEPs) of 0.1, 0.05, 0.02, 0.01, 0.005, 0.002 and 0.001.
To make the difference clear, accelerations are normalized by that of the primary facility as shown in Fig. 6. Accelerations at facility #3 (Type A) is smaller than those at facility #1 (primary facility) regardless of AEPs. Accelerations at facility #16 (Type B) is almost identical to those at facility #1 as stated before. Accelerations at facility #19 (Type C) is identical to those at facility #1 for the higher AEP, and greater than those for the lower AEP, since the accelerations at facilities #1 and #19 for the lower AEP are dominated by the seismic source #S1, on which the facility #19 is located. Acceleration at facility #23 (Type D) is smaller than those at facility #1 for the higher AEP, and greater than those for the lower AEP. In case of lower AEP, the same reason stated to facility #19 can be applied. On the
#1 #1
#1
#1
#3 #16
#19 #23
[Type A] [Type B]
Figure 5 Comparison of Zero Period Acceleration for Given Annual Exceedence Probability
Figure 6 Comparison of Normalized Acceleration for Given Annual Exceedence Probability
Relationship between Acceleration at Primary Facilities and That at Secondary Facility
Figure 7 shows the relationship between the acceleration at the primary facility and that at the secondary facility. It can be seen that there is a linear relationship between them in the range of high acceleration though a nonlinear relationship is observed in the low acceleration range, especially in the range lower than 500 cm/s/s for the primary facility.
In order to investigate this relationship, the conditional acceleration at the secondary facility is normalized by that at the primary facility. Figure 8 shows some examples of the normalized accelerations. Facilities #3, #16, #19 and #23 are selected as a secondary facility. The relationship stated for Fig. 7 is clearly illustrated. In the range where the
0 100 200 300 400 500 600 700 800
1 2 3 4 5 6 7 8 9 10 11 12 13 14 15 16 17 18 19 20 21 22 23 24 25
Facility #
A
cc.
(
cm
/s/
s)
AEP=0.1 AEP=0.05 AEP=0.02 AEP=0.01 AEP=0.005 AEP=0.002 AEP=0.001
0.0 0.2 0.4 0.6 0.8 1.0 1.2 1.4 1.6 1.8
1 2 3 4 5 6 7 8 9 10 11 12 13 14 15 16 17 18 19 20 21 22 23 24 25 Facility #
N
or
m
aliz
ed
A
cc
.
acceleration at the primary facility is greater than 1000 cm/s/s, the relationship can be considered linear, since this range is dominated by the seismic source #S1 as described before.
On the contrary, in the acceleration range smaller 500 cm/s/s, this relationship varies by the location of facility and seismic activity. In case of facility # 16, the relationship can be considered as linear since the facility is close to the primary facility. Facility #19 has the same tendency except for the range of the extremely small acceleration, where the small earthquakes in the vicinity are dominant. In case of facilities #3 and #23, the effect of the uncorrelated small earthquakes appears more clearly than in case of facility #19. This is due to the fact that they are located far from the primary facility.
Figure 7 Comparison of Acceleration of Primary Facility with those of Secondary Facilities
0 1000 2000 3000 4000 5000 6000
0 500 1000 1500 2000 2500
Acc. of Primary Facility (cm/s/s)
A
cc
. of
S
ec
ondar
y
Fac
ili
ty
(
cm
/s
/s
)
Facility #3 Facility #16 Facility #19 Facility #23
Acc. of Primary Facility (cm/s/s)
Acc. of Secondary
Facility
(cm/s/s)
0.00 0.50 1.00 1.50 2.00 2.50
0 500 1000 1500 2000 2500
Acc. of Primary Facility (cm/s/s)
A
cc
. of
S
eco
ndar
y
F
ac
ili
ty
(
cm
/s
/s
)
Facility #19 Facility #23
Facility #16
Facility #3
Acc. of Primary Facility
CONCLUSION
This paper proposed the methodology to develop the PSHCs for the secondary facilities whose damages are examined with those to the primary facilities. By employing this conditional PSHC, it is possible to examine the soundness of the portfolio consisting of some facilities in different sites. As mentioned in the introduction, LOSP can be examined by considering the reactor building as the primary facility and other facilities such as transmission towers, sub stations and so on as the secondary ones.
It must be noted that this concept of the conditional PSHC can be applicable not only in the seismic PSA of the nuclear power plant but also in the field of disaster management. For example, the locations of the back-up facilities, such as a data center and an alternative headquarter, can be determined from the viewpoint of simultaneous occurrence of damage.
REFERENCES
1. Oikawa, T., Fukushima, S., Takase, H., Uchiyama, T., and Muramatsu, K., Seismic Reliability Evaluation of Electrical Power Transmission Systems and its Effect on Core Damage Frequency, Proceedings of the 16th International Conference on Structural Mechanics in Reactor Technology, 2001.
2. Fukushima, S., and Yashiro, H., Seismic Risk Analysis on Portfolio of Buildings, Journal of Architecture, Planning and Environmental Engineering, Architectural Institute of Japan, No.552, pp169-176, 2002 (in Japanese).