Abstract
CANCHEEVARAM, JAI KUMARAN KUPPUSWAMY
Design and Performance Characterization of a Test System for
Microprocessor Hot Spot Cooling using Thin-film Superlattice Thermoelectrics
(Under the direction of Dr. Winser E. Alexander)
The constant need for higher performance, increased levels of functional integration, as well as die size optimization has led to preferential clustering of higher power units on microprocessors. This causes higher heat flux concentrations in certain areas of the die and lower heat fluxes in certain other regions, which manifest themselves as large temperature gradients on the die surface. These local power densities are
commonly referred to as “hot spots”. The thermal cooling solution provided must
effectively ensure that junction/die temperatures on the processor do not exceed the rated 90-110 °C range to guarantee device performance and reliability.
The focus of this work is to present Thin-film Superlattice Thermoelectrics [TFST] as an excellent solution for microprocessor die hot spot cooling. TFSTs have measured Figure of Merit [ZT] values of ~2.4 at 300K for p-type superlattices, with potential to pump heat flux of up to 700Wcm-2. Furthermore, these devices have fast response times, which makes them achieve steady state cooling in 15µs. This is vital in preventing thermal runaway and subsequent failure of microprocessors during rapid load transients.
The primary contribution of this thesis is a test setup and experimental procedure, for characterization of an integrated TFST-processor system. First I identified and
power dissipated by the processor on the basis of the heat absorbed by the cooling system. This involved building a calorimetric system, which cools the processor by circulating water. The system was calibrated with a known load and found to measure within+ 3 watts of the actual power dissipated, for a processor thermal design power of 30 watts. Using this system, calculations of heat dissipated by the processor under both normal clocking and over clocking cases are presented.
The final step in integrating the TFST with the processor involved mounting the TFST module onto the processor hot spot and ensuring safe operation. The TFST module itself was powered by a custom-modified Howland current source circuit, which
Design and Performance Characterization of a Test System for Microprocessor Hot Spot Cooling using Thin-film Superlattice Thermoelectrics
By
Jai Kumaran Kuppuswamy Cancheevaram
A thesis submitted to the graduate faculty of
North Carolina State University
In partial fulfillment of the requirements of the degree of
Master of Science
COMPUTER ENGINEERING
Raleigh
2003
Approved by
________________________________
Dr. Winser E. Alexander, Chair of the Advisory Committee
__________________________ _____________________________
BIOGRAPHY
Jai Kumaran K Cancheevaram was born on 14th of February 1980 in the city of Chennai, India. In 2001, he graduated with a B.E (Honors) degree in Electrical and Electronics Engineering from the University of Madras, Tamilnadu, India.
He was an intern with the Research and Development Division of TVS Electronics, Chennai, India from August 2000 to May 2001. In the fall of 2001, he enrolled in the Masters program in Computer Engineering (CpE) at North Carolina State University, Raleigh. He has also been functioning as a Co-operative Research Assistant at the Center for Thermoelectrics [CTR], Research Triangle Institute, Raleigh from June 2002 to July 2003.
Acknowledgements
At the outset, I would like to thank my parents Kuppuswamy and Rajeswari and my brother Saravanan for their immense support and affection. I’m greatly indebted to them and cannot in any measure repay all that they have done for me.
I would like to thank my graduate adviser Dr. Winser Alexander. He is a fantastic teacher who exhibits lots of patience and understanding in his interactions with students. During the course of this work, I have benefited immensely from his knowledge and experience. The completion of this thesis is vastly due to his guidance and help during several critical junctures.
I would like to thank Dr. Rama Venkatasubramanian, Director at the Center for Thermoelectric Research, Research Triangle Institute. His dedication to his work and his ability to perpetually extract the best out of himself and also the people whom he works with has to be seen to believe. He has provided me with a rare opportunity to work with eminent scholars and converse in scientific circles.
I also thank Dr. John F. Muth and Dr. Ronald O. Scattergood for having agreed to be on my Graduate Advisory Committee. Their enthusiasm for my work was very encouraging and their suggestions on reviewing my thesis were invaluable.
Sincere appreciation is due to Randall Alley, Research Engineer, RTI. I have been an apprentice under his guidance during the past year. He has directed me towards results and scientific enquiries, which have culminated into this hesis. Edward Siivola, Testing Engineer, RTI deserves very special thanks for his immeasurable help and dexterity in the mounting and testing phase of the thin-film module.
document and Ryan Wiitala for his help with the ZT measurements. I also thank Pratima Adepalli, Mike Puchan, Geza Deszi, Tom Colpitts, Paul Crocco and Cherie Warren for their constant support and encouragement. Their critical comments have resulted in a more definitive and complete work. Special thanks to Mike Mantini, Dean Brooks and Bob Hendry in agreeing to help out a guy with two left hands when it comes to machining.
My roommates Srivatsan Ravindran, Sajjan Raghavan, Mohammad Ahraf, Pradeep Mahadevan and Vinay Chandrsekhar have been of great help. They were very understanding to my odd working hours and constant bickering when deadlines approach. They have eased the effort in the completion of this work in very short duration.
Aravindh Anantaraman deserves a special mention for his guidance thorough the annals of computer architecture. He along with Vishwanath Sunderaraman and Lashminarayan Venkatesan have been stern, yet supportive during several moments when I have been frivolous with time.
I would like to thank Karthigeyan Loganathan, Deepak Shanmugasundaram, Vinodha Sadasivam, Deepa Ponappan, Anand Sivaraman, and Raghunath Subramanian, for having put up with my antics and for providing me with much needed breaks.
Friends who have helped me in numerous ways include Karthikeyan Santhanagopalan, Manukaran Karunakaran, Arianathan Rajagopal, Patrick Hamilton, Yogesh Ramadoss, Deepak Thirumalai, Karthik Chandrasekar and Bhavesh Sampath. I thank them all for their support.
Table of Contents
List of Figures ... vii
List of Tables ... viii
List of Equations... ix
List of Symbols ... x
Glossary of Important Terms [16] ... xii
Chapter 1 Introduction... 1
1.1 Foreword... 1
1.2 Amount of Heat Transferred from Heat sink... 2
1.2.1 Increasing Surface area of Heat Sink... 2
1.2.2 Forced Convection Airflow ... 2
1.2.3 Acoustics... 3
1.2.4 Heat Sink Temperature ... 3
1.2.5 Heat Spreading... 3
1.3 Alternate Cooling Solutions... 4
1.3.1 Circulated Liquid Cooling and Refrigeration [11]... 4
1.3.2 Thermoelectrics... 4
1.4 Thesis Highlights and Contributions ... 6
1.5 Thesis Organization ... 6
Chapter 2 Related Work ... 7
2.1 Chapter 2 Introduction ... 7
2.2 Analysis of Pentium III Architecture... 7
2.2.1 Architectural Blocks, Description and Function... 8
2.3 Potential Hot-Spot Locations in Pentium III die... 12
2.3.1 Infrared Image of Processor die during Startup... 12
2.3.2 Infrared Image of Processor during Application Load ... 13
2.4 Introduction to Thermoelectrics... 14
2.5 Thermoelectric Effects... 14
2.6 Peltier Modules ... 17
2.7 Thermal Parameters and Equations ... 18
2.8 Thermoelectricity Theory of Solids ... 22
2.8.1 Origin of Charge Carriers ... 22
2.8.2 Mass Spring Model... 23
2.8.3 Phonons... 24
2.8.4 Phonon Scattering Mechanism to Lower Thermal Conductivity ... 25
2.9 RTI Thin-film Thermoelectrics... 27
2.9.1 Lattice Thermal Conductivity Reduction in Superlattice Structures ... 28
2.9.2 Mean Free Path Reduction... 29
2.9.3 Thermoelectric devices for Localized, Rapid Cooling ... 32
2.10 Summary ... 35
Chapter 3 Experimental Setup... 36
3.1 Chapter 3 Introduction ... 36
3.2 Simulated Aluminum Block 50Watt Load ... 37
3.3 Processor Cooling with Independent Peltier Module ... 39
3.4.1 Power Circuit for TFST module ... 41
3.4.2 TFST module Mounting ... 45
3.5 Chapter 3 Conclusion... 46
Chapter 4 LabView Monitor and Control Program... 47
4.1 Chapter 4 Introduction ... 47
4.2 Introduction to LabView... 48
4.3 Thermocouple Reader with SCXI-1112 ... 48
4.3.1 Front Panel Description ... 49
4.3.2 Block Diagram Description ... 52
4.4 Read Data and Write onto Spreadsheet ... 55
4.4.1 Front Panel Description ... 55
4.4.2 Block Diagram Description ... 58
Chapter 5 Tests, Results and their Analysis ... 60
5.1 Introduction to Chapter 5... 60
5.2 Forced Convection Air-cooling Extension. ... 61
5.2.1 Discussion of Results... 62
5.3 Simulated Aluminum Block 50-Watt load ... 64
5.3.1 Sample Calculations for Calorimetric Measurement... 66
5.3.2 Graphs and Discussion of Results... 66
5.4 Processor cooling with independent Peltier module... 69
5.4.1 Normal Clocking (860 MHz)... 70
5.4.2 Processor over clocking (995MHz) ... 73
5.5 TFST module testing... 75
5.5.1 TFST Module testing Analysis ... 78
5.6 Discussion of results ... 79
5.7 Chapter 5 Conclusion... 80
Chapter 6 Thesis Summary and Future Work ... 81
6.1 Thesis Summary... 81
6.2 Future Work... 82
Bibliography ... 83
List of Figures
Figure 1-1. Bulk and Thin-film comparison... 5
Figure 2-1.Micro architecture of the Intel Pentium III processor [3]. ... 8
Figure 2-2.IR image of processor die during startup [RTI]. ... 12
Figure 2-3.IR image of processor while loading an application [RTI]... 13
Figure 2-4. Cross-section of typical thermoelectric couple [4]. ... 15
Figure 2-5. Basic Thermocouple [6]... 16
Figure 2-6. Peltier Coefficient [6]... 16
Figure 2-7.Thomson Coefficient [6] ... 16
Figure 2-8 Peltier Module and its mechanism of heat transfer... 18
Figure 2-9. Lattice showing atomic substitutions [9] ... 23
Figure 2-10. Mass spring model of crystal [9]... 24
Figure 2-11. Lattice thermal conductivity and Average phonon mean free path (lmfp) Vs Superlattice period [2]... 29
Figure 2-12. Wave reflection at interface of Superlattice [10] ... 30
Figure 2-13. Low-frequency cut-off wavelength Vs Superlattice period [2] ... 31
Figure 2-14. Absolute cooling Vs Current [2]... 32
Figure 2-15. Current Vs Cooling power density [2] ... 33
Figure 2-16. Potential COP Vs ZT for various technologies [2] ... 33
Figure 2-17. Comparison of cooling time response of bulk and thin-film [2]... 34
Figure 3-1. 50-watt aluminum load setup... 38
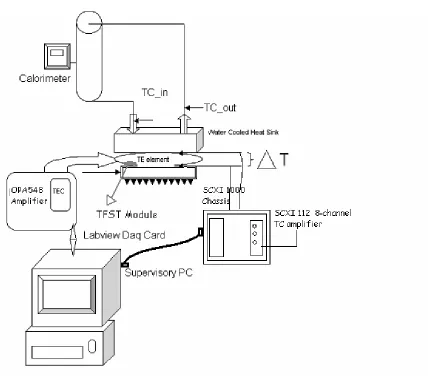
Figure 3-2. Final setup block diagram ... 41
Figure 3-3. PCB for Powering TFST module... 44
Figure 3-4. TFST module mounted onto Copper block... 46
Figure 4-1. Front Panel of Thermocouple Reader with SCXI-1112... 50
Figure 4-2. Block diagram of Thermocouple Reader with SCXI-1112... 53
Figure 4-3. Front Panel of Read data and write onto a spreadsheet. Vi ... 57
Figure 4-4. Block diagram of Read data and write onto a spreadsheet. Vi. ... 59
Figure 5-1. Combined plot of CPU temperatures as a function of time for varying frequencies ... 62
Figure 5-2 Normal processor clocking on-die and interface temperatures... 63
Figure 5-3. Schematic of convectional cooling extension using TEC... 64
Figure 5-4.TEC input Power VS Delta T across TEC. ... 66
Figure 5-5. Aluminum block load Vs. Delta T ... 67
Figure 5-6.Delta T across water Vs Total power dissipated... 68
Figure 5-7.COP and Power of TEC Vs Input load. ... 68
Figure 5-8. Processor on-die temperature Vs TEC input power (normal clocking)... 71
Figure 5-9. Processor power calculated vs TEC input power (normal clocking)... 72
Figure 5-10. Processor on-die temperature Vs TEC input power (over clocking) ... 73
List of Tables
Table 1. Measured values from simulated load tests ... 65
Table 2. Calculated values from simulated load tests... 69
Table 3. Measured values under processor normal clocking case ... 70
Table 4 Calculated values under processor normal clocking case... 71
Table 5. Measured values under processor over clocking case ... 73
Table 6. Calculated values under processor over clocking case... 74
List of Equations
Equation 1-1. Heat Dissipated by Heat sink [18] ... 2
Equation 2-1. Seebeck Coefficient [6]... 16
Equation 2-2. Kelvin Relation 1 [6]... 17
Equation 2-3. Kelvin Relation 2 [6]... 17
Equation 2-4. Hot side temperature of Thermoelectric [8]... 19
Equation 2-5. Heat released to the hot side [8]... 19
Equation 2-6 Temperature difference across thermoelectric [7] ... 20
Equation 2-7. Figure of merit of Thermoelectric [2] ... 20
Equation 2-8. Z material coefficient [2] ... 21
Equation 2-9. Expanded Z material coefficient [2] ... 21
Equation 2-10. Heat Pumping Capacity of Thermoelectric [8] ... 21
Equation 2-11. Heat dissipated by thermoelectric [8] ... 21
Equation 2-12 Coefficient of performance [8]... 22
Equation 2-13. Mean free path, Lattice thermal conductivity equation [10]... 30
Equation 2-14. Maximum heat pumping capacity of thermoelectric couple [2] ... 32
Equation 3-1.Voltage output from Op-Amp... 43
Equation 3-2. Current through Sense Resistor... 43
Equation 3-3. Current in terms of Vin ... 43
Equation 4-1. SCXI Temperature Sensor String Syntax ... 49
List of Symbols
•
Z
= material coefficient of Thermoelectric deg-1 (°C-1) •α
= Seebeck Coefficient volts/deg (V/°C)•
I
= Current Amps (A)•
∏
= Peltier coefficient volts (V)•
ζ
= Thompson coefficient deg (°C)•
T
h = Hot surface temperature deg (°C)•
T
c = Cold surface temperature deg (°C)•
Q
h = Heat released to the hot side of the thermoelectric watts (W) •Q
c= Heat absorbed from the cold side watts (W) •P
in = Electrical input power to the thermoelectric watts (W)•
θ = Thermal resistance of heat exchanger
deg/watts (°C/W) •∆
T
= Temperature difference across thermoelectric deg (°C) •T
= Absolute temperature Kelvin (°K) •ρ = Electrical resistivity
ohm-cm (Ω-cm) •K
T = Total thermal conductivity watt/cm-deg (W/cm-°C) •K
L = Lattice thermal conductivity watt/cm-Kelvin (W/cm-°K) •K
e= Electronic thermal conductivity watt/cm-Kelvin (W/cm-°K) •µ
= Carrier mobility cm2/Volts (cm2/Vs) •∂
= Carrier density (Carrier_Num x 1011 /cm2) •L
0= Lorenz number approximately 1.5 x 10⁻⁸ V2 °K-2•
q
= Electronic charge Coulombs (C)•
δ = Electrical conductivity
ohm-1-cm-1 (Ω-1cm-1) •C.O.P
= Coefficient of performance of thermoelectric•
lmfp
= Average phonon mean free path Armstrong (Ao )•
vt
= Average phonon velocity Armstrong/sec (Ao /sec) •PD
= Cooling power density watts/cm2 (W/cm2)•
Qm
= Maximum heat pumping watts (W)•
a
= Area of thermoelectric device (cm2)•
l
= Thickness of thermoelectric device (cm)•
N
= Number of couples in thermoelectric module•
h =
Heat transfer coefficient of heat sink Watts/cm2°C (W/cm2°C)•
a
= Area of heat sink (cm2)•
T
S = Heat sink temperature (°C)•
T
A = Ambient temperature (°C)•
Q
p=Heat pumping capacity ofThermoelectric cooling module watts (W) •
G
= Ratio of cross-sectional area/lengthof each thermoelectric element (cm) •
Q
te= Amount of heat dissipated by aGlossary of Important Terms [16]
ASPECT RATIO: The numerical ratio of the length (height) to cross-sectional area of a thermoelectric element. An element’s L/A aspect ratio is inversely proportional to its optimum current
CALORIMETER: A scientific apparatus used to measure the evolution or absorption of heat. A calorimetric system can be used to measure the heat dissipated by the Device Under Test (D.U.T)
COEFFICIENT OF PERFORMANCE (COP): A measure of the efficiency of a thermoelectric module, device or system. Mathematically, COP is the total heat
transferred through the thermoelectric device divided by the electric input power.
COLD SIDE OF A THERMOELECTRIC MODULE: The side of a module that normally is placed in contact with the object being cooled. When the positive and negative module leads are connected to the respective positive and negative terminals of a DC power source, the module’s cold side will absorb heat.
DELTA-T: The temperature difference between the cold and hot sides of a thermoelectric module. Delta T may also be expressed as "∆T"
EFFICIENCY: For thermoelectric coolers, mathematical efficiency is the heat pumped by a module divided by the electrical input power; for thermoelectric generators, efficiency is the electrical output power from the module divided by the heat input.
FIGURE-OF-MERIT (Z): A measure of the overall performance of a
HOT SIDE OF A THERMOELECTRIC MODULE: The face of a thermoelectric module that usually is placed in contact with the heat sink. When the positive and
negative module leads are connected to the respective positive and negative terminals of a DC power source, the module’s hot side will reject heat. Normally, the wire leads are attached to the hot side ceramic substrate.
JOULE HEATING: Heat produced by the passage of an electrical current through a conductor or material due to the internal resistance.
MODULE: A thermoelectric cooling component or device fabricated with
multiple thermoelectric couples that are connected thermally in parallel and electrically in series.
PELTIER EFFECT: The phenomenon whereby the passage of an electrical current through a junction consisting of two dissimilar metals results in a cooling effect; when the direction of current flow is reversed heating will occur.
SEEBECK EFFECT: The phenomenon whereby an electrical current will flow in a closed circuit made up of two dissimilar metals when the junctions of the metals are maintained at two different temperatures. A common thermocouple used for temperature measurement utilizes this principle.
THERMAL RESISTANCE (HEAT SINK): A measure of a heat sink’s
performance based on the temperature rise per unit of applied heat. The best heat sinks have the lowest thermal resistance.
THOMSON EFFECT: The phenomena whereby a reversible evolution or
Chapter 1
Introduction
1.1 Foreword
The last two decades have seen a steady increase in microprocessor performance as silicon technology continues to scale in accordance to Moore’s law [11]. The constant need for higher performance and an increased level of functional integration, as well as die size optimization has lead to preferential clustering of higher power units on the processor. This in turn leads to higher heat flux concentration in certain areas of the die and lower heat fluxes in certain other regions of the die, which manifest themselves as large temperature gradients on the die. These local power densities, commonly referred to as “hot spots”, are becoming increasingly important as we deal with emerging
generations of microprocessor architecture. The thermal designs have to meet stringent heat-flux requirements that are significant multiples of the average heat flux at the silicon-package interface [18]. The thermal cooling solution provided must effectively ensure that the junction/die temperature of the processor does not exceed the rated 90-110 °C range to guarantee device performance and reliability.
There are two major reasons to maintain the operating temperature of the processor below a critical level [18].
1. The reliability of circuits (transistors) is exponentially dependent on the operating temperature of the junction. Even small differences in operating temperature (order of 10–15°C) can result in a ~2X difference in the lifespan of the devices.
2. The other factor is the speed of the microprocessor. At lower operating temperatures, microprocessors can operate at higher speeds due to reduced gate delay. Another secondary effect of lower temperatures is related to a reduction in idle power dissipation (also known as leakage power) of the devices, which manifests itself as reduction in overall power dissipation.
1.2 Amount of Heat Transferred from Heat sink.
The amount of heat dissipated by a heat sink (Q in joules) is given by
(
T
sT
A)
A
h
Q
=
×
×
−
Equation 1-1. Heat Dissipated by Heat sink [18]
It is apparent from the equation that in order to increase the total heat transfer from the heat sink we must increase one or more of the parameters h, A, or Ts-Ta. In the past, forced convection air-cooling passed through extruded heat sinks with copper bases proved adequate to tackle such power densities. Presently with power densities exceeding 200 W/cm2 in approximately 16mm2 area on die, system design engineers are
investigating more efficient cooling solutions [15]. Furthermore thermal improvement better than 10% is unlikely by convection alone [11]. We shall now look at the various options available to the system designer to increase the heat transfer from the heat sink to the ambient and the problems concerning each of these options.
1.2.1 Increasing Surface area of Heat Sink
An increase in the heat-sink surface area, either by increasing the number of fins or by modifying the shape of the fins, increases the amount of heat that the heat sink can release to the ambient air stream [18]. However, increasing the heat-sink surface area results in an increase in the pressure drop across the heat sink. This is because the viscous shear stress acts over a larger area creating a larger frictional force. The system fan must be capable of generating a large enough pressure head to overcome the frictional
resistance to the flow of air across the heat sink.
1.2.2 Forced Convection Airflow
The heat transfer coefficient on the heat-sink fins depends primarily on the airflow rate, the spacing between the fins, and the flow regime (i.e., laminar or turbulent) that exists on the heat-sink fins. A higher airflow results in higher heat transfer
offset the contribution from the decreased fin area to provide the maximum heat transfer from the heat sink. Any increase in finned surface area or change in heat-sink base material from aluminum to copper results in an increase in the heat-sink weight.
1.2.3 Acoustics
Any enhancement to the heat transfer from the heat sink is usually accompanied by an increase in the pressure loss across the heat sink. In order to overcome the pressure loss, a larger fan may be required. Increasing the airflow rate to increase the heat-transfer coefficient may also require a larger fan. Increased flow rates and larger fans typically result in increased fan noise. Noise attenuation schemes and larger system fans add to the total cost of the cooling solution.
1.2.4 Heat Sink Temperature
The processor heat dissipation levels set the heat sink temperature and very rarely do cooling solutions control the sink temperature to aid more efficient heat transfer. In [Section 5.2] the thesis presents ways by which the heat sink temperature can be
increased by active cooling using thermoelectrics to enable more efficient heat transfer to the ambient. It also presents an effort to extend the performance of forced convection air-cooling to future generations of processors.
1.2.5 Heat Spreading.
1.3 Alternate Cooling Solutions
Several other possible cooling solutions can be implemented to solve these problems. These include
1. Circulated liquid cooling and refrigeration 2. Thermoelectrics.
We shall look into the pros and cons of these methods in the following subsections.
1.3.1 Circulated Liquid Cooling and Refrigeration [11]
This involves cooling the processor using water or refrigerant circulated through pipes and pumps. The main advantage of this method is that the heat sink is moved away from the processor and therefore the surface area can be increased. However, there is limited space within the chassis and the cost and reliability of such cooling methods is a big factor that needs to be considered.
Significant advancements have to be made in terms of more efficient and reliable pumps and compressors, Safe and reliable refrigerants with secure hoses and fittings and importantly the weight and cost of the equipment should be reduced before they can become a viable option.
1.3.2 Thermoelectrics
Microprocessor cooling using thermoelectrics offers several advantages over conventional cooling methods. Thermoelectric modules augment the cooling of electronic module packages to reduce chip operating temperatures at a given heat load [1] or allow higher module heat loads at a given chip temperature level. Thermoelectric cooling modules also offer the advantages of being compact, quiet, have no moving parts and a high degree of precise control over the amount of cooling by means of controlling the current supplied to the thermoelectric.
Bulk thermoelectrics used popularly for microprocessor cooling, are severely constrained by their Figure of merit ZT (~ 1.14 max) and their Coefficient of
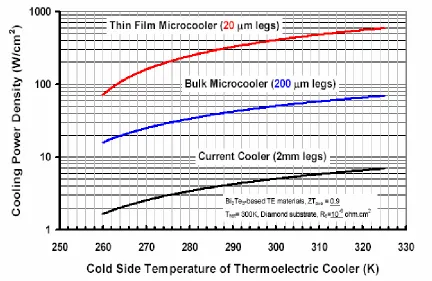
couple legs can only handle power densities of the order of 50W/cm2. In comparison, Thin-film Superlattice Thermoelectrics [TFST] have measured ZT values of ~2.4 at 300K for p-type superlattices, with potential to pump heat flux of up to 700Wcm-2.
Furthermore, these thin-film devices have fast response times, achieving steady state cooling in 15µs [2]. This is vital in preventing thermal runaway and subsequent failure of microprocessors during rapid load transients.
Figure 1-1. Bulk and Thin-film comparison
Vandersande &Fleurial, 15th International Con. On Thermoelectrics (1996)
The objective of this thesis is to apply TFST in efficient cooling of “hot-spots” on processors. The thesis presents an excellent test setup and experimental procedure, for characterization of the integrated TFST system. The tests performed evaluate the
1.4 Thesis Highlights and Contributions
In the following subsection, I have made an attempt to summarize the important contributions made during this thesis research, which are
• Developing a novel methodology for evaluation of the performance of TFST in cooling hot spots on processor surface.
• Monitoring the performance of the microprocessor under test under various magnitudes of cooling and presenting the results and analyses.
• Writing configuration and run specification files to generate test vectors in SPEC CPU 2000 benchmarks, which create constant processor load over multiple tests. • Building Modified Howland current source amplifier circuitry to power the TFST
module with analog input from the Controller PC.
• Building a comprehensive Lab view platform for monitoring the integrated TFST-processor system. The program also measures the increased reliability due to heat spreading by TFST modules, which are presented in the results and analyses.
• Presenting a study of thermoelectric theory, thin film and bulk thermoelectrics, Peltier module functioning in this document. I also present a brief look at TFST structures and the material physics behind their functioning.
1.5 Thesis Organization
Chapter 2 starts with the description of Intel Pentium III micro-architecture with IR images showing the hot spots on die and the theory behind their occurrence. The chapter then describes the theory of thermoelectrics and the work done by the
Chapter 2
Related Work
2.1 Chapter 2 Introduction
The chapter starts with the description of the Intel Pentium III micro-architecture and then moves onto Infrared [IR] images showing these hot spots and the theory behind their occurrence. I have made an attempt to understand the functioning of the processor under the two test cases and to analyze the causes for the images observed.
The focus of this work is to build a test platform for microprocessor cooling using TFST modules. Furthermore upcoming chapters will describe the test set-up and the various parameters that are monitored during the experiments. It is vital for the reader to be acquainted with thermoelectrics and the physical principles that govern their
functioning in order to understand the importance of these parameters and the objective behind the construction of this set-up. This chapter presents a brief discussion of thermoelectrics and the commercially available Peltier modules, used for multiple applications.
The thesis puts forth a novel concept of selective cooling of processor die using active thermoelectric components. This is made possible by the research conducted at RTI, which has resulted in efficient thermoelectrics with very small footprints. An insight into these superlattice structures, the scientific theory of solids that explains their high ZT values and a comparison with other state-of–the-art bulk devices is also presented at the end of the chapter.
2.2 Analysis of Pentium III Architecture
Figure 2-1.Micro architecture of the Intel Pentium III processor [3].
The processor under observation is the Intel Pentium III 850MHz microprocessor. The die has been fabricated using 0.18-micron CMOS process technology, with six metal buildup layers in its packaging. It has a normalized transistor count of 28.1 million transistors over a 106 mm square die-area.
2.2.1 Architectural Blocks, Description and Function
A review of the various architectural components of the processor as shown in is presented in this section [3]. I have attempted to describe their description and function and reasons why they could be potential hot spots during processor runtime.
L2 Cache: - The 256K Level 2 (L2) cache, occupies nearly 30% of the memory
IFU: - Instruction Fetch Unit. Instructions fetchand 16 K byte 4-way set
associative Level 1 (L1) instruction cache resides in this block. Instructions from the IFU are then forwarded into the Instruction Decoder (ID). Each instruction of an application has to pass through the IFU before it can be processed. Additionally, the presence of the L1 instruction cache makes the IFU a potential hot spot.
ROB: - Re-order Buffer. This supports a 40-entry physical register file that holds temporary write back results that have completed out of order. These results are then committed to a separate architectural register file during in-order retirement. The Reorder Buffer (ROB) in the processor, buffers the completed micro-ops, updates the architectural state in order and manages the ordering of exceptions.
BTB: - Branch Target Buffer. This block is responsible for dynamic branch prediction based on the history of past decision paths. The hardware instruction fetcher brings in instructions along the path predicted by the BTB into the streaming instruction buffers.
BAC: - Branch Address Calculator. Static branch prediction is performed here to handle the BTB missed case. If there was no valid entry in the BTB for the branch, the static predictor makes a prediction based on the direction of the branch. The static prediction mechanism predicts backward conditional branches (those with negative displacement), such as loop-closing branches, as taken whereas forward branches are predicted not taken.
TAP: - Test Accessibility Port. Various test and debug mechanisms reside in this block.
MS: - Micro code Sequencer. This unit holds the micro code ROM and sequencer for more complex instructions. The micro code update functionality is also located here.
RS: - Reservation Station. Micro-ops and source data are held here for scheduling and dispatch to the execution ports. Dispatch can happen out-of-order and is dependent on source data availability and on the availability of the execution port. The wake-up and select logic consumes a lot of power and hence this is a potential hot spot for all types of applications.
SIMD: - Single Instruction Multiple Data integer execution unit. As one of the three performance enhancements of Multimedia Extension (MMX), which are a set of 57 instructions that process video and sound components and enable a richer game playing and graphic design creation experience, SIMD lets one microinstruction operate at the same time on multiple data items. What usually requires a repeated succession of
instructions (a loop) can now be performed in one instruction. This is a potential hot spot for streaming applications.
MIU: - Memory Interface Unit. This is responsible for data conversion and formatting for floating point data types.
IEU: - Integer Execution Unit. This is responsible for ALU functionality of scalar integer instructions. Address calculations for memory referencing instructions are also performed here along with target address calculations for jump related instructions. This is a potential hotspot for integer applications that are compute-intensive.
PFAU: - Packed Floating point Arithmetic Unit. This contains arithmetic execution data-path functionality for SIMD-FP specific instructions.
ALLOC: - Allocator. The Alloc performs allocation of various resources such as ROB, MOB, and RS entries here prior to microinstruction dispatch.
RAT: - Register Alias Table. During resource allocation, the renaming of logical to physical registers is performed here.
MOB: - Memory Order Buffer. Acts as a separate schedule and dispatch engine for data loads and stores. Also temporarily holds the state of outstanding loads and stores dispatched until completion. This is a potential hot spot in memory intensive applications.
DTLB: - Data Translation Look-aside Buffer. Performs the translation from linear addresses to physical address required for support of virtual memory.
PMH: - Page Miss Handler. Hardware engine for performing a page table walk in the event of a TLB miss.
DCU: - Data Cache Unit. Contains the non-blocking (hit under miss) 16K Byte 4-way set-associative L1 data cache along with associated fill and write back buffering.
BBL: - Backside Bus Logic. Logic for interface to the backside bus for accesses to the external unified level two-processor cache.
EBL: - External Bus Logic. Acts as logic for interface to external front-side bus.
PIC: - Programmable Interrupt Controller. Local interrupt controller logic for multi-processor interrupt distribution and boot-up communication.
2.3 Potential Hot-Spot Locations in Pentium III die
Experiments to identify and isolate the hot spots were conducted by infrared imaging the processor die during operation. These experiments were conclusive in determining the area of these hot spots and their magnitude in terms of maximum
temperature reached. Analysis of the internal architecture (explained above) justified the occurrence of these hot spots during the experimental conditions
2.3.1 Infrared Image of Processor die during Startup
Figure 2-2.IR image of processor die during startup [RTI].
operating system (O/S) and the IFU is converting fetching and converting the instructions of the O/S into micro-ops for processing. The on-die thermal diode exceeds the rated temperature and causes the processor to shut down after a few seconds without completely loading the O/S.
2.3.2 Infrared Image of Processor during Application Load
Figure 2-3.IR image of processor while loading an application [RTI].
decoder are also seen to be at a higher temperature. This is because the O/S and other applications have already heated the processor core. However, when a new application is started, instructions from the new application are fetched and processed. The O/S
instructions for running the new application are being processed by these CPU
components. The on-die thermal diode reads temperatures over 119°C as shown by the IR image and shuts the processor down without completely loading the application.
2.4 Introduction to Thermoelectrics
Thermoelectric coolers are solid-state heat pumps used in applications where temperature stabilization, temperature cycling, or cooling below ambient are required. There are many products using thermoelectric coolers, including CCD cameras (charge coupled device), laser diodes, microprocessors, blood analyzers and portable picnic coolers [4].
Thermoelectrics can be used to heat and to cool, depending on the direction of the current. In an application requiring both heating and cooling, the design should focus on the cooling mode. Using a thermoelectric in the heating mode is very efficient because all the internal heating (Joulian heat) and the load from the cold side are pumped to the hot side. This reduces the power needed to achieve the desired heating.
2.5 Thermoelectric Effects
refrigerating effect occurs when electrons move to a higher energy level upon change of material. A reverse effect also occurs where electricity is generated from a circuit of dissimilar materials that are exposed to a temperature differential
(Seebeck Effect)[6].
Figure 2-4. Cross-section of typical thermoelectric couple [4].
The Peltier Effect is only one of the three thermoelectric effects, the other two are known as the Seebeck Effect and Thomson Effect. Whereas the last two effects act on a single conductor, the Peltier Effect is a typical junction phenomenon. The three effects are connected to each other by a simple relationship [6]. The Seebeck and Peltier
coefficients are called cross effects since they connect an electrical response to a thermal force or a thermal current to an electrical current. The cross effects are the basis for utilizing thermoelectric materials for energy conversion applications. The Seebeck coefficient indicates how large a voltage a material generates in a temperature gradient and the Peltier coefficient indicates how much heat passes through a material for a given current.
Figure 2-5. Basic Thermocouple [6]
Two different conductors, a & b have junctions at W and X. If a temperature difference T is created between W and X, a voltage difference V appears between the two b segments. Upon open circuit conditions, the Seebeck coefficient is defined as
dT
dV
ab
=
α
Equation 2-1. Seebeck Coefficient [6]
If W is hotter than X, a thermocouple ab would drive a clockwise current and is said to have a positive α. By contrast, if an imposed clockwise current (I) liberates heat at W and absorbs heat at X, then the thermocouple ab has a negative Peltier coefficient ∏. The rate of heat exchange at the junction is
∏
×
=
ab
I
Q
Figure 2-6. Peltier Coefficient [6]
If current is flowing and there is a temperature gradient, there is also a heat generation or absorption within each segment of the thermocouple because α is temperature dependant. The gradient of the heat flux is given by
ds
dT
I
ds
dQ
ζ
=
Figure 2-7.Thomson Coefficient [6]
dT
d
T
abb
a
ζ
α
ζ
−
=
Equation 2-2. Kelvin Relation 1 [6] And
∏
ab=
α
abT
Equation 2-3. Kelvin Relation 2 [6]
The last equation provides a fundamental link between thermoelectric cooling (∏) and thermoelectric power generation (α). Thermoelectric cooling and power generation require joining two different materials. Therefore it is ∏ and α of the thermocouple that matter in practice.
2.6 Peltier Modules
The typical thermoelectric module is manufactured using two thin ceramic wafers with a series of P and N doped bismuth-telluride semiconductor materials sandwiched between them. The ceramic material on both sides of the thermoelectric adds rigidity and the necessary electrical insulation. The N type material has an excess of electrons, while the P type material has a deficit of electrons. One P and one N make up a thermocouple, as shown in Figure 2-5. The thermoelectric couples are electrically in series and
Figure 2-8 Peltier Module and its mechanism of heat transfer.
A thermoelectric module can contain one to several hundred couples. As the electrons move from the P type material to the N type material through an electrical connector, the electrons jump to a higher energy state absorbing thermal energy (cold side). Continuing through the lattice of material, the electrons flow from the N type material to the P type material through an electrical connector, dropping to a lower energy state and releasing energy as heat to the heat sink (hot side).
The advantages of mechanical simplicity and suitability for small-scale applications are the principle reasons for selecting thermoelectric cooling instead of compressor-driven refrigeration for several applications. Refrigeration based on the Peltier effect is obtained by arranging a series of such thermoelectric cells in a horizontal array, which is then encased in plates made of an electrical insulator as shown in Figure 2-8. Each thermoelectric cell consists of a pair of dissimilar semi-conductors, which are connected by electrical conductors at either end. The requisite dissimilarity in semi-conductors is obtained not only by using dissimilar materials, but also by using different dopants. The tablet shaped component that is produced by this means is called a module or Peltier module.
2.7 Thermal Parameters and Equations
)
)(
(
hamb
h
T
Q
T
=
+
θ
Equation 2-4. Hot side temperature of Thermoelectric [8]
in c
h
Q
P
Q
=
+
Equation 2-5. Heat released to the hot side [8]
The thermal resistance of the heat sink causes the temperature to rise above ambient. If the thermal resistance of the heat sink is unknown, then estimates of acceptable temperature rise above ambient are:
• Natural Convection 20°C to 40°C • Forced Convection 10°C to 15°C
• Liquid cooling 2°C - 5°C (rise above the liquid coolant temperature) The main advantage of air-cooling is simplicity since only fins and a fan are required but the major disadvantage is reduced thermal efficiency. It is found that the poor thermal conductivity of air causes a high temperature to develop on the hot face and conversely a very low temperature on the cold face for even a moderate level of heat transfer [8].
The main advantage of using water-based cooling systems is that the Peltier module can work at a temperature difference that is far closer to the nominal temperature difference of the system. This is because the convective heat transfer coefficient between water and a solid interface is much higher than air for comparable flow conditions. The Peltier module is then able to work at close to its optimum thermodynamic efficiency thus reducing electricity consumption to practicable levels.
need to be colder than the desired temperature of the cooled object. This is especially true when the cold side is not in direct contact with the object, such as when cooling an enclosure.
The temperature difference across the thermoelectric (∆T) relates to Th and Tc according to Equation.
c
h
T
T
T
=
−
∆
Equation 2-6 Temperature difference across thermoelectric [7]
Estimating Qc, the heat load in watts absorbed from the cold side is difficult, because all thermal loads in the design must be considered. Among these thermal loads are:
• Active Thermal losses
o I2R heat load from the electronic devices
o Any load generated by a chemical reaction • Passive Thermal losses
o Radiation losses such as heat loss between two close objects at different temperatures
o Convection losses such as heat loss through the air, where the air is at a different temperature than the object
o Insulation Losses
o Conduction Losses such as heat loss through leads, screws, etc.
o Transient Load such as time required in changing the temperature of an object. This is related to the latent heat of the object
The performance of thermoelectric devices depends on the figure of Merit (ZT) of the material, given by
=
TK
T
ZT
α
2ρ
Z, the material coefficient, can be expressed as
+
=
e LK
K
Z
α
2σ
Equation 2-8. Z material coefficient [2] or as
+
∂
≅
K
q
L
T
Z
L0 2
µ
α
Equation 2-9. Expanded Z material coefficient [2]
In order to enhance the figure of merit (ZT), the Thermal Conductivity (KL) should be reduced more strongly than the carrier mobility (µ), while maintaining the same carrier density (∂) and absolute temperature (T).
The heat pumping capacity, Qp of a Thermoelectric-cooling module is given by
∆
−
−
=
K
TG
G
I
T
I
N
Q
p C T2
2
2
ρ
α
Equation 2-10. Heat Pumping Capacity of Thermoelectric [8]
The amount of heat, Qte, dissipated by a thermoelectric cooling module to perform the electronic pumping is given by
+
∆
=
I
T
G
I
N
Q
teρ
α
2
2
Equation 2-11. Heat dissipated by thermoelectric [8]
t p
Q
Q
COP
=
Equation 2-12 Coefficient of performance [8]
2.8 Thermoelectricity Theory of Solids
It is vital to make a distinction at the outset, between the properties of the lattice and the properties of the electrons. The lattice refers to the positions of the atoms themselves [9]. The atoms are not stationary, but are considered to move only very slightly compared to the distances between the atoms. This is to say that they vibrate about their average position, but the do not move throughout the crystal. Most of the electrons are considered localized, always remaining associated with the same particular atom. Localized electrons do not carry any current, even when a force is applied, and may be considered to be part of the lattice. Some of the electrons, however, are essentially "free" and have the ability to move throughout the solid. It is these "free" or valence electrons, which determine the ability of a material to carry an electrical current.
2.8.1 Origin of Charge Carriers
Thermoelectric energy conversion is the creation of charge carriers in insulators. Since insulators ideally have no charge carriers, any defects that are present can be said to be due to defects [9]. When a host atom is replaced by an atom with more valence
electrons than the host has, the extra electron is not needed for bonding and enters the next higher available energy state. There is some attraction between the negative electron and the positively charged donor atom left behind, but often the attraction is very weak and the electron is free to move throughout the crystal, much like the electrons in a metal.
called an acceptor. The hole is literally the absence of an electron in one of the bonds and often the attraction is very weak, allowing the hole to move freely from bond to bond throughout the crystal.
Figure 2-9. Lattice showing atomic substitutions [9]
Even in an otherwise perfect crystal, where all the bonds are exactly filled, electrons and holes are created thermally. A few electrons in the bonding states will occasionally acquire enough energy to leave the bonding state (leaving behind a hole) and enter one of the anti-bonding states (creating a free electron). These electron-hole pairs are constantly being created and destroyed. There are several other mechanisms to create free charges or holes other than the simple substitution of dopants just described. Defects such as the absence of atoms (vacancies) or extra atoms occupying positions between the usual lattice sites (interstitials) can also create carriers. The precise origin of free charge carriers varies greatly from material to material and the control of doping levels is a major technical challenge.
2.8.2 Mass Spring Model
In the undisturbed lattice the atoms would be regularly spaced apart with a distance corresponding to a unit cell repeat distance. In fact the atoms will vibrate about their equilibrium positions due to thermal agitation. This motion is not entirely random, however, since the movement of one atom stretches or compresses the springs connecting it to neighboring atoms.
Figure 2-10. Mass spring model of crystal [9]
2.8.3 Phonons
Vibrations, even if initiated at a single atom, will propagate throughout the crystal. Rather than describing the vibrations of the each atom individually, it has been found to be both more convenient and more accurate to speak about regular, sinusoidal disturbances of entire groups of atoms. Such a sinusoidal disturbance is called a phonon. The word phonon means "particle of sound" and is used because sound is precisely an elastic wave of compression and extension which propagates through a solid.
Since a collection of phonons can represent any possible configuration of
phonon will carry a momentum given by h/L, where h is the Plank's constant. This principle, first described by de Broglie, assigns a phonon wavenumber, defined by 2∏/L. Since there is a minimum allowed wavelength, there is also a maximum allowed
momentum (h/a) and a maximum allowed wavenumber (2∏/a). The energies of the allowed phonons vary with the direction the phonon moves through the crystal and the momentum (or wavelength) of the phonon [10].
2.8.4 Phonon Scattering Mechanism to Lower Thermal Conductivity
The previous discussion referred to photons as a wave propagating through the crystal. The particle-wave duality of Quantum Mechanics can also let us envision the phonon as a particle moving through the crystal. Any mechanism that absorbs the energy of the phonon or changes the phonon’s direction of propagation is called scattering. Since heat is carried by the phonons, scattering mechanisms that impede the flow of phonons effectively reduce the thermal conductivity. Scattering mechanisms return the distribution function from the state of nonequilibrium to equilibrium values [12]. We shall now look into the different phonon- scattering mechanisms.
2.8.4.1 No Scattering
If the scattering rate were truly and exactly zero, then once a phonon-heat current was established (for example) the heat or phonon current would continue to flow to the end of the solid, even after the temperature gradient was removed. This situation is sometimes said to imply very high thermal conductivity, limited only by the speed of propagation of phonons and is not observed practically.
2.8.4.2 Phonon-Phonon Scattering
phonons around. In the quantum mechanical picture of phonons, this type of phonon-phonon scattering is described as the absorption or emission of one phonon-phonon by another phonon.
2.8.4.3 Point Defect and Alloy Scattering
A point defect simply means that one of the atoms making up the crystal is different from all of the others. The most important type of point defect in thermoelectric materials is usually an atom with a mass very different from the host.
2.8.4.4 . Phonon-electron (or Hole) Scattering
The shift in the electronic energy levels due to a small deformation of the lattice is called the deformation potential and this provides a link between the system of charge carriers and the system of phonons. Through this interaction, a phonon may deposit its energy and momentum into one of the charge carriers. Or, a charge carrier can lose energy and momentum, creating a phonon. In either case, both the phonon and the charge carrier are scattered.
Conservation of energy and momentum considerations severely restrict which phonons can interact with which charge carriers. Very low energy, long wavelength phonons can interact with essentially all the charge carriers. But above certain phonon energy, there are essentially no charge carriers around to interact with. So, the phonon-electron (or hole) scattering mechanism is much more effective at scattering low energy, long wavelength phonons than it is at scattering high energy, short wavelength phonons.
2.8.4.5 . Electronic Energy Bands
As more and more atoms are brought together, the atomic energy levels become more and more mixed, but each energy level in the original isolated atoms is still represented in the final energy state-scheme. The individual energy levels of each atom form bands of allowed energies in the final solid.
We discuss the properties in terms of equilibrium and nonequilibrium conditions. The energy states outlined above, which were occupied in equilibrium, become
unoccupied and states that were unoccupied become occupied with disturbance.
Equilibrium distribution functions provide a statistical probability that a particular energy state is occupied. Such occupation changes transcend as waves moving to the right or left of the lattice.
In equilibrium there are no currents since there are just as many waves moving to the right as are moving to the left. By definition, a current means there are more waves moving in one direction than are moving in the opposite direction. For each energy level, then, there is an average time between changes of occupancy. This time is called the mean free time and is usually represented by the Greek letter Tau [τ]. When speaking of a wave (either a phonon or a charge carrier), this is the average time the wave moves until it hits something or otherwise changes into some other type of wave. The same quantity is also called the relaxation time or the collision time. The inverse, τ-1, is called the collision rate or scattering rate.
2.9 RTI Thin-film Thermoelectrics
A material with a figure of merit of around unity was first reported over four decades ago [2]. Since then, despite investigation of various approaches, there has been only modest progress in finding materials with enhanced ZT values at room temperature.
RTI reports thin-film thermoelectric materials that demonstrate a significant enhancement in ZT at 300 K, compared to state-of-the-art bulk Bi2Te3 alloys. A ZT at 300 K of 2.4 in p-type Bi2Te3/Sb2Te3 superlattices and a similar, although less dramatic, ZT<1.4 in n-type Bi2Te3/Bi2Te2.83Se0.17 superlattices has been measured. The
enhancement in short, is achieved by controlling the transport of phonons and electrons in the superlattices [2].
Preliminary devices fabricated exhibit significant cooling at around room
temperatures and the potential to pump a heat flux of up to 700Wcm-2. Furthermore, the localized cooling and heating occurs some 23,000 times faster than in bulk devices [2]. Generic approaches proposed till date, to enhance ZT in thermoelectrics involve the use of quantum-confinement effects to obtain an enhanced density of states near the Fermi energy. Using such effects, a ZT of 0.9 at 300 K and 2.0 at 550 K, using estimated thermal-conductivity values, has been reported in PbSe0.98Te0.02/ PbTe quantum-dot structures [2].
The second approach involves phonon-blocking/electron-transmitting
superlattices. These structures utilize the acoustic mismatch between the superlattice components to reduce KL rather than using the conventional alloying approach, thereby potentially eliminating alloy scattering of carriers. The third thin-film approach is based on thermionic effects in heterostructures. The second approach of
phonon-blocking/electron-transmitting superlattice structures forms the basis of the Thermoelectric research at RTI. We shall look into this in greater detail.
2.9.1 Lattice Thermal Conductivity Reduction in Superlattice Structures
strongly than the electrical conductivity so that an overall enhancement in Z can be achieved for certain alloy compositions.
Figure 2-11. Lattice thermal conductivity and Average phonon mean free path (lmfp) Vs Superlattice period [2]
The variation of the lattice thermal conductivity (KL) as a function of the superlattice period is shown in Figure 2-11. Three points are worth noting:
• The KL of the superlattice structures shows a minimum for a period of 50 Å. The minimum KL value is 0.22 W/m °K. This value is nearly a factor of 2.2 smaller than that obtained for solid-solution alloys.
• The KL of larger-period superlattices exceeds that of the solid-solution alloy but begin to approach that of a weighted average of Bi2Te3 (KL = 1.05 W/m °K) and Sb2Te3 (KL = 0.96W/m °K).
• For superlattice periods of 50Å, KL begins to increase from the above minimum and starts approaching that of the solid-solution alloy.
2.9.2 Mean Free Path Reduction
lmfp
vt
c
K
L=
1
3
ρ
(
)
Equation 2-13. Mean free path, Lattice thermal conductivity equation [10]
For example, in Sb2Te3 an estimated lmfp of 9.6 Å from its KL is measured. The value of 9.6 Å is due to the potential anharmonicity along the axis of heat flow, created by the repeat spacing of bonds in the crystal. Similarly, for the BiSbTe3 alloy film, an estimated lmfp of 4.9 Å from its measured KL. For superlattices with the lowest KL, lmfp value of 2.2 Å is obtained. The coherent backscattering of phonon waves at the
superlattice interfaces, which are essentially the regions of anharmonicity, is invoked to formulate a physical model for the reduction of lmfp, [12].
Figure 2-12. Wave reflection at interface of Superlattice [10]
the acoustic mismatch would lead to reflection of the phonon waves at the interface. Thus, in a superlattice, the acoustic long-wavelength phonons not only ‘‘see’’ the varying composition (as much in the random alloy) but also experience reflection at the periodic interfaces.
Figure 2-13. Low-frequency cut-off wavelength Vs Superlattice period [2]
The behavior of ultra short period superlattices can be understood by computing the wavelengths using the phase velocity for the cutoff frequencies. The cutoff
Figure 2-14. Absolute cooling Vs Current [2]
With an ambient temperature Tambient of about 298 °K, 32.2 °K of cooling (down to -7°C) was measured without any forced heat removal by blowing air or running water at the heat sink. In the linear regime (current < 1 A) where heat-sinking considerations are less, the superlattice device shows a factor of 2.2 cooling compared to bulk. Further 40°K of cooling is observed for the superlattice device, when the heat sink is maintained at 353°K using a large-wattage heater, equivalent to a semi-infinite heat source. This is analogous to cooling the heat-sensitive devices in regions adjacent to hotspots in a chip.
2.9.3 Thermoelectric devices for Localized, Rapid Cooling
Thin-film thermoelements lead to cooling of large power densities (PD) for similar maximum heat pumping (Qm). As the area of the device, a, is reduced proportional to its thickness l, Qm is unaffected. However, cooling power density (PD ~ Q/a) is increased.
( )
{
[
cold side]
[
T(
hot side cold side)
]
}
m
a
l
T
K
T
T
Q
=
0
.
5
α
2 2 −/
ρ
−
−−
−Figure 2-15. Current Vs Cooling power density [2]
In addition to offering low ZT, which translates to low coefficient of performance (COP) in refrigeration, the bulk thermoelectric devices have low PD (~1Wcm-2), another disincentive for high-power electronics & microprocessor applications. Using the values of KT and α of the superlattices, available PD as a function of current is shown in Figure 2-15. PD is estimated to be a value 700Wcm-2 at 353°K and 585Wcm-2 at 298°K at the measured maximum cooling in superlattice devices compared to a value of 1.9Wcm-2 in the bulk device
The effect of higher ZT on COP is shown in Figure 2-16. The translation of the device ZT to COP of refrigeration would involve efficient heat removal at the heat sink, reduction of thermal resistances at the interface between the active device and the two heat-spreaders, and the fabrication of p-n couples with minimal interconnect resistances.
The thin-film devices also allow the concept of localized cooling by matching the footprint of the refrigeration devices to that of thermal load. This is made feasible by the combination of microelectronic processing and the ability to place the thermoelectric devices at points of interest to provide cooling power where required. Furthermore TFST elements are fast acting–about 23,000 times faster than bulk devices. The thin-film device achieves steady state cooling (indicated by the development of cooling-induced Seebeck voltage) in 15ms, while the bulk thermoelement takes about 0.35 s. This is a result of the response time associated with the transport of heat through the thin-film (micrometers) rather than through the millimeters associated with bulk devices.
Figure 2-17. Comparison of cooling time response of bulk and thin-film [2]
2.10 Summary
On studying the micro-architecture of the Pentium III processor, we identify the Instruction Fetch Unit, the Reservation Station and the Single Instruction Multiple Data integer execution unit as potential hot spots on the processor die. This is due to the dynamic nature of the input to the cache and the frequent change in stored values, especially during streaming applications, which require repeated succession of instructions to be performed. The IR images taken during processor startup and
application load were conclusive in determining the area of the hot spot and its magnitude in terms of maximum temperatures reached.
We then looked at the physical principles governing the operation of
thermoelectrics such as Seebeck, Peltier and Thompson effects. Next part of the section dealt on the thermal parameters and the equations to determine their values. We looked at the thermoelectric theory of solids and the mass spring model, which explains the
Chapter 3
Experimental Setup
3.1 Chapter 3 Introduction
The main objective of the experimental set-up is to show the possibility of hot spot cooling of microprocessors. My procedure to achieve this end is as follows.
• The primary step is to identify the hot spot, its size, location and the magnitude of the maximum temperature reached at the spot. We have already discussed this in Section 2.3.1 and Section 2.3.2 from Chapter 2.
• It is vital to have a measure of the processor power dissipation when it is running the SPEC CPU 2000 benchmarks. It is relatively easy to monitor the voltage supplied to the processor. Several software modules including ASUS probe, supplied by the
motherboard manufacturer is capable of doing this. However it is more difficult to monitor or measure the current drawn by the processor, with which power is computed. • I have adopted an indirect method of measurement to monitor the power dissipated by
the processor. By measuring the heat absorbed by the cooling system, we can
approximately calculate the heat dissipated by the processor. We build a calorimetric system, which cools the processor by circulating water to measure the heat dissipated. We shall look at this in greater detail in subsequent Section 3.2
• The next step is to verify the accuracy of the calorimetric system by comparing its result with a known load. We do this by substituting the processor with a 50-watt aluminum heater load and supplying it with a known measure of power
• A big factor in this measurement is the heat loss to the ambient air by convection or other methods, which is not accounted for by the system. To reduce this error we insulate the system such that there is minimum loss to the environment and all cooling occurs only through the water that is circulated. We can now safely assume that heat loss to the ambient is zero.
• Once we have calibrated the accuracy of the system, we can swap the simulated load with the actual processor load and measure the heat dissipated by the processor. This is done before the TFST module is integrated into the system as this might lead to
• The last step in the setup in the design is to integrate the TFST module at the hot spot and to have an accurate measure of processor’s performance and the performance of the system as a whole.
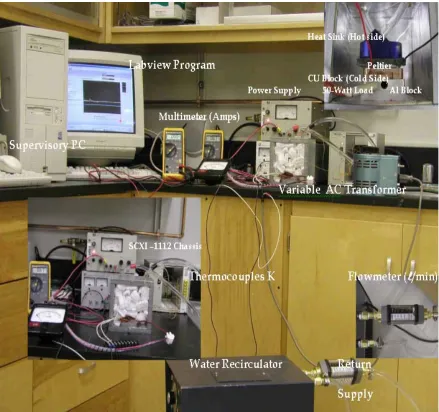
3.2 Simulated Aluminum Block 50Watt Load
The main part of the experimental setup is the Swiftech MCW5000-PT water- cooled thermoelectric assembly, used as a heat sink to cool the aluminum load. The 226-watt, (25Amp at 12 V) Peltier-cooling module was capable of dissipating the heat from the test Intel Pentium processor. The measured ZT of the Peltier module was ZT = 0.75. The Peltier cooler was powered by an independent power supply which allows us to accurately determine the power required to cool the processor at varying load conditions and with localized hot-spot cooling using TFST module.
An aluminum block of ½ inch thickness was designed to simulate the processor. A 0.375” diameter hole was drilled into the block to house a 50watt, 125volt resistive load element. The resistive load was then powered by a variable AC transformer and was used to generate load values ranging from 3watts to 54watts simulating the processor output under various usage and stress percentages.
Figure 3-1. 50-watt aluminum load setup
The entire system was then housed inside an aluminum chassis (as seen on the figure in the top right corner in Figure 3-1) with Styrofoam insulation on the sidewalls and surrounding the system. This ensures minimal heat loss to the ambience and substantiates the argument that the heat dissipated by the cooling water was the same as the heat output by the Aluminum block and the Peltier system.
• The next step was to place thermocouples at the vital points to determine the temperatures at those junctures.
![Figure 2-1.Micro architecture of the Intel Pentium III processor [3].](https://thumb-us.123doks.com/thumbv2/123dok_us/1326405.1165545/23.612.115.499.85.358/figure-micro-architecture-the-intel-pentium-iii-processor.webp)
![Figure 2-2.IR image of processor die during startup [RTI].](https://thumb-us.123doks.com/thumbv2/123dok_us/1326405.1165545/27.612.90.524.254.579/figure-ir-image-processor-die-during-startup-rti.webp)
![Figure 2-3.IR image of processor while loading an application [RTI].](https://thumb-us.123doks.com/thumbv2/123dok_us/1326405.1165545/28.612.88.524.232.549/figure-ir-image-processor-loading-application-rti.webp)
![Figure 2-5. Basic Thermocouple [6]](https://thumb-us.123doks.com/thumbv2/123dok_us/1326405.1165545/31.612.200.419.73.191/figure-basic-thermocouple.webp)
![Figure 2-9. Lattice showing atomic substitutions [9]](https://thumb-us.123doks.com/thumbv2/123dok_us/1326405.1165545/38.612.171.437.136.343/figure-lattice-showing-atomic-substitutions.webp)
![Figure 2-13. Low-frequency cut-off wavelength Vs Superlattice period [2]](https://thumb-us.123doks.com/thumbv2/123dok_us/1326405.1165545/46.612.156.455.185.390/figure-low-frequency-cut-wavelength-vs-superlattice-period.webp)