COBURN, JONATHAN DAVID. Erosion Characterization of Advanced Plasma Facing Materials (PFMs) for Magnetic Fusion Reactors (Under the direction of Dr. Mohamed Bourham and Dr. John Gilligan).
Plasma-facing materials in future large-scale fusion reactors must be designed to withstand high heat fluxes from extreme off-normal events such as edge localized modes and unmitigated plasma disruptions. The erosion rates of possible tungsten-alternative materials were tested under high heat flux conditions in the DIII-D National Fusion Facility and the electrothermal (ET) plasma source facility at Oak Ridge National laboratory. The plasma-facing materials of interest
are high-purity β-3C CVD silicon carbide and MAX phase ceramics Ti3SiC2 and Ti2AlC. A new analysis method was developed to characterize net erosion using a combination of focused ion beam microscopy, scanning electron microscopy, and atomic force microscopy. SiC and Ti3SiC2 were exposed to both L- and H-mode plasma discharges in the DIII-D divertor using the DiMES probe. Samples survived average heat fluxes of 2 – 10 MW/m2 over 16 seconds. The new micro-trench erosion measurement technique measured Ti3SiC2 and SiC erosion rates of 0-9 nm/s and 27-73 nm/s, respectively. Additionally, average ion impact angle estimates for an incident B-field angle of ~1.5° from surface parallel were made using micro-trench impact patterns. Measurements ranged from θ = 24º - 34º with respect to Bt and φ = 51.5º - 55º below the surface normal. Samples
of SiC, Ti3SiC2 and Ti2AlC were exposed to the ET plasma source along-side tungsten and monocrystalline silicon. Samples experienced heat fluxes of 0.9 – 1 GW/m2 from single and multiple 1 ms plasma discharges. Tungsten samples exhibited pronounced melt-layer formation and deformation, with measured molten pits 2 – 10 μm in diameter and melt-layer depths of up to
7 μm deep. Surface erosion rates for Ti3SiC2 and Ti2AlC ranged from 80 – 775 μm/s and 85 – 470
μm/s, respectively. Both MAX phases exhibited extreme surface fracture and material ejection, with damage depths past 4 μm for Ti2AlC and 11 μm for Ti3SiC2. SiC displayed the best performance, in one case surviving 15 consecutive ET plasma exposures of about 0.9 GW/m2 heat flux with an average erosion rate of about 26 μm/s and no surface fracturing. SiC erosion rates ranged from 23 – 128 μm/s. Comparing material performance across both experiments, high-purity
Reactors
by
Jonathan David Coburn
A dissertation submitted to the Graduate Faculty of North Carolina State University
in partial fulfillment of the requirements for the degree of
Doctor of Philosophy
Nuclear Engineering
Raleigh, North Carolina 2018
APPROVED BY:
_______________________________ _______________________________ Dr. Mohamed Bourham Dr. John Gilligan
Committee Co-Chair Committee Co-Chair
_______________________________ _______________________________ Dr. Igor Bolotnov Dr. K. Linga Murty
ii DEDICATION
iii BIOGRAPHY
Jonathan David Coburn is a resident of Raleigh, North Carolina, and formerly from Washington, North Carolina. He received a Bachelors of Science in Nuclear Engineering in May of 2013, followed by a Masters of Nuclear Engineering in December of 2013, at North Carolina State University. Jonathan has been involved in numerous research projects throughout his academic career, starting as a nuclear physics undergraduate researcher at NC State. That research opportunity led to internships at GE Hitachi, Sandia National Laboratories, and eventually US ITER and Oak Ridge National Laboratory which inspired this dissertation work. Notable research topics from his academic experience, outside of the dissertation research, include ultra-cold neutron sources, pyrochemical reprocessing of spent fuel, fission chambers, arc-jet plasma
thrusters, and disruption mitigation system modeling.
Jonathan Coburn is currently a graduate student subcontractor in the Fusion and Materials
iv ACKNOWLEDGMENTS
I wish to express my extreme gratitude for Dr. Mohamed A. Bourham. Dr. Bourham has been my graduate advisor throughout my time at North Carolina State University, and was invaluable in shaping my academic career path. He is a one-of-a-kind professor, inspiring, encouraging, and always willing to address any problems his students are facing. I’m particularly thankful for the encouragement he has constantly provided. Whether it was for a class research project or a dissertation experiment, if there was a desire to pursue it, Dr. Bourham would always encourage me to do so and provide guidance to make it happen. I am truly grateful for his
dedication, support and inspiration through my entire experience as a Nuclear Engineering student at NC State.
There are many other researchers and scientists I wish to acknowledge for making this collaborative dissertation research possible. Firstly, I am thankful to Dr. Ezekiel Unterberg from Oak Ridge National Laboratory (ORNL) for serving as a technical consultant on my dissertation committee. Dr. Unterberg’s willingness to take me on as a graduate student at ORNL, and his
guidance through the many experiments that were made possible, is truly appreciated. It was an invaluable experience being able to conduct plasma exposure experiments at ORNL and the DIII-D National Fusion Facility alongside leading researchers in the fusion community. I also wish to thank Dr. Chad Parish at ORNL for his mentorship in materials science and microscopy. Dr. Parish provided countless hours of time aiding me with and training me on the microscope resources available at ORNL. Most of the post-experiment material analysis done for this dissertation was only possible thanks to his service.
I wish to acknowledge Dr. Joseph Barton for serving as the primary author for DIII-D experiment proposal 52-02. I am grateful for his willingness to lead the experiment and for his assistance in analyzing and interpreting the results. I also wish to acknowledge Dr. Trey Gebhart at ORNL for his willingness to conduct the electro-thermal exposure experiments using his ET plasma source. Dr. Gebhart’s aid was invaluable in planning and executing the multiple ET
v providing the material samples used in this research. Finally, I want to extend a special thanks to Dr. David Rasmussen at US ITER for providing me my first avenue for conducting fusion research
at ORNL. His guidance and encouragement, along with the opportunities provided to converse with other researchers in the fusion community, laid the groundwork for what would eventually become my dissertation.
This dissertation material is based upon work supported by the U.S. Department of Energy, Office of Science, Office of Fusion Energy Sciences, using the DIII-D National Fusion Facility, a DOE Office of Science user facility, under Awards DE-FC02-04ER54698. It is also supported by the DOE via UT Batelle, LLC Subcontract 4000145506. Academic support was received through the GAANN Fellowship awarded to Jonathan Coburn (P200A150035). DIII-D data shown in this paper can be obtained in digital format by following the links at https://fusion.gat.com/global/D3D_DMP. This work was performed in part at the Analytical Instrumentation Facility (AIF) at North Carolina State University, as well as the Low Activation Materials Development and Analysis (LAMDA) laboratory at Oak Ridge National Laboratory.
Disclaimer: This report was prepared as an account of work sponsored by an agency of the United States Government. Neither the United States Government nor any agency thereof, nor any of their employees, makes any warranty, express or implied, or assumes any legal liability or responsibility for the accuracy, completeness, or usefulness of any information, apparatus, product, or process disclosed, or represents that its use would not infringe privately owned rights. Reference herein to any specific commercial product, process, or service by trade name, trademark,
vi TABLE OF CONTENTS
LIST OF TABLES ... viii
LIST OF FIGURES ... ix
Chapter 1 – Introduction ... 1
1.1 – Introduction ... 1
1.2 – Background on Tokamak Devices ... 2
1.3 – Current Fusion Reactor Materials ... 7
1.4 – Purpose of Study ... 9
References ... 11
Chapter 2 – Erosion Mechanisms of Plasma Facing Materials ... 12
2.1 – Physical Sputtering ... 13
2.1.1 – The Plasma Sheath ... 15
2.2 – Melting and Boiling ... 18
2.3 – Sublimation ... 20
2.4 – Other Erosion Mechanisms ... 22
References ... 24
Chapter 3 – Abnormal Events: Disruptions and Edge Localized Modes ... 26
3.1 – Disruptions ... 26
3.1.1 – Causes of Disruptions ... 27
3.1.2 – Impact of Disruptions ... 32
3.2 – H-mode and ELMs ... 35
3.2.1 – Types of ELMs ... 38
3.2.2 – Summary of ELM Control Methods ... 39
3.3 – Behavior Expected on Future Tokamak Reactors ... 40
References ... 43
Chapter 4 – Alternative Plasma Facing Materials for Next Gen Tokamak Reactors ... 45
4.1 – Silicon Carbides ... 45
4.1.1 – Monocrystalline and Polycrystalline SiC ... 46
4.1.2 – SiC/SiC Composites... 47
4.2 – MAX Phase Ceramics ... 48
4.2.1 – Ti3SiC2 and Ti2AlC ... 50
References ... 52
Chapter 5 – Methods of PFM Erosion Studies ... 53
vii
5.2 – DIII-D National Fusion Facility... 60
5.2.1 – Background on DIII-D ... 60
5.2.2 – DiMES Experiment on DIII-D ... 61
5.2.2.1 – Experimental Method... 62
5.2.2.2 – MATLAB Modeling for Preliminary DiMES Experiment ... 65
5.2.2.3 – Preliminary DiMES Experiment on DIII-D ... 69
5.3 – Electrothermal Plasma Sources... 73
5.3.1 – Background on Electrothermal Plasmas ... 73
5.3.2 – ET Experiment at Oak Ridge National Laboratory ... 79
5.3.3 – ETFLOW Simulations ... 82
References ... 84
Chapter 6 – Results of PFM Erosion Studies ... 88
6.1 – DIII-D Experiment ... 88
6.1.1 – Experiment Details... 88
6.1.2 – Micro-trench Erosion Rates ... 93
6.1.3 – Average Ion Impact Angles ... 97
6.1.4 – Summary ... 99
6.2 – Electrothermal Plasma Source Experiment ... 100
6.2.1 – Experiment Details... 100
6.2.2 – Heat Flux Analysis ... 105
6.2.3 – Microscopy Analysis – Silicon ... 114
6.2.4 – Microscopy Analysis – Tungsten... 117
6.2.5 – Microscopy Analysis – Ti3SiC2 ... 122
6.2.6 – Microscopy Analysis – Ti2AlC ... 129
6.2.7 – Microscopy Analysis – Silicon Carbide ... 134
6.2.8 – Combined Erosion Results and Discussion ... 138
6.3 – ETFLOW Simulations ... 143
6.3.1 – Ablation Simulations Without Vapor Shielding ... 143
6.3.2 – Ablation Simulations With Vapor Shielding ... 145
References ... 149
Chapter 7 – Discussion and Conclusion ... 150
7.1 – DIII-D Experiment (Physical Sputtering Regime) ... 150
7.2 – ET Experiment (Melting/Sublimation Regime) ... 153
7.3 – Overall PFM Performance ... 157
7.4 – Final Remarks and Future Work Suggestions ... 161
References ... 164
viii LIST OF TABLES
Table 5.1 Ideal shot plan for experiment 52-02 ... 65
Table 6.1 Average ion impact angle estimations ... 99
Table 6.2 Final ET experiment shot plan ... 105
Table 6.3 Summary of measured sample emissivities ... 106
Table 6.4 Ablation constant values from ETFLOW simulations w/o vapor shielding ... 144
Table 6.5 Efficiency ratio results for ETFLOW simulations with vapor shielding ... 147
Table 7.1 Ranking of material performance during DIII-D experiment ... 153
Table 7.2 Ranking of material performance during ET experiment ... 156
ix LIST OF FIGURES
Figure 1.1 Schematic of a tokamak magnetic field configuration ... 3
Figure 1.2 Plasma particle motion in toroidal field configurations ... 4
Figure 1.3 Interior of JET tokamak and cross section of diverted tokamak plasma ... 5
Figure 1.4 Performance comparison between tokamaks, accelerators, and transistors ... 6
Figure 1.5 The ITER tokamak design ... 7
Figure 1.6 Sample PFM erosion rate comparison ... 10
Figure 2.1 Physical sputtering yield for Be, C, and W by D and self-sputtered ions... 15
Figure 2.2 Zones of charge balance within the plasma sheath ... 16
Figure 2.3 Zones of the plasma sheath in the presence of an oblique B field ... 17
Figure 2.4 Computed ion trajectories with varying initial velocity distributions ... 18
Figure 2.5 Examples of melting and vaporization in W... 19
Figure 2.6 Temperature vs energy change ... 21
Figure 3.1 Sequence of disruption events ... 28
Figure 3.2 Plasma parameters during a theoretical disruption on ITER ... 28
Figure 3.3 Kink and tearing mode instabilities ... 31
Figure 3.4 Power density on JET divertor during a disruption ... 33
Figure 3.5 Simulation of ITER vertical instability ... 34
Figure 3.6 Chart of different modes of confinement ... 36
Figure 3.7 ELMs on MAST ... 37
Figure 3.8 Peeling/Ballooning stability limit and variation of stability boundaries ... 38
Figure 4.1 Crystal structure of silicon carbides ... 47
Figure 4.2 Atomic structure of MAX phase ceramics ... 49
Figure 5.1 Example 10 x 10 micro-trench for DIII-D experiments ... 55
Figure 5.2 Example 10 x 12 micro-trench for ET experiments... 55
Figure 5.3 Schematic of micro-trench edge ... 56
Figure 5.4 AFM tapping mode and probe tip ... 58
Figure 5.5 Example AFM data for FIB tungsten sample ... 59
Figure 5.6 Modified AFM tips ... 60
Figure 5.7 DiMES probe assembly ... 63
Figure 5.8 DiMES surface temperature estimations ... 64
Figure 5.9 Example micro-trench geometries in MPR-Trench ... 67
Figure 5.10 Ion impact angle distribution functions ... 68
Figure 5.11 Sample map for preliminary DiMES experiment ... 70
Figure 5.12a Preliminary experiment micro-trench cluster, unexposed ... 71
Figure 5.12b Preliminary experiment micro-trench cluster, exposed ... 71
Figure 5.13 Square micro-trench from preliminary experiment, post-exposure ... 73
Figure 5.14 Layout of typical ET discharge system ... 74
x
Figure 5.16 Electrical system for ORNL ET source ... 80
Figure 5.17 ORNL ET source setup ... 81
Figure 5.18 Assembled ET plasma source at ORNL ... 81
Figure 6.1 Schematic of DiMES head and samples ... 89
Figure 6.2 Example 4 x 10 micro-trench before and after plasma exposure ... 90
Figure 6.3 Example 10 x 10 micro-trench with AFM data ... 91
Figure 6.4 Example temperature data from DIMES IRTV ... 93
Figure 6.5 SiC and Ti3SiC2 erosion rate vs heat flux ... 94
Figure 6.6 SiC erosion rate vs height location ... 95
Figure 6.7 SiC erosion rate vs heat flux, with trendlines ... 96
Figure 6.8 Ion impact patterns ... 98
Figure 6.9 ET sample dimensions ... 101
Figure 6.10 Example 10 x 12 FIB micro-trench in Ti2AlC ... 103
Figure 6.11 FIB bitmap image for depth markings ... 103
Figure 6.12 Diagram of ET sample target ... 107
Figure 6.13 Post-exposure image of ET target holder ... 110
Figure 6.14 Temperature and heat flux density from IR camera ... 111
Figure 6.15 Time-lapse of IR temperature data frames... 111
Figure 6.16 Example profiles of ET current and power ... 112
Figure 6.17 Heat flux as a function of maximum ET source power ... 113
Figure 6.18 Silicon Micro-trench Example #1 ... 115
Figure 6.19 Silicon Micro-trench Example #2 ... 116
Figure 6.20 Silicon Micro-trench Overlay Image ... 117
Figure 6.21 Tungsten Micro-trench Example #1 ... 118
Figure 6.22 Tungsten Micro-trench Example #2 ... 119
Figure 6.23 Tungsten Micro-trench Example #3 ... 120
Figure 6.24 Tungsten Micro-trench Example #4 ... 121
Figure 6.25 Tungsten Label Image... 122
Figure 6.26 Ti3SiC2 Micro-trench Example #1 ... 123
Figure 6.27 Ti3SiC2 Micro-trench Example #2 ... 125
Figure 6.28 Ti3SiC2 Micro-trench Example #3 ... 126
Figure 6.29 Ti3SiC2 Micro-trench Overlay Image #1 ... 127
Figure 6.30 Ti3SiC2 Micro-trench Example #4 ... 128
Figure 6.31 Ti3SiC2 Micro-trench Overlay Image #2 ... 128
Figure 6.32 Ti2AlC Micro-trench Example #1 ... 129
Figure 6.33 Ti2AlC Micro-trench Example #2 ... 131
Figure 6.34 Ti2AlC Micro-trench Overlay Image ... 132
Figure 6.35 Ti2AlC Micro-trench Example #3 ... 133
Figure 6.36 Ti2AlC Label Image ... 133
xi
Figure 6.38 Silicon Carbide Micro-trench Example #2 ... 136
Figure 6.39 Silicon Carbide Overlay Image ... 137
Figure 6.40 Overlaid image for material loss measurement parameters ... 138
Figure 6.41 Max surface erosion rate vs heat flux, single exposures ... 140
Figure 6.42 Max surface erosion rate vs heat flux, multiple exposures ... 141
Figure 6.43 Max surface erosion rate vs heat flux, all exposures ... 142
Figure 6.44 ETFLOW results of total eroded mass and thickness ... 145
Figure 6.45 Vapor shielding efficiency ratios for Ti3SiC2 ... 146
Figure 6.46 Thickness losses for alternative PFM candidates for 500 μs disruptions ... 148
Figure 7.1 Visual comparison of overall PFM performance ... 160
1 CHAPTER 1 – INTRODUCTION
1.1 – Introduction
The quality of life in various countries is often correlated with per capita energy usage [1]. As the population increases and as the developing world evolves closer to the needs and lifestyles of the developed world, global energy demand is expected to drastically increase. Some estimates predict that electricity demand alone will increase by a factor of 3 by the year 2050 [1]. Rather than rely on fossil fuels, the world is slowly but deliberately moving towards carbon-free energy sources in an effort to secure reliable energy while combating global climate change. Carbon-neutral, carbon-free, and renewable energy sources have the potential to fill some of this need and
are rapidly being developed, particularly wind and solar power. However, in the best-case development scenarios, even accounting for advanced energy storage technologies, these
renewable sources are hindered by both low energy density and temporal variations. A global energy solution depends on the operation of a clean, reliable source of baseload power. Nuclear fission is a viable option to meet this demand, although it is still plagued by concerns of safety, radioactive waste, and proliferation.
Fusion energy offers an attractive solution to the growing global demand for energy. If properly harnessed, engineered, and controlled at an affordable cost, electricity generation from nuclear fusion can provide nations with energy security while avoiding further environmental degradation from fossil fuels [1]. It offers the same upsides of nuclear fission without the concerns of accident scenarios or proliferation, all with minimum, short-lived radioactive waste. Harnessing nuclear fusion in a controlled, sustainable way is a research challenge that spans back over 50 years. Multiple methods of fusion energy production have been explored, including magnetic confinement, inertial confinement, electrostatic confinement, and pinch configurations [1]. Tokamak-based fusion devices, which utilize magnetic confinement methods, have demonstrated the greatest fusion energy performance thus far [2]. Global progress in tokamak fusion experiments has even motivated the construction of the International Thermonuclear Experimental Reactor (ITER), the world’s first large-scale tokamak device designed to achieve net fusion energy gain.
2 many research topics, this dissertation delves into the investigation of suitable plasma-facing materials for advanced magnetic-confinement fusion reactors. In doing so, this research will play
a small but important part in making fusion power a viable global energy solution.
1.2 – Background on Tokamak Devices
Magnetic confinement fusion devices take advantage of the electric charges of plasma particles and confine them in a magnetic bottle. Specially designed magnetic field configurations restrict charged particle motion across the magnetic field lines while promoting motion along them. The name “tokamak” is an acronym of the Russian words “тороидальная камера с магнитными катушками” (toroidal'naya kamera s magnitnymi katushkami), which translates to “toroidal chamber with magnetic coils” [2]. In the tokamak, the plasma is formed in the shape of
a torus through specifically designed toroidal and poloidal magnetic field configurations. A toroidal magnetic field Bφ is not sufficient to confine the plasma alone, as the curvature of the field
lines produces opposing particle drifts for the charged ions and electrons [2]. This effect leads to a charge separation, electric field formation, and eventual loss of plasma. For a tokamak, a poloidal magnetic field Bθ is added by imposing a toroidal current within the plasma, often at a much
smaller magnitude than Bφ. The combined toroidal and poloidal magnetic field lines spiral around
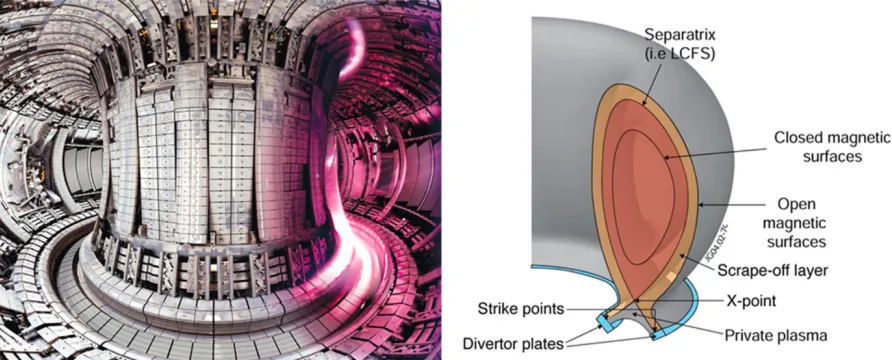
5 Modern tokamaks operate in a diverted shape which deviates slightly from the configuration in Figure 1.2 (c). In this configuration, the last closed flux surface is opened up such
that a cross point, or X-point, is formed as in Figure 1.3 (Right). The now open magnetic flux surfaces are then directed to target plates in a component called the divertor. The divertor is designed to manage the thermal loads from plasma particles that escape the separatrix, are transported through the scrape-off layer, and eventually impact the divertor plates at the strike point location [1,2]. Divertors allow for efficient exhaust of escaped plasma particles and helium ash, reducing the impact of built-up impurities on the plasma core. The tokamak plasma is usually initiated in a limited configuration, then the plasma shape is modified into a diverter configuration using the poloidal field coil currents [1]. Depending on the design, tokamaks can operate with a single diverted configuration at the top or bottom of the torus, as in Figure 1.3, or with a doubly diverted configuration.
Figure 1.3 – (Left) A composite image of the interior of the JET tokamak before and during plasma operations, highlighting the plasma impact within the lower divertor region. (Right) A cross-section outlining the regions of a diverted tokamak plasma [4]
The basic tokamak design has significantly advanced through the past few decades. There have been extensive improvements in confinement, transport properties, operating density, and plasma stability, allowing for the discovery and exploration of new, efficient confinement regimes.
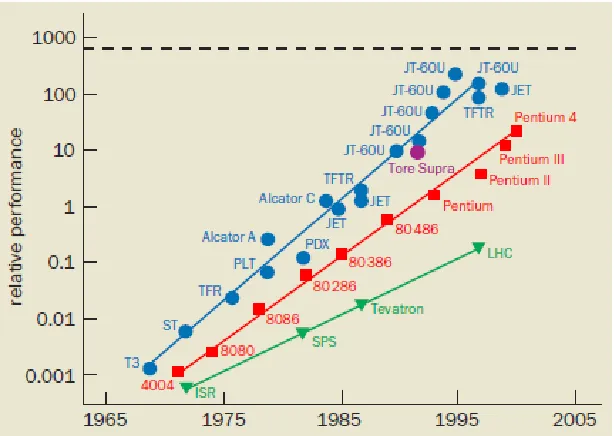
6 where plasma heating by products of the fusion reaction is sufficient to balance out thermal losses and maintain the desired plasma temperature. Achievements in the triple product have kept pace
with other high-tech industries, increasing at a slightly higher rate than Moore’s Law, at least up to the 1990’s [5]. Figure 1.4 highlights this growth rate in fusion capabilities compared to processor
chips and particle accelerators. Today, tokamaks are the most advanced toroidal confinement system and are the most promising candidate for the first generation of fusion reactors. By further increasing the reactor size and magnetic field strengths, energy storage and confinement are expected to finally improve to the point of generating a burning fusion plasma and surpassing energy breakeven.
Figure 1.4 – Performance comparison between tokamak plasma achievements (blue), the energy of particle accelerators (green), and the number of transistors on processor chips (red). The relative performance of fusion plasmas is defined by the fusion triple product. The dashed line indicates the performance expected on ITER [5]
International fusion research effort has culminated in the design and construction of the ITER device. Scientists and engineers from over 35 nations have banded together to construct the world’s first tokamak device capable of producing net fusion-energy [1,2,6]. ITER is scaled to be 10 times greater than today’s largest tokamak devices in order to increase the amount of plasma
7 displayed in Figure 1.5 which highlights important design features and components and their material composition. ITER is introducing plasma-facing materials (PFMs) and components
(PFCs) to a largely unexplored territory. The combination of high particle fluxes, over long pulse lengths, at high power flux densities raises serious material integrity questions that must be addressed. The materials and designs for ITER’s plasma-facing components have already been
solidified and are currently under construction. Although ITER is planned to be the first fusion device to generate net fusion energy, it will not capture the power it produces as electricity. Next-generation fusion devices will be required that are scaled and designed based on ITER’s performance. These fusion reactors will demand even greater fusion performance and will likely require advanced material solutions to counter any problems uncovered during ITER operation. Thus, any next-generation materials studies should begin by evaluating material performance under ITER-like conditions.
Figure 1.5 – The ITER tokamak design [7]
1.3 – Current Fusion Reactor Materials
8 first to experience significant net erosion due to its high power, long pulse operations. Normal operations will see large but manageable heat loads on PFCs on the order of 0.25-10 MW/m2 [8,9]. The main hazard in regard to heat flux driven erosion comes from off-normal, transient events which grow in severity with increased plasma stored energy. In particular, materials must withstand high heat fluxes from edge localized modes (ELMs), vertical displacement events (VDEs), and thermal quench phases of plasma disruptions. Erosion from these extreme events degrades PFM lifetime and disperses particulates/aerosol into the reactor’s vacuum vessel, further quenching the plasma and coating the interior components. For ITER, uncontrolled type I ELMs and disruptions are capable of producing GW/m2 scale heat fluxes during QDT = 10 operations [2,10].
To meet these requirements and others, ITER has chosen a combination of beryllium and tungsten as plasma-facing materials, which are then supported by other structural and shielding materials like copper and steel. The entire first wall will be comprised of beryllium. Beryllium is mainly chosen for its low-Z properties that minimize the impact of impurities in the plasma core [11]. It is also non-reactive with hydrogen isotopes and a natural oxygen getter. Solid beryllium has been used in the JET tokamak for both limiter and divertor tiles and has demonstrated good plasma compatibility through multiple operations [12]. The trade-off is a high rate of physical sputtering and a low melting point if any undesired plasma impact occurs. For the divertor, ITER’s original strategy was to take a multi-stage approach, starting with a carbon-fiber-composite (CFC) and W divertor for the non-nuclear phase of operation and then moving to a full W divertor for
9 is the possibility of material melting under transient heat fluxes [8]. ITER is expecting to meet these demanding material challenges; the divertor and first wall designs are complete and are
currently in the procurement phase. These concerns set the precedent for next-generation fusion material studies, in which materials must be designed to be superior to Be and W in reactor-relevant environments.
1.4 – Purpose of Study
The goal of this dissertation is to characterize the relative erosion properties of advanced plasma-facing material candidates and compare them to current fusion material choices. Studies were undertaken to analyze the erosion of selected PFMs under the high heat flux conditions expected in future tokamak reactors, for 5 – 10 MW/m2 steady state conditions and ~GW/m2 transient conditions due to ELMs and disruptions. A dataset of the erosion rate of these materials was developed so that materials can be easily compared to one another. This dataset was comprised of both simulated and experimental data spanning a wide range of heat flux regimes: physical sputtering, melting, and sublimation dominated erosion regimes. The plan leverages the relationship between NC State University, Oak Ridge National Laboratory, and the DIII-D National Fusion Facility to carry out collaborative research using state-of-the-art fusion facilities and simulation tools. In doing so, the desire is to collect enough data to create a chart similar to the one in Figure 1.6, comparing the erosion rates of the candidate PFMs to current fusion materials
10 Figure 1.6 – A sample PFM erosion rate comparison as a function of impinging heat flux, representing the final results goals of this research work.
A secondary goal of the dissertation is to utilize advanced microscopy capabilities for any experimental PFM sample analysis. It is important to physically measure any erosion thickness using a non-destructive, post-mortem technique. In collaboration with Oak Ridge National Laboratory, a new analysis method was developed for larger material samples that are more representative of plasma-facing components. Material samples were successfully characterized
11 REFERENCES
[1] M. Kikuchi et al. Fusion Physics. Chapter 7, 2012
[2] V. Igochine, Active Control of Magneto-Hydrodynamic Instabilities in Hot Plasmas.
Springer series on Atomic, Optical, and Plasma Physics, vol. 83, 2015 [3] “Tokamak Principle.” 20 Sept. 2011, www.euro-fusion.org
[4] “Plasma-Material Interactions.” Dutch Institute for Fundamental Energy Research, https://www.differ.nl/research/plasma-material-interactions Accessed 24 September 2018 [5] G. T. Hoang and J. Jacquinot, “Controlled Fusion: The Next Step.” Physics World, vol. 17,
no. 1, 2004
[6] “What is ITER?” www.iter.org Accessed 15 Aug. 2018
[7] A. Loarte, “ITER and Pedestal Physics.” Presentation, 2015 ITER International School, USTC, Hefei, China 2015
[8] R.A. Pitts et al. “A Full Tungsten Divertor for ITER: Physics Issues and Design Status,”
Journal of Nuclear Materials, vol. 438, 2013, S48-S56
[9] M. Merola et al. “ITER Plasma-facing Components.” Fusion Engineering and Design, vol. 85, 2010, pp. 10-12
[10] R.A. Pitts et al. “Physics Basis and Design of the ITER Plasma-Facing Components,”
Journal of Nuclear Materials, vol. 415, 2011, S957
[11] ITER Physics Basis Editors, “ITER Physics Basis.” Nuclear Fusion, vol. 39, no. 12, 1999 [12] L. Horton et al. “The JET ITER-like Wall Experiment: First Results and Lessons for
12 CHAPTER 2 – EROSION MECHANISMS OF PLASMA FACING MATERIALS
Plasma-surface interactions within the tokamak lead to erosion of the first wall components, especially during abnormal events with high heat flux exposures and high energy particle impacts. This material loss from the wall then causes an influx of impurities into the plasma, where impurities can either enter the core plasma or be redistributed along the walls due to material transport [1]. The combination of erosion, material transport, and re-deposition will result in some components undergoing net material erosion while others experience net material deposition. It is the areas where net erosion is prevalent that limit the plasma-facing component (PFC) lifetime [1]. In present-day tokamak devices, the net erosion of divertor plates has a minimal impact on PFC lifetime. Typical discharge times are on the order of seconds, with records as high
as 100 s [2,3,4]. The bigger concern for these short discharges is the release of impurities into the core plasma, which dilutes the plasma composition and leads to unwanted power loss from thermal
radiation [3]. However, for ITER and the large-scale reactors that will follow, higher heat and particle fluxes over hundreds of seconds of exposure time make net erosion a serious concern [1]. Plasma-facing materials must be chosen to offer low erosion losses while balancing other concerns for plasma contamination, tritium retention, neutron activation, and effects on the thermal/mechanical properties.
13 2.1 – Physical Sputtering
A material surface can begin the erosion process even before approaching it’s melting
temperature when the surface experiences impact from high-energy particle fluxes. This phenomenon occurs when plasma particles, either ions or neutrals, strike the surface with high enough energy to remove surface atoms via collisions. This is classically referred to as physical “sputtering”, the removal of surface-level lattice atoms via particle bombardment which can
drastically change the surface morphology [5]. Erosive sputtering was first observed almost 150 years ago on cathodes in electric gas discharge tubes and was consequently named “cathode sputtering” [5].
Mass loss due to sputtering is one of the many physics mechanisms that take place when high-energy particles impact a material. Today the physics of sputtering is relatively well understood. If the binding energy of lattice atoms in the target material is small (10’s of eV)
compared to the energy of the impacting particle, a scattering event between the two will result in the lattice atom being knocked out of its position via momentum transfer. The atom knocked away is known as the “primary knock-on atom” (PKA). Depending on the angle of impact and ejection,
the PKA can either be itself sputtered or go on to collide with other lattice atoms and form “secondary knock-on atoms” (SKAs). These SKAs can themselves escape the surface as sputtered
atoms. Several physical sputtering regimes can be identified depending on the energy of the incident particles, the impact angle, and collision cross sections for the projectile/target pairs [5].
The single knock-on regime refers to when PKAs receive enough energy to sputter away from the surface, without having enough energy to generate sputtering SKAs. This regime is typical for light ions and lower energy heavy ions. The linear cascade regime represents what happens when PKAs do possess enough energy to generate a cascade of SKAs that increase the sputtering yield. The spike regime applies to heavy ion impacts, where the collision density within the target lattice is so high that the majority of atoms in an entire volume are displaced.
Physical sputtering only occurs if the surface atom receives enough energy to exceed its surface binding energy [3]. The threshold energy, ET, represents the incident ion energy below which sputtering cannot occur. For the most extreme case of head-on collisions, ET is given by:
14 Where Es is the surface binding energy, which is often taken as the energy of sublimation, and γ is in this case the maximum energy fraction that can be transferred in a two-body collision,
𝛾 = 4𝑚1𝑚2/(𝑚1+ 𝑚2)2 [2,3]. The most common sputtering event for light incident ions, i.e. D
and T, involves two collisions: a projectile ion penetrates the material and collides within the lattice, reflecting the projectile back towards the surface layer. The second collision then occurs
on a first-layer atom from below, ejecting that lattice atom [2]. The additional term of (1-γ) in Equation 1 accounts for this reflection process [3].
Physical sputtering is often characterized in the literature by the sputtering yield, Y, which represents the number of sputtered atoms per incident particle. Y is dependent on the projectile and target masses, the projectile energy and angle of incidence, the target material’s threshold
energy and energy of sublimation. Experimental results are usually summarized by plotting the sputter yield against the incident ion energy E. If Y is plotted against E/ET, there is a general, semi-empirical curve that describes the sputter yield of a given projectile/target pair across a wide energy range [3]. For ions of normal incidence (θ = 0), this sputter yield curve takes the form of the
Bohdansky formula [2,3]:
𝐸𝑞. 2 𝑌(𝐸, 𝜃 = 0) = 𝑄𝑆𝑛( 𝐸 𝐸𝑇𝐹
) 𝑔 (𝐸 𝐸𝑇
)
where Q is the yield factor, which depends only on the surface binding energy and the ion/target
masses. Sn(E/ETF) is the nuclear stopping cross section, where ETF is a characteristic Thomas-Fermi energy, and g(E/ET) takes into account threshold effects, both of which have analytical forms [2,3]:
𝐸𝑞. 3 𝑆𝑛(𝜀) = 3.441√𝜀 ln(𝜀 + 2.718)
1 + 6.355√𝜀 + 𝜀(6.882√𝜀 − 1.708) , 𝜀 = 𝐸 𝐸𝑇𝐹
𝐸𝑞. 4 𝑔(𝛿) = (1 − 𝛿23) (1 − 𝛿)2 , 𝛿 =𝐸𝑡ℎ 𝐸
With known values for Q, ET, and ETF, Equation 3 can be used to predict sputter yields of normal incidence for any ion/target combination. Example sputter yield curves for different ion/target pairs are shown in Figure 2.1. The sputter yield decreases with increasing sublimation energy, increases with increasing incident particle energies, increases with increased projectile
mass, and decreases with increased target mass. As for angular dependence, the sputter yield increases as the angle of incidence θ increases with respect to the surface normal [3,5]. To the first
15 they impact a divertor or first wall are difficult. There are effects of the ion Larmor radius, the acceleration in the plasma sheath, E x B drift effects, and the surface roughness [3, 6]. The effective
sputtering yield for tokamak experiments is typically about twice that of code predictions for normal incidence, which is often deemed good enough by experimenters [2,3]. As for the sputtered atoms, their angular distribution is approximated well enough by a cos(θ) distribution. Strong
crystalline effects have been observed in single-crystal targets.
Figure 2.1 – Energy dependence of the physical sputtering yield for Be, C, and W by D and self-sputtered ions, calculated from the TRIM Monte Carlo Code [3]
2.1.1 – The Plasma Sheath
An overview of the plasma sheath and its impact on ion parameters is essential when considering erosion due to physical sputtering. The electrostatic plasma sheath, also known as the Debye sheath, represents a relatively thin layer of plasma attached to the divertor (or limiter) target surface [3]. Since the electron thermal velocity is higher than that of ions, the more mobile electrons reach the wall earlier, building up a negative charge. This capture leads to a depletion zone for the electrons, causing an electric field to establish near the target surface which repels electrons and attracts ions [3,7]. The acceleration effect within the electric field causes both
16 𝐸𝑞. 5 𝑣𝑖 = 𝑣𝑒 = 𝑐𝑠 = [
𝑇𝑖+ 𝑇𝑒 𝑚𝑖 ]
1 2
The floating electric potential that forms between the target surface and the sheath edge, Vf, is determined by the requirement of zero net current at the surface:
𝐸𝑞. 6 𝑉𝑓 = 1 2
𝑇𝑒 𝑒 ln [
2𝜋 (1 − 𝛿)2(
𝑚𝑒 𝑚𝑖
) (1 + 𝑇𝑖 𝑇𝑒
)]
Where δ is the total secondary electron emission coefficient due to both ions and electrons.
For a deuterium plasma, for example, with Te = Ti and δ = 0, Vf ≈ -3Te/e [3]. Example variations
in electric potential, ion velocity, and electron and ion densities ne and ni, along with distinctions between the plasma, pre-sheath, and Debye sheath, are portrayed in Figure 2.2.
Figure 2.2 – (Left) Various zones of charge balance within the plasma sheath that forms outside of a plasma-facing wall component [7]. (Right) Example spatial variation of the electric potential, ion velocity vi, and ion and electron densities ni and ne within the electrostatic plasma sheath [3]
The typical thickness of the Debye sheath is on the order of a few Debye lengths, which is
17 core plasma is nested within closed flux surfaces, modern tokamaks operate in a diverted configuration as described in Section 1.2. These divertors are designed such that the open magnetic
field lines within the scrape-off layer impact the divertor surface at shallow, oblique angles, often a few degrees from the surface parallel [2,3]. The presence of the angled magnetic field lines causes a magnetic pre-sheath to form. This sheath, also known as the Chondura sheath, is quasi-neutral and is typically a few Larmor radii in thickness, on the order of mm to cm [2,7]. Figure 2.3 highlights the different zones of the combined Chondura and Debye sheaths and their impact on electron and ion motion.
Figure 2.3 – Zones of the plasma sheath in the presence of an oblique magnetic field [2]
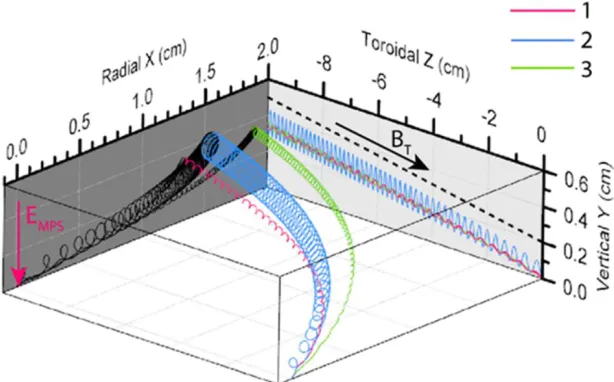
The gyromotion of high-energy ions causes variance in the initial trajectory when entering the magnetic pre-sheath and Debye sheath, further altering the ion motion as it accelerates towards the plasma-facing surface. One further complication arises from the combined presence of the magnetic and electric fields within the total plasma sheath. An E x B drift force manifests, deflecting the ‘guiding center motion’ of the gyrating ions in a direction perpendicular to the
18 Figure 2.4 – Computed ion trajectories for D+ ions with varying initial velocity distributions, where the R-Z plane represents the material surface at Y = 0 [8].
As discussed in Section 1.2, the sputtering yield for a given ion/target pair is dependent on the incident energy and impact angle. Thus, it is important to understand that changes in the total plasma sheath, either by the tokamak operating conditions or by the surface geometry itself, will change the ion impact parameters and thereby alter the amount of erosion by physical sputtering.
2.2 – Melting and Boiling
The surface temperature of plasma-facing components will rise under prolonged exposure to high energy plasma fluxes. For metallic materials, the surface can begin to melt and/or boil,
19 calculations of temperature, melt layer thickness, and vaporization thickness in tungsten for a 10 MJ/m2, 1 ms disruption [11]; Figure 2.5 also shows results from QPSA plasma gun experiments which demonstrate the melting of ITER W mono-blocks under ITER-relevant conditions [12].
Figure 2.5 – (Left) An example calculation of temperature, melt layer thickness, and vaporization thickness in tungsten for a 10 MJ/m2, 1 ms disruption using HEIGHTS [11]. (Right) Experiment results from QPSA plasma gun demonstrating the melting of ITER W mono-blocks under ITER-relevant conditions [12].
The formation of a surface melt layer does not directly imply a loss of material, just a change of state from solid to liquid. It is the interaction of that melt layer with phenomena within the tokamak environment (plasma fluxes, Lorentz forces, pressure gradients, gravitational forces, etc.) that can lead to severe erosion through melt-layer motion and splashing [9,10,13]. Macroscopic splashing of the developed melt layer can lead to a continuous ejection of molten metals into the plasma core, risking plasma contamination and termination if the molten droplets are too large and/or frequent [9,10]. If the melt layer surface temperature exceeds the boiling threshold, the formation and bursting of surface bubbles can cause additional material loss as liquid
droplets are ejected into the plasma with each burst [10].
20 layer dynamics are accounted for, the various causes of melt layer loss are largely dependent on the tokamak/device exposure conditions. Plasma pressure gradients and Lorentz forces have both
been experimentally observed to play a major role in melt layer motion [12]. On the TEXTOR tokamak, for example, melt layers were observed to flow perpendicular to the B-field direction on W limiter samples [9,12]. This motion was attributed to the Lorentz force. In experiments on QPSA, a linear plasma accelerator, macroscopic motion of molten material at the edge of erosion craters was concluded to be caused by plasma pressure gradients [9]. In various electrothermal plasma experiments, melt layer motion on liner surfaces was observed to follow the plasma flow direction [13,14]. In addition, gravitational forces must be considered for any angled PFCs. Finally, ELMs and disruptions can lead to drastic changes in pressure gradients, magnetic and electric fields, and plasma fluxes, all of which will alter melt layer motion.
Multiple theoretical models for the melt layer have been explored in the literature, focusing on complex variables such as viscous stability, splashing wave velocity, droplet ejection rates, bubble growth, etc. [9,10,14]. Since the erosion phenomena in this region cannot be directly correlated to just the impinging heat flux, the specific mechanisms for modeling melting/boiling mass loss fall outside the scope of this dissertation and will not be studied in detail.
2.3 – Sublimation
Not all materials exhibit melting when exposed to high heat fluxes. Under high temperature
vacuum conditions, some non-metallic materials instead undergo direct sublimation. Example materials include graphite and silicon carbide, both of which are important to this dissertation work. Sublimation directly leads to macroscopic erosion as vaporized material leaves the PFM surface and enters the core plasma. In general, the energy needed to sublime a substance depends on the material and its temperature, and must be enough to [15]:
1) Excite the solid substance to its maximum heat (energy) capacity 2) Sever all intermolecular interactions holding the solid together
21 This amount of energy is commonly referred to as the heat of sublimation or energy of sublimation. For normal substances that transition through all 3 phases, the magnitude of the
energy of sublimation can be thought of as a combination of the energies required to transition from solid to gas, as seen in Figure 2.6.
Figure 2.6 – Sample graph of Temperature vs Energy Change for a substance, showing the relationship between the heat of sublimation, heat of fusion, and heat of vaporization. Based on [15].
If a plasma-facing material exceeds its temperature threshold and enters a sublimation dominated regime, the erosion rate of the material surface becomes directly proportional to the heat of sublimation:
𝐸𝑞. 7 𝑛̇𝑎𝑏𝑙𝑎𝑡𝑖𝑜𝑛 ∝ 𝑄 ′′ 𝐻𝑠𝑢𝑏
Where 𝑛̇ is the number density of the ablated material, Q’’ is the heat flux impacting the
material surface, and Hsub is the heat of sublimation [14,16]. In this regime, the erosion rate should linearly increase as the impinging heat flux increases. The delivery mechanism for the heat flux becomes irrelevant (changes in ion species/density/temperature, increased radiant heat flux, etc.), as any deposited energy above the Hsub threshold will go on to continuously sublimate the material surface.
ΔE (at constant Pressure)
Solid Phase
Gaseous Phase Liquid
Phase
Sublimation
Fusion
22 It is important to note that this simple relationship only applies to the heat flux that directly impacts the material surface. Phenomena such as vapor shielding modifies the equation by
introducing a vapor shielding factor to account for energy absorption through the vapor shield. For high intensity, short timespan plasma exposures, the continuous evaporation of material can form a vapor cloud above the PFM surface. This vapor cloud then inadvertently absorbs a fraction of the energy from the incoming heat flux, shielding the surface and reducing its erosion rate by reducing the heat flux magnitude at the material surface [14]. Shielding effects such as vapor shielding depend on both the vapor species and the physics of the heat flux delivery mechanism. Thus, any changes in plasma flux parameters can turn PFM erosion rates into a non-linear relationship in the sublimation regime and should be accounted for.
2.4 – Other Erosion Mechanisms
There are a few special cases of material erosion mechanisms that are not related to the goals of this dissertation, but are worth covering for consistency. The first is often referred to as chemical sputtering. Chemical reactions between incident ions and/or neutrals with the PFM surface can lead to measurable erosion as gaseous product molecules form and leave the material surface [3]. In fusion devices, the most commonly observed example occurs between hydrogen isotopes and carbon, such as the below reaction for methane.
𝐸𝑞. 8 4𝐻 + 𝐶 → 𝐶𝐻4
Carbon in particular has been extensively used as a limiter or divertor material due to its low Z, low sputtering yields, and lack of melting. However, its chemical sputtering yields can be comparable or even higher than the physical sputtering yields, depending on the plasma conditions [2,3]. The hydrocarbons that chemically form have a low binding energy with the surface, and thus can be released at relatively low temperatures. Additionally, unlike physical sputtering, there is no well-defined threshold energy below which chemical sputtering stops [2,3]. Thus, for carbon, chemical sputtering can dominate during low temperature plasma discharges and under detached divertor conditions.
Another common erosion mechanism comes from arcing on the plasma-facing material surface. In general, arcing occurs when material evaporates from a cathode surface, ionizing and
23 the cathode or anode to a localized point on the surface, where joule heating leads to electron emission via either thermionic or field emission [3]. In a plasma environment, the presence of the plasma sheath over a PFM surface can produce what’s known as unipolar arcing. Electrons from
24 REFERENCES
[1] ITER Physics Basis Editors, “ITER Physics Basis.” Nuclear Fusion, vol. 39, no. 12, 1999
[2] P. Stangeby, The Plasma Boundary of Magnetic Fusion Devices, IOP Publishing, 2000 [3] M. Kikuchi et al. Fusion Physics. Chapter 7, 2012
[4] Chinese Academy of Sciences. “China’s ‘artificial sun’ sets world record with 100 second steady-state high performance plasma.” Phys.org, 6 July 2017, https://phys.org/news/2017-07-china-artificial-sun-world-steady-state.html Accessed 20 August 2018.
[5] R. Behrisch & W. Eckstein, Sputtering by Particle Bombardment, Springer, Topics in Applied Physics, 2007
[6] R. Khaziev and D. Curreli, “Ion energy-angle distribution functions at the plasma-material interface in oblique magnetic fields.” Physics of Plasmas, vol. 22, no. 043503, 2015 [7] M. Hellwig, “Influences of 3D geometry and surface roughness on plasma-wall interaction
processes on tungsten surfaces.” Dissertation, Ruhr University Bochum, 2016
[8] C. Chrobak, “Characterizing Erosion and Redeposition of Aluminum in DIII-D Divertor Plasmas.” Dissertation, UC San Diego, 2018, https://escholarship.org/uc/item/2vv5m4wh
[9] G. Miloshevesky and A. Hassanein, “Stability and erosion of melt layers developed on plasma facing components of tokamaks,” Nuclear Fusion, vol. 64, no. 043016, 2014
[10] Y. Shi et al. “Boiling induced macroscopic erosion of plasma facing components in fusion devices.” Fusion Engineering and Design, vol. 86, 2011, pp. 155-162
[11] A. Hassanein and J. Konkashbaev, “Lifetime evaluation of plasma-facing materials during a tokamak disruption,” Journal of Nuclear Materials, vol. 233, 1996
[12] Y. Ueda, “Pulsed Heat Load Effects on Plasma Facing Materials”, Presentation, 2015 ITER International School, USTC, Hefei, China, 2015
[13] G.E. Dale and M. A. Bourham, “Melt layer erosion and resolidification of metallic plasma facing components.” Proc. 17th IEEE/NPSS Symposium on Fusion Engineering, vol. 2, 1997, pp. 892-895
25 [15] K. Nakajima, “Heat of Sublimation”, 6 Feb. 2018, Chemistry Libretexts,
https://chem.libretexts.org/Core/Physical_and_Theoretical_Chemistry/Thermodynamics/
Energies_and_Potentials/Enthalpy/Heat_of_Sublimation Accessed 22 May 2018
[16] A. L. Winfrey et al. “A Study of Plasma Parameters in a Capillary Discharge with Calculations Using Ideal and Nonideal Plasma Models for Comparison with Experiment.”
26 CHAPTER 3 – ABNORMAL EVENTS: DISRUPTIONS AND EDGE LOCALIZED
MODES 3.1 – Disruptions
Disruptions in a tokamak are defined as a rapid loss of the confined plasma and its intrinsic plasma current. Such disruptions result in major heat loads to plasma facing components (PFCs) and materials (PFMs) within the tokamak, as well as large electromagnetic forces on the tokamak structural components [1]. The energy stored within the tokamak plasma increases with larger device dimensions; if L = the linear dimension of the device, then the stored energy rises as L5, and the energy dissipated during a disruption rises as L3 [1]. If the reactor doubles in size, energy loads imparted to the tokamak wall, even if uniformly distributed, increase by an entire order of magnitude. Thus, disruptions become a major constraint when designing large tokamaks such as ITER, which is about double the size of JET. The major issues that arise from a disruption in a tokamak device are as follows:
1) Rapid heat loss from the plasma will impact the inner wall and the divertor. For a high performance ITER plasma, ~350 MJ of thermal energy will be dissipated in ~1ms, with an
impact duration of 1.5-3 ms [1,2].
2) Large electromagnetic forces will act upon the conducting structure that contains the plasma. These forces are due to induced eddy and halo currents, which in ITER could be upwards of 8000 tons [1].
3) High energy runaway electrons due to rapid decay of the plasma current, which have the potential to damage the inner wall. For ITER, it is estimated that 10 MA of current can be generated by 10-20 MeV runaway electrons [1].
27 3.1.1 Causes of Disruptions
Plasma disruptions are bound to occur when performance stability limits are exceeded. The main controlled parameters in a tokamak are the plasma current (Ip), the toroidal magnetic field (Bϕ), the plasma density often determined by the electron density (ne), the additional plasma heating, and finally the shape of the plasma [1]. Additional heating may be due to high energy neutral particles injected into the plasma or due to radio frequency (RF) waves that resonate with ion and/or electron gyro-frequencies (ICRH or ECRH). This heating controls the plasma temperature and kinetic pressure, influencing the pressure profile.
The first publication on disruptions in tokamaks was by E. P. Gorbunov and K. A. Razumova in 1963, entitled “The effect of a strong magnetic field on the magnetohydrodynamic stability of plasma and the containment of charged particles in the ‘Tokamak’”. The paper focuses
on how plasma becomes unstable in tokamaks and stellerators for currents much less than the critical current outlined by the Kruskal-Shafranov criterion [3]. This stability criterion is for a simple model, an ideally conducting plasma column (with a circular cross-section) in a strong magnetic field surrounded by a vacuum.
𝐸𝑞 1. 𝑞(𝑎) =𝑎𝐵𝜙 𝑅𝐵𝜔 > 1
Where a, R are the minor and major radii of the plasma, and 𝐵𝜙 and 𝐵𝜔 are the toroidal
and poloidal magnetic fields, respectively [4]. The ratio q represents the helicity of magnetic field lines at the plasma edge, and is often referred to as the safety factor due to its close connection to disruptions [5]. Disruptions observed in the 1963 publication showed that the Kruskal-Shafranov criterion was only approximate and led to a change in theoretical requirements for stability to q(a) > 2. This change in safety limitations began a more thorough scientific investigation of disruptions in tokamak devices.
28 Figure 3.1 – Sequence of events for a typical tokamak plasma disruption [1]
Figure 3.2 – Plasma parameters during a theoretical disruption on ITER [2]. There is a rapid loss of plasma stored energy (red), usually seen in the electron temperature Te, representing the thermal quench. What follows is a gradual decay of plasma current (blue), which is the current quench phase. Finally, the growing helical distortion in the plasma during the disruption, before the
thermal quench, can result in a vertical displacement of the plasma current centroid (black).
29 edge-q < 2. Additionally, there is an empirical limit to the plasma density known as the Greenwald limit, which is directly proportional to the average current density. This limit is due to the increased
edge radiation that occurs at higher density, which can lead to radiative collapse, MHD destabilization, and a disruption [1,5].
𝐸𝑞 2. 𝐺𝑟𝑒𝑒𝑛𝑤𝑎𝑙𝑑 𝐿𝑖𝑚𝑖𝑡: 𝑛𝑒(1020𝑚−3) < 𝑛
𝑔(1020𝑚−3) =
𝐼𝑝(𝑀𝐴) 𝜋𝑎2
At the hard limit of q95 ~ 2, instabilities grow extremely fast, on the Alfven timescale πRo/va (~1 μs). Throughout the disruption itself, the plasma evolves through force-balance equilibria over
a range of timescales. The shortest time scale is approximately 1 millisecond, 1000x the Alfven timescale, while the longest timescale can be on the order of a second [6]. The wide variation in causes, time scales, and expressions of plasma disruptions are what make them difficult to predict, let alone avoid and mitigate.
Although this dissertation work is more focused on the impact of disruptions on plasma-facing materials, a brief overview of disruption causes and classifications will be covered here. Some sources focus solely on the MHD instabilities responsible for a disruption [1], while others focus more on the root cause of the instability rather than its characteristics [5]. Looking at the modes of MHD instabilities themselves, it’s easy to classify instabilities by answering three
questions [1]:
1) What drives the instability? Common drivers include plasma current, pressure, and particle/density.
2) Is it a “resistive” or “ideal” instability? Ideal instabilities refer to cases when flux surfaces within the plasma are preserved, such that the instability only changes their shape. These instabilities are often called “kink” instabilities since they tilt and kink
30 tearing modes and neoclassical tearing modes, the names of which imply the tearing and reconnection of the magnetic field lines.
3) What is the location of the instability? Internal modes refer to instabilities inside the plasma, while external/free boundary modes refer to events at the plasma boundary.
The original disruption experiments testing the Kruskal-Shafranov criterion were concerned with external kink modes. As previously stated, these instability modes tilt and kink the plasma away from an ideal toroidal shape; for external kinks, it is the plasma boundary that is distorted rather than the core magnetic field lines. These pressure-driven external kink modes limit the operating β and ultimately limit the pressure that can be achieved in ideal plasmas [7]. Internal
kink modes are also possible, as seen in Figure 3.3.
Tearing modes manifest by breaking or tearing magnetic flux surfaces, forming magnetic islands within which particle motion is confined. With a finite plasma resistivity, ideal MHD breaks down around rational surfaces when the safety factor q happens to match up with the
poloidal and toroidal mode numbers: 𝑞 = 𝑛/𝑚. The safety factor q inherently represents the number of toroidal transits per poloidal transit a particle takes while traversing the tokamak, where m is denoted the poloidal mode number and n the toroidal mode number [7, 8]. There are classical tearing modes which are linearly unstable when Ip is unstable and the tearing mode island has a lower magnetic energy than the original plasma. There are also neoclassical tearing modes (NTMs), which occur at high β even in a classically stable plasma [7]. NTMs rotate with the
electron fluid component of the plasma, but in large tokamaks they tend to stop rotating as they grow towards disruption. This is referred to as mode locking, and occurs primarily due to eddy currents driven in the conducting structures around the plasma. This locking causes loss of the high confinement H mode and the continued mode/island growth can lead to a disruption [7]. The q95 limit and the density limits often manifest themselves as m=2, n=1 NTMs. As NTMs are a high β event, they limit what β can be effectively achieved in a tokamak, which is a particular concern
31 Figure 3.3 – a) an ideal MHD internal kink instability, and b) a resistive tearing mode MHD instability [1]
Along with well-studied MHD instabilities, there are other manifestations of plasma instability. One mechanism is through radiative cooling of the edge. Plasma radiation comes from bremsstrahlung, cyclotron radiation, and line radiation from impurity ions, recombination, and/or partially ionized plasma ions [5]. Of particular importance is line radiation from impurity ions, both low-Z and high-Z. Radiation from low-Z ions, for example, are shown to increase with lower edge temperatures [5]. Any increase in radiative loss could create a positive feedback loop of lowering temperatures, resulting in an inward contraction of the temperature profile and a radiative collapse of the core plasma. These types of radiation limit disruptions are sometimes referred to as edge cooling disruptions [1]. In terms of β imposed limits, internal transport barriers may occur,
which cause strong pressure profile peaks that lead to rapid disruptions. At high plasma pressure, resistive wall modes can also occur. Even rapid transitions of the plasma, such as L-H or H-L transitions, may trigger a disruption.
Finally, present day devices now have a D-shaped cross-section in order to improve plasma confinement and stability, as seen in Figure 1.3 of Chapter 1. This shape choice allowed for increased plasma current operations for a given aspect ratio and Bt and leads to a natural formation
32 [1]. This unwanted motion is called a Vertical Displacement Event (VDE), and can lead to the plasma impacting the wall, triggering a disruption. The reverse can also happen: a minor
disruption may occur and then rapid changes of plasma parameters can cause a vertical instability.
3.1.2 Impact of Disruptions
When it comes to inner wall components of the tokamak, excessive heat loads are the most significant consequence of disruptions. Heat loads manifest in both the thermal quench phase, when thermal energy is lost from the plasma, and the current quench phase, when magnetic energy is also converted to heat. The rough governing parameter for surface heating via conduction is U/(A*τ0.5), where U is the incident energy, A is the area, and τ is the timescale of the heat
33 Figure 3.4 – Power density on diverter during an H-mode density limited disruption on JET [9]
The bigger concern is concentrated heat loads from the thermal quench. In the case of a
high performance ITER plasma, where ~350 MJ of energy is released over ~ 1ms during a disruption, a severe heat load placed directly on the divertor would cause significant melting,
splashing and erosion, with estimated energy depositions anywhere from 10-200 MJ/m^2 [1,10]. Luckily, there are a couple of intrinsic factors that somewhat mitigate the heat load in diverted tokamaks [1]. 1) For most tokamak disruptions, the thermal energy of the plasma at the time of the thermal quench is lower than its peak value (however there are exceptions at high-β where little confinement is lost before a disruption). 2) Some thermal quench energy is lost via radiation; the amount depends on the wall materials that lead to impurities in the plasma. JET, for example, lost around 75% of its thermal energy via radiation when equipped with carbon walls, but only lost 50% with its new tungsten/beryllium wall. 3) The width of the scrape-off layer, through which the heat is transported to the divertor, is broadened during the thermal quench. The broadening, ranging from 5 – 20, significantly reduces the corresponding heat flux incident on the divertor surface. These intrinsic mitigation factors do lessen the disruption heat loads to the divertor, but further mitigation is essential to prevent significant erosion, melting, and other damage to the divertor as well as other plasma-facing components.
34 quench phase of a disruption, large electromagnetic forces act on the vessel structure. The decay of toroidal plasma current induces eddy currents in the surrounding conductors, and since those
conductors are immersed in a magnetic field, they are subject to a JxB force [11]. This often takes the form of a compressive force. In addition, due to vertical instability within elongated plasmas, the plasma can experience unwanted vertical motion after large perturbations in plasma equilibrium. Vertical motion of the plasma induces a toroidal current in the vessel components and therefore a net vertical force on the vessel, on the order of the vessel weight [11]. The plasma will continue its vertical motion until it intersects with either the top or bottom divertor (in the case of tokamaks with two divertors), which begins acting as a limiter. The limited plasma continues to shrink and shift vertically until it disappears. Then what were once contained, closed flux surfaces within the plasma are now open magnetic flux surfaces flowing within the vessel structure. This plasma region is called the halo, and the halo current is defined as the poloidal component of the current flowing from the halo onto the vessel structures and back during the current quench of a disruption [11]. Figure 3.5 is an illustration of a simulation of an ITER plasma undergoing a vertical instability.
Figure 3.5 – Simulation of an ITER plasma undergoing a vertical instability [11]
35 operations [2]. The maximum halo current can be up to 50% of the previously intact plasma current, and must be monitored in all tokamaks due to its strong potential to damage the in-vessel
components it flows through.
During a disruption, plasma material interactions with the first wall lead to an influx of impurities into the plasma and an increase in its effective charge, Zeff. Coupled with a relatively low electron temperature, Te, this effect drastically raises the plasma’s resistivity η [1].
𝐸𝑞 3. 𝜂 ∝𝑍𝑒𝑓𝑓 𝑇𝑒
3 2
𝐸𝑞 4. 𝐸𝐷 = 𝑒 3𝑛
𝑒ln(𝛬) 4𝜋𝜀𝑜2𝑇
𝑒
From Ohm’s law, a large electric field is generated by E = ηJ, where J is the existing plasma
current density. If this electric field becomes larger than the quantity known as the Drieicer field (Eq 4), the electrons traveling through said field can overcome the drag forces from plasma collisions, accelerating them to ‘runaway energies’ of 10-20 MeV [11]. Up to two-thirds of the
original plasma current can be carried by runaway electrons during a disruption [1]. Even more
worrisome, the formation of secondary runaway electrons via close angle scattering is likely in large tokamaks such as JET and ITER. These collisions lead to an exponential growth or avalanche
of runaway electrons that then go on to damage the vessel. Significant damage from runaway electrons has been observed in large tokamaks such as Tore Supra and JET [1], where thermal energy is deposited upon striking the material surface (along with some magnetic energy converted and deposited as thermal energy). To prevent significant damage to the first wall, runaway electrons must be controlled or prevented in large tokamaks.
3.2 H-mode & ELMs
![Figure 1.1 – Schematic of a tokamak magnetic field configuration [3]](https://thumb-us.123doks.com/thumbv2/123dok_us/1413561.1173920/16.612.137.477.72.342/figure-schematic-of-a-tokamak-magnetic-field-configuration.webp)

![Figure 1.5 – The ITER tokamak design [7]](https://thumb-us.123doks.com/thumbv2/123dok_us/1413561.1173920/20.612.93.519.343.587/figure-the-iter-tokamak-design.webp)


![Figure 3.4 – Power density on diverter during an H-mode density limited disruption on JET [9]](https://thumb-us.123doks.com/thumbv2/123dok_us/1413561.1173920/46.612.155.428.83.291/figure-power-density-diverter-mode-density-limited-disruption.webp)
![Figure 3.6 – Chart of different modes of confinement [15]](https://thumb-us.123doks.com/thumbv2/123dok_us/1413561.1173920/49.612.177.426.332.582/figure-chart-different-modes-confinement.webp)