ABSTRACT
LI, YINGJIE. Development of a Haptic-based Rey-Osterrieth Complex Figure Testing and Training System with Computer Scoring and Force-feedback Rehabilitation Functions. (Under the direction of Dr. Yuan-Shin Lee and Dr. David B. Kaber.)
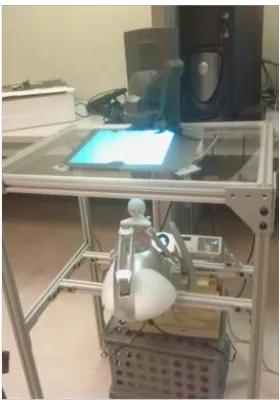
This research develops a new system for assessment and rehabilitation of motor skills in Traumatic Brain Injury (TBI) patients. By using contemporary computing technologies, including virtual reality (VR), haptic devices and telecommunications, the system can work as an alternative to traditional labor intensive and expensive diagnosis and rehabilitation procedures for TBI patients. This study also introduces a general approach to the design and prototyping of a haptic-based VR System for motor skill assessment and rehabilitation.
The Rey-Osterrieth Complex Figure (ROCF) is a neuropsychological test that has been used to manually assess various cognitive operations, such as perceptual apprehension, attention and control, graphomotor coordination, etc. The focus of this research was on developing a VR-based ROCF test system incorporating a haptic interface with functions to support testing protocols, based on specific user requirements, and to facilitate automated scoring of tests and quantitative test result output. Computer-based tests have advantages over traditional paper-based tests for motor skill assessment including automated recording of complete behavior information in the drawing process, simplifying the job of examiners, and reducing biases in evaluations.
(3D) method of ROCF testing. Also users may experience a more realistic feeling of drawing when using the haptic device versus using a tablet or tablet PC.
To develop the ROCF scoring system, advanced technologies of handwriting/pattern recognition were reviewed and adapted. A software application was created for recording of freehand drawings, recognition of strokes and normalization of strokes for unit scoring. ROCF scoring and analysis reports can be generated automatically with the system.
The haptic-based VR system was extended in capability for motor skill rehabilitation. Numerical models were used to describe motor skill assessment results and to parameterize the rehabilitation training application. The prototype system demonstrates the potential for using advanced information and VR technology to build more effective and intelligent tools for healthcare.
Development of a Haptic-based Rey-Osterrieth Complex Figure Testing and Training System with Computer Scoring and Force Feedback Rehabilitation Functions
by Yingjie Li
A dissertation submitted to the Graduate Faculty of North Carolina State University
in partial fulfillment of the requirements for the degree of
Doctor of Philosophy
Industrial Engineering
Raleigh, North Carolina 2010
APPROVED BY:
________________________________ ______________________________ Dr. David Kaber Dr. Yuan-Shin Lee
Committee Chair Committee Co-Chair
DEDICATION
BIOGRAPHY
Yingjie Li was born in Jiangsu province in China in 1980. She received her B.S. (2003) degree in Mechanical Engineering and Automation from Shanghai Jiaotong
ACKNOWLEDGMENTS
I would like to express my deep appreciation and gratitude to my advisors, Dr. David B. Kaber, and Dr. Yuan-Shin Lee for their patience, suggestions, and encouragement during my academic and research work at North Carolina State University. Without their guidance and continuous support, I would never have finished my studies. I would like to thank Dr. Larry Tupler, Dr. Simon Hsiang, and Dr. Christopher G. Healey who served on my committee. I would also like to thank Dr. Rob St. Amant for his support and suggestions during my doctoral examination. I appreciate the committee’s time and comments given to me to improve the quality of this dissertation. Their knowledge and commitment to the highest standards inspired and motivated me.
I wish to thank Prithima Reddy Mosaly and Wu Chen for their help on the study. I greatly appreciate and would like to thank my fellow students in both the manufacturing and ergonomics research groups: Yongfu Ren, Susana Lai-Yuen, Shiyong Lin, Deyao Ren, Apichart Boonma, Plawut Wongwiwat, Manida Swangnetr, Eui Seok Kim, Sathish
Meenakshisundaram, Plamen Velinski, Yu Shu, Zongliang Jiang, Mohamed Sheik-Nainar, Xu Xu, Tao Zhang, Yulan Liang, Yu Zhang, Biwen Zhu, Jing Xu, Guk-Ho Gil, Shruti Bharat Gangakhedkar, and Michael Clamann for their valuable consultation, suggestions, advice and help during my research. Special thanks goes to Darrel Rice for his appreciated help during my experiment setup machining and assembling, and my TA assignment in the
I would also like to thank the National Science Foundation (NSF) for providing the grant to support part of the study. Although the views and opinions expressed in this paper are those of the author and do not necessarily reflect the views of the NSF.
My sincere thanks are also extended to my friends here at NCSU. Their support and friendship have enriched my years at NC State University, making my time here that much more wonderful and joyful.
TABLE OF CONTENTS
LIST OF TABLES ... ix
LIST OF FIGURES ... x
ACRONYMS ... xii
CHAPTER 1. INTRODUCTION ... 1
1.1. Motivation and Objective ... 1
1.1.1. Introduction to VR for TBI Patient Diagnosis and Treatment ... 1
1.2. Specific Aims ... 3
1.3. Dissertation Organization ... 6
CHAPTER 2. RESEARCH ISSUES ... 7
2.1. Intuitive Interaction ... 7
2.2. User Interface Design for Patients ... 7
2.3. Parameterization of Rehabilitation Process ... 8
2.4. Segmentation of User Input ... 8
2.5. Imprecision and Variation in Freehand Drawings ... 9
2.6. Drawing Habits, Overtracing and Sketching ... 11
CHAPTER 3. LITERATURE REVIEW ... 14
3.1. Introduction to the ROCF, Procedures and Implementation ... 14
3.1.1. Motor Skill Assessment Methods ... 15
3.1.2. Standard ROCF Scoring System ... 17
3.1.3. Summary of ROCF studies ... 18
3.2. Technology Related to Computerized ROCF Test System ... 19
3.2.1. Virtual Reality ... 19
3.2.2. Virtual Reality in Healthcare ... 21
3.2.3. Devices Used for Computerization of Neuropsychological Tests ... 23
3.2.4. Mechanisms of Haptic Device ... 26
3.2.5. Force Rendering ... 27
3.3. Handwriting/Drawing Recognition ... 31
3.3.1. Feature Extraction ... 31
3.3.2. Pattern recognition ... 32
3.3.3. Circle Recognition ... 35
3.3.4. Corner detection in Drawing ... 37
3.3.5. Shape Recognition ... 38
3.4. Summary ... 38
CHAPTER 4. HAPTIC DEVICE AND WORKSTATION PROTOTYPING ... 40
4.1. Introduction ... 40
4.2. Haptic Device Selection ... 41
4.3. Workstation Design ... 45
CHAPTER 5. A COMPARISON OF HAPTIC DEVICES FOR COMPUTER-BASED
REY-OSTERRIETH COMPLEX FIGURE TESTING ... 48
5.1. Introduction ... 48
5.2. Related work ... 50
5.2.1. Fuzzy Model for Handwriting ... 50
5.2.2. ROCF Scoring System ... 51
5.3. Experiment ... 53
5.3.1. Participants ... 53
5.3.2. System Setup and Apparatus ... 53
5.3.3. Procedure ... 54
5.4. Results ... 55
5.4.1. Physical Performance ... 55
5.4.2. Time–to-Completion ... 57
5.4.3. Accuracy and placement ... 59
5.4.4. Post-experiment Questionnaire ... 60
5.4.5. NASA-TLX Survey Results ... 61
5.5. Discussion and Conclusion ... 61
CHAPTER 6. ON-LINE DRAWING RECOGNITION AND SCORING ... 64
6.1. Introduction ... 64
6.2. Sample size ... 65
6.3. Stroke Forming ... 68
6.4. Corner Detection ... 72
6.5. Circle Detection ... 73
6.6. Line Segmentation ... 74
6.7. Unit Recognition ... 79
6.8. Score Calculation ... 83
6.9. Conclusion ... 86
CHAPTER 7. ROCF SCORING SOFTWARE FOR CLINICIANS ... 87
7.1. User Operation ... 87
7.2. Client Software Interface for Clinicians ... 89
7.3. Loading Drawing Data ... 91
7.4. Scaling, Rotation and Translation ... 93
7.5. Checking Drawing Information ... 95
7.6. Setting Parameters ... 96
7.7. Unit Recognition ... 99
7.8. Checking Detailed Stroke Information ... 102
7.9. Generating a Score Report ... 102
7.10. Scores ... 103
7.10.1. General Scoring Principles ... 103
7.10.2. Specific Scoring Criteria ... 104
7.11. Conclusion and Future Work ... 105
8.2. Modeling for Motor Skill Training ... 111
8.3. Conclusion ... 114
8.4. Discussion and future work ... 116
CHAPTER 9. SYSTEM VALIDATION ... 118
9.1. Introduction ... 118
9.1.1. Participants ... 119
9.1.2. System Setup and Apparatus ... 119
9.1.3. Experiment Design and Variables ... 120
9.2. Procedures ... 121
9.2.1. Test Data Collection ... 121
9.2.2. Scoring ... 122
9.3. Data Analyses and Specific Hypotheses ... 123
9.3.1. Hypotheses ... 123
9.4. Results ... 124
9.4.1. Effects of Hand Dominance on Pen-Paper Drawing Results ... 124
9.4.2. Effects of Hand Dominance on Haptic Device Drawing Results ... 126
9.4.3. Drawing Method Differences ... 128
9.4.4. Correlation Analyses ... 131
9.5. Discussion ... 132
9.5.1. Dominant vs. non-dominant hand drawings ... 132
9.5.2. Effects of drawing methods ... 132
9.5.3. Correlation analyses for scoring methods results ... 134
9.6. Conclusion ... 135
CHAPTER 10. CONCLUSION AND FUTURE WORK ... 136
10.1. Limitations and caveats ... 137
10.2. Future work ... 137
REFERENCES ... 141
APPENDICES ... 152
Appendix A: Informed Consent form for research ... 153
Appendix B: Subject Survey ... 156
Appendix C: Post-Experiment Questionnaire ... 158
Appendix D: NASA-TLX Survey ... 160
LIST OF TABLES
Table 3-1. Scoring criteria for ROCF drawings... 17
Table 4-1. Comparison of two haptic devices. ... 44
Table 5-1. Experiment design following a Latin Square. ... 55
Table 5-2. ANOVA results on EMG responses. ... 56
Table 5-3. Correlation analysis for devices. ... 57
Table 5-4. ANOVA results on completion time with three devices. ... 58
Table 5-5. Tukey Test results on time-to-completion (log transformed) with three devices. 59 Table 8-1 Motor skill training setting with parameters ... 115
Table 8-2. Analyzing the model {M} for the drawing task. ... 116
Table 9-1. Independent variables. ... 121
Table 9-2. Summary of completion time (in seconds) for pen-paper drawings. ... 125
Table 9-3. Summary of scores for pen-paper drawings (max=36). ... 125
Table 9-4. Summary of completion times for haptic-based drawing tests. ... 127
Table 9-5. Summary of scores for haptic device drawing tests (max=36). ... 127
LIST OF FIGURES
Figure1-1. Rey-Osterrieth Complex Figure. ... 3
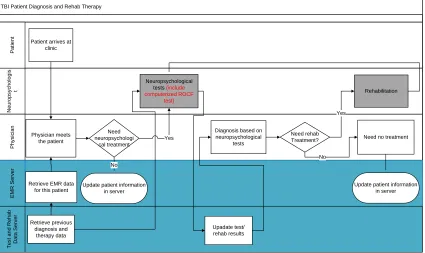
Figure 1-2. Data flow for patient diagnosis and rehabilitation therapy using computer-based system. ... 5
Figure 2-1. Example of freehand drawing. ... 10
Figure 2-2. Variation of drawing. ... 10
Figure 2-3. Overtracing examples. ... 12
Figure 2-4. Identified overtracing stroke. ... 12
Figure 2-5. Example of direction deviation. ... 13
Figure 3-1. EPOS Digital Pen. ... 24
Figure 3-2. Srimathveeravalli and Thenkurussi’s virtual writing testing bed [79]. ... 25
Figure 3-3. Lab built 5-DOF haptic devices [43]. ... 27
Figure 3-4. Architecture of VR application with haptic force feedback [71]. ... 28
Figure 3-5. Virtual wall using one-DOF interaction. ... 29
Figure 3-6. Two-DOF planar PCM. ... 30
Figure 3-7. Probability of an observed sequence. ... 35
Figure 4-1. Sensable Technologies Desktop Phantom haptic device. ... 42
Figure 4-2. Novint Falcon haptic device. ... 43
Figure 4-3. Design of workstation based on user physical and cognitive information requirements. ... 46
Figure 4-4. Lab-built chair. ... 47
Figure 5-1. Phantom haptic device (upper) and Falcon haptic device (lower). ... 48
Figure 5-2. Wacom Cintiq Tablet used to record pen-paper drawing. ... 49
Figure 5-3 Model of hand and muscle system ... 51
Figure 5-4. Rey-Osterrieth Complex Figure with Unit 6 highlighted. ... 52
Figure 5-5. Muscles monitored by EMG. ... 54
Figure 5-6. Average muscle activity for four muscles using different drawing devices. ... 56
Figure 5-7. Time to Completion (second)... 58
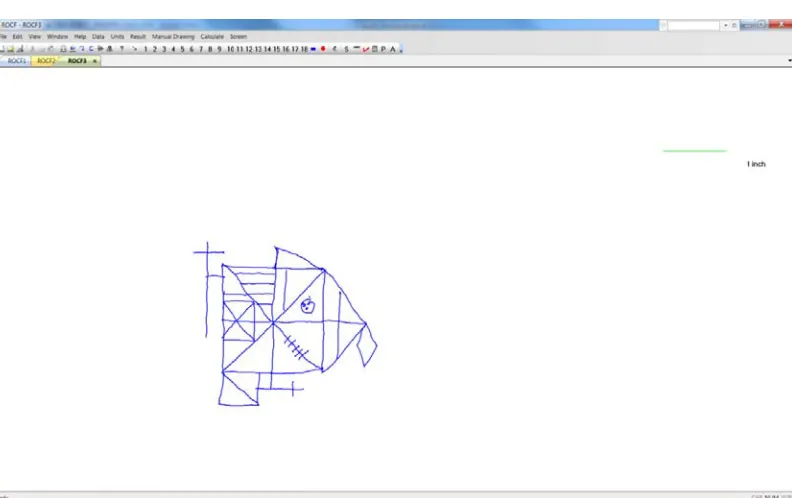
Figure 5-8. Drawing with Novint Falcon haptic device. ... 59
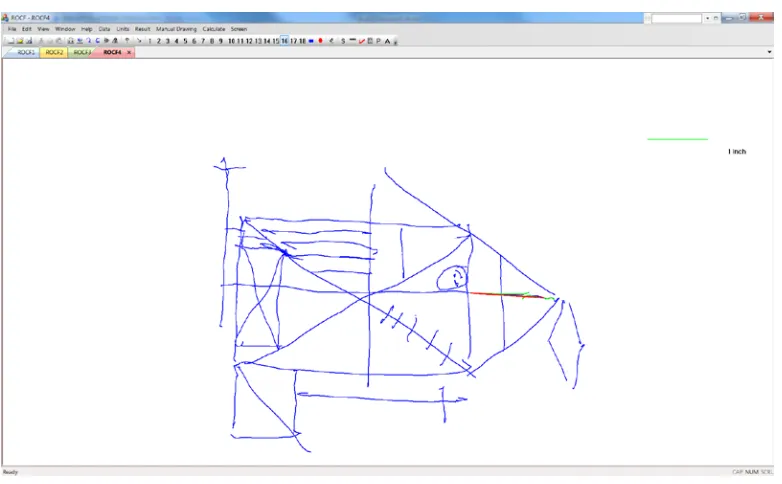
Figure 5-9. Drawing with SensAble Phantom haptic device. ... 60
Figure 6-1. 500 sample points for entire drawing. ... 66
Figure 6-2. 1000 sample points for entire drawing. ... 66
Figure 6-3. 5000 sample points for entire drawing. ... 66
Figure 6-4. 10000 sample points for entire drawing. ... 67
Figure 6-5. Original graphic drawing screenshot. ... 67
Figure 6-6. First stroke in drawing. ... 68
Figure 6-7. First two strokes in drawing. ... 69
Figure 6-8. First three strokes in drawing. ... 69
Figure 6-9. First four strokes in drawing. ... 70
Figure 6-11. Bounding boxes for strokes in drawing. ... 71
Figure 6-12. Corner detection results... 72
Figure 6-13. Results of the Hough Transformation corner detection. ... 73
Figure 6-14. Fitting an ellipse to Unit 11. ... 73
Figure 6-15. Trembling/shaking effects filtered out by segment length control. ... 76
Figure 6-16. Identification of line segments based on angle control. ... 77
Figure 6-17. A drawing defect. ... 78
Figure 6-18. Candidate line segments selected for Unit 2 recognition. ... 80
Figure 6-19. Recognized Unit 2. ... 82
Figure 6-20. Unit 4 in ROCF (highlighted in bold) ... 84
Figure 7-1. Flowchart of clinician user operations. ... 88
Figure 7-2. Windows interface for clinicians. ... 90
Figure 7-3. Standard ROCF (with Unit 8 highlighted). ... 90
Figure 7-4. Open Data File dialog. ... 91
Figure 7-5. A list of data files for a specific patient. ... 92
Figure 7-6. Graphic results generated from a data text file. ... 92
Figure 7-7. An example of a small drawing. ... 93
Figure 7-8. An example drawing which has been scaled to the correct size (relative to the stimulus). ... 94
Figure 7-9. Drawing figure direction adjustment for analysis. ... 95
Figure 7-10. Drawing time dialog. ... 96
Figure 7-11. Images revealing drawing order. ... 96
Figure 7-12. Parameter setting dialog. ... 98
Figure 7-13. A sample figure with “poor” vertical line drawing. ... 98
Figure 7-14. Selection of Unit 1. ... 99
Figure 7-15. Recognized Unit 1. ... 100
Figure 7-16. Automatically recognized lines. ... 100
Figure 7-17. Adjusted Unit 3. ... 101
Figure 7-18. Recognized units indicator. ... 101
Figure 7-19. Stroke Information. ... 102
Figure 7-20. A sample score report for all units in the ROCF. ... 103
Figure 8-1. Automated ROCF system data flow analysis... 107
Figure 8-2. Force model of Phantom Desktop haptic device for the test application. ... 108
Figure 8-3. Force model of Novint Falcon haptic device for the testing application. ... 108
Figure 8-4. Motor control process model of haptic drawing. ... 109
Figure 8-5. Motor control model for rehabilitation training. ... 112
Figure 8-6. Force-feedback assistance model. ... 113
Figure 8-7. Virtual groove for tracing trajectory. ... 114
Figure 9-1. Simple figure for performance assessment after training trials. ... 122
Figure 9-2 Drawing time (in sec.) interaction plot ... 130
ACRONYMS
2D 2- Dimensional
3D 3-Dimensional
ANOVA Analysis of Variance
APL Abductor Pollicis Longus Muscle
BP Back Propagation
DOF Degree of Freedom
DoG Difference of Gaussians algorithm DTP Digitizer Tablet/PDA
ECU Extensor Carpis Unaris Muscle EDM Extensor Digitorum Muscle EMG Electromyograph
EMR Electronic Medical Record
FAST Feature from Accelerated Segment Test corner detection FD Flexor Digitorum Superficialis Muscle
GUI Graphic User Interface HCI Human Computer Interaction HMM Hidden Markov models
ID3 Iterative Dichotomiser 3 algorithm MIS Minimally invasive surgery
NA Neuropsychological assessment PCM Programmable Constraint Machine PD Proportional/Derivative control PDA Personal digital assistant PNN Probabilistic Neural Networks RBF Radical Basis Function
RID Immediate Recall and Delayed Recall test ROCF Rey-Osterrieth Complex Figure
SUSAN Smallest Univalue Segment Assimilating Nucleus(SUSAN) algorithm TBI Traumatic Brain Injury
VR Virtual Reality
CHAPTER 1.
INTRODUCTION
1.1.
Motivation and Objective
1.1.1. Introduction to VR for TBI Patient Diagnosis and Treatment
Virtual reality (VR) was introduced into healthcare in the early 1990s, when people recognized the technology had the potential to provide assistance with complex medical data visualization during surgery and surgery planning [15]. Now the scope of VR applications in medicine has broadened to the areas of neuropsychological assessment and rehabilitation [8, 64, 66]. This study demonstrates how available, advanced VR technology can be used in healthcare for traumatic brain injury (TBI) patient diagnosis and rehabilitation.
With the rapid progress of haptic and computer recognition technology, development of a computer-based system for neuropsychological testing can make diagnosis processes much more accurate and easier to use. Computer-based tests have substantial advantages over traditional paper-based tests due to the fact that the computer can record complete information in a motor-control process, including variables that cannot be easily seen in traditional paper-based tests. Such a system can also simplify the job of examiners and reduce the affects of subjectivity in patient assessment. For example, time-to-task-completion can be accurately recorded by a computer program in real-time, so uneven pacing in skill execution and the rate of production over time can be captured and analyzed later. In paper based testing, this type of measurement can be accomplished by asking subjects to use different task implements and to switch implements at fixed intervals.
• Current diagnosis and rehabilitation therapies for brain injured patients are costly. Professionally trained neuropsychologist and therapists are needed. The work time for each patient is long and depends on the nature of the assessment procedure and therapy.
• Major aspects of the professional work are knowledge-based and repetitive. A computer system has enormous potential in adapting comprehensive expert knowledge into a software system and providing assistance to clinicians in diagnosis and support for decision making process.
Figure 1-1. Rey-Osterrieth Complex Figure.
Yet another benefit of developing a VR-based haptic simulation for presenting the ROCF is that the evaluation of subject accuracy in motor tasks can be performed automatically by the computer system; whereas, in conventional paper and pencil tests, subject performance must be manually scored against a template.
1.2.
Specific Aims
haptic force feedback assistance. By repeating drawing tasks with the system, it is expected that compensatory brain mechanisms may be triggered and reinforced to help TBI or stroke patients in recovery.
TBI Patient Diagnosis and Rehab Therapy
Neuropsychologis
t
Physician
EMR Server
Test and Rehab Data Server
Patient
Patient arrives at clinic
Need neuropsychologi
cal treatment
Neuropsychological tests (include computerized ROCF
test)
Physician meets
the patient Yes
No
Retrieve EMR data for this patient
Retrieve previous diagnosis and therapy data Need rehab Treatment? Rehabilitation Yes
Need no treatment
No
Update patient information in server Diagnosis based on
neuropsychological tests
Upadate test/ rehab results Update patient information
in server
Figure 1-2. Data flow for patient diagnosis and rehabilitation therapy using computer-based system.
For the neuropsychologists, workload is reduced by automating testing and scoring processes. When performed on the VR system, the therapy process is simplified by the use of programmable parameter controls. The results of these processes can be sent to an external server and provide an extension to current Electronic Medical Record (EMR) systems content. Physicians can then review these data, along with the all other important medical information for a patient in order to prescribe a therapy regimen. The parameters of the system can then be set for a patient’s therapy programming.
They can also monitor a patient’s progress and adjust the treatment accordingly, on a regular basis. Beyond this, from the medical record management point of view, parameterized / computerized diagnoses and treatment plans are superior to paper records for documentation and organization of the medical records database.
1.3.
Dissertation Organization
CHAPTER 2.
RESEARCH ISSUES
The system developed in this research includes two major parts: (1) the testing and rehabilitation interface, which is designed to support interaction with patients; and (2) the scoring and diagnosis interface, which supports interaction with clinicians. There are several research issues that need to be addressed in both parts of the system for operation.
2.1.
Intuitive Interaction
The construction of a hardware setup should allow patients to interact with the computer system in an intuitive way. Current TBI diagnosis tests have been standardized based on research on human performance and motor skills required in those tests, as well as the mechanisms for performing the tests. The new system should not require user motor skills beyond those necessary to complete the tests. The physical performance and motor skill required to accomplish the VR-based test tasks should be similar to the performance requirements of the existing physical tests.
2.2.
User Interface Design for Patients
In the computer-based version of the ROCF, patients are required to draw directly on a display screen. The interface between the computer and the patients needs to support two-way interaction, which means the computer responds with visual feedback and haptic feedback in real time and patient performance can be recorded and quantified by the computer. The interaction the computer can develop with patients, in drawing includes providing realistic haptic sensations as part of drawing with paper and pencil.
2.3.
Parameterization of Rehabilitation Process
The ROCF drawing and the training tests conducted using any computer workstation should be customized for patients through adjustable parameters of the system. Therefore, clinicians should be able to implement customized treatment regimens for each patient by defining system parameters settings for them. The types of parameters that can be customized are identified in this research. The implementation of controls for the parameters is also addressed.
2.4.
Segmentation of User Input
For the automated ROCF scoring process, the first research challenge comes in the segmentation of user input in reproducing the figure. The recorded data is a series of points and times. It is possible to group the points into drawing strokes, which start from a virtual pen touching the drawing surface and end with the virtual pen being lifted from the drawing surface. However, scoring of more detailed segments is required.
the left side with the large rectangle (Unit 2). Therefore, the line segment between Point 2 to Point 3 must be identified.
2.5.
Imprecision and Variation in Freehand Drawings
The ROCF scoring process relies on the identification and examination of very detailed features, such as figure corner angles, relations between specific lines, etc. The objective of computer-based recognition is to identify each drawing feature for scoring. This can be very demanding from programming and computational perspectives, as features in freehand drawings can be imprecise. For example, in Figure 2-1 the intersection of the top of the large rectangle and the side lines are major scoring points. However, in the example drawing, there are more than one unwanted intersections in the circled area close to the desired intersection. This makes the recognition process very difficult for a computer system.
Figure 2-1. Example of freehand drawing.
Figure 2-2. Variation of drawing. 1
2 3
2.6.
Drawing Habits, Overtracing and Sketching
Figure 2-3. Overtracing examples.
Figure 2-4. Identified overtracing stroke.
Lastly, the lines in a drawing can be categorized into three groups: horizontal lines, 1
lines can be large. For example, in Figure 2-5, the left most vertical line reflects a major direction change. Although the vertical line can be perceived by human observation, it is challenging for a computer system, to identify the existence of a vertical line based on defined recognition criteria.
CHAPTER 3.
LITERATURE REVIEW
This literature review provides an introduction to current studies that have used the ROCF along with different protocols and scoring systems to assess particular neurocognitive functions. In general, current applications and studies of the ROCF reveal potential users and groups that may benefit from the development of the system presented in this work. The most widely used protocols and scoring systems are identified and have been integrated into the new system.
3.1.
Introduction to the ROCF, Procedures and Implementation
of feedback, including augmented feedback, “knowledge of results feedback” or real-time feedback. In this way, users can see the task results immediately, and tend to be more motivated to continue performance, as compared to the situation without immediate feedback.
3.1.1. Motor Skill Assessment Methods
Effective neuropsychological assessment is a prerequisite for the treatment and scientific analysis of any neurologically based cognitive impairment, for example, patients with TBI. The neuropsychological assessment for these patients serves a number of functions including: (1) assisting in determining a diagnosis; (2) provision of normative information on the status of cognitive and functional abilities; (3) assistance in producing guidelines for the design of rehabilitative strategies; and (4) creation of data for the scientific understanding of brain functioning through the examination of different types of brain damage or dysfunction [90].
visual-constructive function and long-term spatial memory [7], motor functioning and memory [14], planning and organization [28], and graphomotor coordination [9].
A growing interest in use of the ROCF is reflected in recent research and contemporary ROCF applications are expanding. On this basis, a formal sampling of potential ROCF use is warranted [36]. The ROCF is being used to examine varieties of clinical conditions in children and/or adult nervous systems, including acute Lymphoblastic Leukemia [38] for children, amnestic disorders in adults [35, 85], psychological causes/characteristics of rapists [25], alcoholism [18], drug abuse [75], solvent exposure [51], asymptomatic HIV-seropositive status [49], etc.
3.1.2. Standard ROCF Scoring System
A standard approach to scoring the ROCF is described below and was used in the new system development. In general, a score of 0, 0.5, 1 or 2 is assigned to each unit of the figure based on accuracy and placement criteria. Unit scores are then summed to obtain the raw score for the drawing. The same scoring criteria apply to multiple drawing trials. Thus, raw scores ranging from 0.0 to 36.0 may be obtained for all 18 units of the ROCF in copy, immediate recall, and delayed recall trials. For each unit of the figure, a score of 2 is assigned if the unit was drawn accurately, and placed correctly. A score of 1 is assigned if the unit was drawn inaccurately, but was placed correctly. A score of 1 is also assigned if the unit was drawn accurately but placed incorrectly. A score of 0.5 is assigned if the unit was drawn inaccurately and was placed incorrectly. (The unit must be recognizable.) A score of 0 is assigned if the unit was omitted altogether or was drawn inaccurately and placed incorrectly, and was not recognizable.
Table 3-1. Scoring criteria for ROCF drawings.
Scoring Criteria
Score Accuracy Placement
2 Accurately drawn Correctly placed
1 Accurately drawn Incorrectly placed
1 Inaccurately drawn Correctly placed
0.5 Inaccurately drawn, but recognizable Incorrectly placed
3.1.3. Summary of ROCF studies
Many clinical studies have employed the ROCF qualitative and/or quantitative scoring systems. Many research groups have developed scoring systems for different types of applications of the figure. The more comprehensive systems require more time-consuming procedures in clinical practice in order to meet diagnosis requirements. Consequently, some systems have limited popularity in clinical usage.
A tremendous number of ROCF clinical applications have been studied and published. Outside of hospitals and clinics, the ROCF has been used by police and law enforcement organizations for in-depth understanding of criminals, for example, distinguishing rapists from other offenders [25]. The ROCF has also been used for understanding both the long-term and short-term effects of drug abuse on neuropsychological functioning [75], or predicting the memory performance of alcoholics [18].
For most published studies, replicated experiments and extended clinical populations are needed to demonstrate reliable results and provide a basis for wider application of the ROCF. This type of work requires a great amount of time and labor in use of existing methods, for example, use of pen or pencil, stop watch, etc.
This provides further motivation for the development of a computer-based ROCF testing system with the following features:
• Tracking drawing procedures - Qualitative scoring plays an important role in different studies and in most cases, colored pencils are used with the ROCF for recording drawing patterns and qualitative characteristics (e.g., to determine whether or not one feature is drawn before another one). Computers can do the job of capturing qualitative features, including orders and patterns, and make testing easier for examiners, especially when applying comprehensive scoring systems, such as the Boston Qualitative Scoring. • Detailed measurement standards - Larger sample sizes and more diverse
populations can be tested with a computer-based system and detailed measurement standards can be applied in order to meet a variety of research needs.
• Easy modification for scoring systems – A computerized version of the ROCF can allow for changes in the presentation of stimuli, modification of task difficulty, parameters and changes to scoring criteria.
3.2.
Technology Related to Computerized ROCF Test System
The second part of this literature review focuses on current techniques related to design of the computerized ROCF system.
3.2.1. Virtual Reality
databases in real time using their natural senses and skills” [48, 71]. Aukstakalnis and Blastner defined VR as, “a way for humans to visualize, manipulate and interact with computers and extremely complex data” [6] .
The user interface to a VR system can include vision, hearing, touch, proprioception and smell stimuli. A fast computer with powerful video cards (that can do fast computation and generate 3D images) is one of the most critical components of a VR system. Regarding visual displays, computer monitors (CRT, LCD or LED displays), 2D/3D projectors and stereoscopic goggles have been used in prior research. Motion trackers and haptic devices are often used as input devices to transfer user motion behaviors to the computer. Haptic devices can also be used as output devices to provide force feedback sensations to users. Special software is needed to make all of the components in a VR system work together [12, 22, 81].
Mice and joystick interfaces have been widely used in many kinds of VR applications. They are easy to use, and do not have many limitations in setup. Electromagnetic tracking devices have the advantages of low cost and are impervious to optical occlusion problems. Such devices are good for VR applications, which are typically not designed for users sitting in front of a computer screen[77]. The limitation of electromagnetic tracking devices are signal distortion from large metal objects or from electromagnetic fields generated by nearby electronic devices.
Haptic devices have been widely used for many surgical simulation, handwriting training and recognition studies [54, 79, 83]. Haptic devices can be categorized as ground-based and body-ground-based devices [11, 81]. Ground-ground-based haptic devices are usually attached to a base, and can be further categorized according to different control elements, including force-feedback joysticks, pen-based masters, robot arms, floor-grounded exoskeletons, etc. Body-based haptic devices are usually portable and smaller compared with ground-based devices, including arm exoskeletons, hand masters, and cyberforce gloves. etc. They are mounted on the user [4, 27].
Customized software need to be developed for each VR application. In the next paragraph, examples of developed software in healthcare will be introduced, including applications for surgery planning, surgical training, rehabilitation etc.
3.2.2. Virtual Reality in Healthcare
augmented reality for open surgical procedures, and endoscopy and radiosurgery. In recent years, the scope of VR applications in medicine has been broadened to include neuropsychological assessment and rehabilitation [42, 43, 52, 63].
The importance of surgical simulation has already been recognized in medical education programs [45, 76]. VR is a good alternative to on-the-job training in surgical tasks for three reasons: First, traditional surgical training involves training-by-opportunity. There is no guarantee that all surgeons-in-training will have the opportunity to participate in addressing all kinds of disease states related to their chosen surgical specialty. Simulation can ensure that certain kinds of training are available at any time for those trainees. Second, the rising costs of healthcare motivate the use of VR simulation in medical applications. Third, the rapid expansion of minimally invasive surgery (MIS) has reduced the applicability of traditional models of training surgical skills [45]. VR can be effectively used to train MIS.
neuropsychological assessment is intended to be an example of radical innovation in healthcare applications.
3.2.3. Devices Used for Computerization of Neuropsychological Tests
The choice of a proper HCI interface for the new computerized ROCF system is important. The reasons to use HCI interfaces as input devices, versus using scanned images of pencil-paper results, are as follows: (1) For current recognition methods, on-line recognition has a higher success rate than off-line. (2) As reviewed above, qualitative characteristics, such as the order of drawing procedures, are important in many ROCF scoring systems, and direct input from HCI devices provides a solution to capturing this kind of information.
Most popular devices for on-line handwriting recognition can be grouped into three categories:
• A digital pen on patterned paper
• A pen-sensitive surface, such as a touch screen • A haptic device
Figure 3-1. EPOS Digital Pe
According to a study conducted by Cole and Pisano, tablet PCs and digital pens were statistically equivalent to conventional pen and paper in initial data entry speed and in the collection of mammography clinical trial data [16]. Users were equally satisfied with the d-pen and Tablet PC according to a survey, and more satisfied with those two platforms than with a PDA and digitizer Tablet/PDA (DTP) hybridalternatives. Nowadays, most tablet PCs are pre-installed with the handwriting software, such as the built-in handwriting recognition module of Windows XP [88]. Tablet PCs with handwriting recording and recognition functions are a mature technology and have been widely implemented in commercial applications.
writing modes in Srimathveeravalli and Thenkurussi’s system, including: a basic mode, a proportional/derivative (PD) position control and a force control mode. The basic mode was a simulation of traditional pencil-paper writing. In the PD position control mode a reference trajectory was provided to the user for practice and the position control assisted the user in the training process. The force control mode provided users with the opportunity of sharing haptic sensations between two people over a network. Experiment results revealed that with haptic force-feedback information, users achieve better training than with position information. Hand-writing rehabilitation exercises with haptic devices have also been developed for users with hand dysfunctions [33].
3.2.4. Mechanisms of Haptic Device
Haptic devices have been used in various clinical practices. Commercialization of haptic devices makes it possible to familiarize users in hospitals and clinics with such devices in an easy way without special training.
Figure 3-3. Lab built 5-DOF haptic devices [44].
3.2.5. Force Rendering
3.2.3 addresses selection of the device for the VR system and this section focuses on the algorithm selection. It is important to note that visual presentation of an object in VR determines whether or not the virtual object/environment “looks” realistic.
Figure 3-4. Architecture of VR application with haptic force feedback [72].
In this study, three-DOF force interaction has been used. In this literature review, force rendering is introduced in terms of one-DOF, two-DOF, DOF and more than three-DOF interaction.
One-DOF interaction: One-DOF interaction is the simplest way of providing force
rendering; that is, force-feedback along one spatial dimension. The application of one-DOF interaction is limited; however, many interesting effects can be simulated. For example, the operation of pressing a syringe piston can be simulated with one-DOF interaction. Rendering a virtual wall is a very basic one-DOF interaction application, and it serves as a benchmark for haptic system stability [2, 17, 26]. Figure 3-5 shows a virtual wall rendering example.
Freaction= �K(x0 if x > xw
Figure 3-5. Virtual wall using one-DOF interaction.
Two-DOF interaction: There are examples of two-DOF control everywhere, such as the
Figure 3-6. Two-DOF planar PCM.
Three-DOF interaction: This is most commonly used control for the majority of
commercial haptic devices today. Through three-DOF control, users can intuitively manipulate virtual objects in 3D space. At the same time, three-DOF force-feedback makes it possible to simulate material properties of virtual objects, including stiffness and friction on the virtual object surface. Furthermore, complicated simulations, including deformable objects, can be rendered [44].
• More than three-DOF interaction: Torque calculations and rendering is required
lab-present study, we did not use the five-DOF force-feedback device; however, the availability of the technique provides a basis for future research on advanced applications of haptic interaction in clinical practice, especially for rehabilitation systems integrating haptic devices.
3.3.
Handwriting/Drawing Recognition
Computer recognition of handwriting or drawings is one of the most successful applications in computer vision [46]. It is an automated process that uses pattern recognition and machine learning techniques to recognize the written/drawn content. There are two major problem domains in handwriting recognition: on-line and off-line.
On-line recognition: Data are collected while a user is writing on a digitizing surface.
The data recorded include the spatial positions (x, y) as well as the velocity v(t) and acceleration α(t) of pen/stylus movement. Based on {(x, y), v(t), α(t), t}, a recognition algorithm infers written characters or words in real time [46].
Off-line recognition: Only digitized spatial information is available, for example, a
scanned letter. Thus, compared with on-line recognition, off-line recognition has much lower recognition rates.
3.3.1. Feature Extraction
feature extraction needs to overcome the following challenges: different document backgrounds, non-uniform illumination of scans, convolution distortion due to the point spread function of a scanner, noise introduced by electronics and writing tools, and different qualities of paper and types of ink. These problems further motivate the use of on-line recognition methods.
3.3.2. Pattern recognition
There are three basic approaches for pattern recognition: (1) statistical pattern recognition, (2) structural pattern recognition, and (3) soft computing for pattern recognition.
Statistical Pattern Recognition: Recognition is based on decision boundaries established
in the feature space by statistical distributions of the patterns [61]. A decision is usually made by maximizing a posteriori probability, where the recognition error of this approach is called Bayes error. The observations can be represented as a set of random variables and the density function of the observation depends on its class. The classification of a pattern is based on minimizing the overall Bayes error. Hidden Markov models (HMM) are widely used to exploit sequential properties of data and to reduce classification errors.
sequential features in writing. Now, HMMs are also widely used for off-line handwriting recognition.
The general architecture of an instantiated HMM is shown in Figure3-7. Each oval shape represents a random variable that can adopt a number of values. The random variable x(t) is the hidden state at time t (with the model from the below diagram, ). The random variable y(t) is the observation at time t ( ). The arrows in the diagram (often called
From the diagram, it is clear that the value of the hidden variable x(t) (at time t) only depends on the value of the hidden variable x(t − 1): the values at time t − 2 and before have no influence. This is called the variable y(t) only depends on the value of the hidden variable x(t) (both at time t).
Figure 3-7. Probability of an observed sequence.
The probability of observing a sequence of length L is given by
P(Y) =∑L−1P(Y|X)P(X)
x=0 (3-2)
Where the sum runs over all possible hidden node sequences .
HMM methods requires the preprocessing of raw data and feature extraction. The freehand drawing of ROCF with shared features and noises, make the feature extraction for HMM a very challenging problem.
Structural Pattern Recognition: In this method, each pattern class is defined by using
structural descriptions or representations [13, 24]. The recognition is performed according to structural similarities. Regarding specific methods, analysis-by-synthesis was an important early approach proposed by Eden (1968). Recently, fuzzy grammars and graph trees have been widely used for handwriting recognition. Abuhaiba and Ahmed proposed to use a set of 105 fuzzy constrained character graph models, which can tolerate large variations in writing styles, to recognize unconstrained off-line handwritten numerals [1]. Matching graphic structures and relationships between components without parsing is also a popular approach in handwriting recognition. Rocha and Pavlidis developed a character recognition system based on graph transformations [68]. Recently, structural classifiers have also been used in handwritten word recognition.
Neural Networks for Pattern Recognition: Neural networks have also been popular in
Soft Computing in Handwriting Pattern Recognition: Soft computing is a new problem-solving paradigm that combines emerging techniques and theories such as fuzzy logic, neural networks, genetic algorithms, evolutionary computation, and probabilistic methods for complex problems that cannot be solved by conventional mathematical methods. There are two categories: (1) Pattern recognition is based on a single classifier that is formed by combining different soft computing methods, which may include neural networks, fuzzy logic, genetic algorithms, and probabilistic modeling. (2) Pattern recognition is based on the results of several classifiers used together [46].
3.3.3. Circle Recognition
Shifting from handwriting recognition, the Hough transformation is a well-established method for shape detection in drawings. It can be used to detect arbitrary shapes [3]. It is very effective for circle detection. In the ROCF, drawing Unit 11 is one circle with three dots in it. The circle is the most distinguishable object in the drawing. If it can be recognized, Unit 11 can be isolated from the rest of the drawing.
Duda and Hart proposed to use the Hough transformation to detect circles in digitized pictures in 1972 [21]. Kimme, Ballard and Sklandsky proposed a more effective algorithm in 1975 by adding directional information to Duba and Hart’s algorithm [34].
The application of Hough Transformation is described as follows: P(X) contains lines and circles in a digitized picture
𝑿= (𝑥,𝑦) are the coordinates of one pixel
Xp is the set of points {𝑿|𝑝(𝑥) ≠0}
a(X) and r(X) are the centers and radii of each member of 𝑪𝑥, respectively.
Then, for each {(𝑎,𝑟)|𝑋 ∈ 𝑋𝑝} , an accumulator at (a(x), r(x)) in (a,r) space is incremented by unity. The process is performed for all members of Xp and (a(x), r(x)) contains the number of points lying on the circle of radius r(x) and center a(x).
Subsequently, the picture is turned into a grey scale image. An empirical threshold (T) is applied to the content of the accumulator to detect those points, which are likely to be the centers of circles in p(x).
Let’s use f(x) as the gray level in the picture, G(x) is the digitized gradient of f(x), and g(x) and (𝑥) are the modulus and direction of G(x). g1(x) and g2(x) represent the horizontal and vertical components respectively.
So
𝒈𝟏(𝑿) =𝟐𝒔𝟏�𝒇�𝑿+ (𝒔,𝟎)� − 𝒇(𝑿 −(𝒔,𝟎))� (3-3) 𝒈𝟐(𝑿) =𝟐𝒔𝟏�𝒇�𝑿+ (𝟎,𝒔)� − 𝒇(𝑿 −(𝟎,𝒔))� (3-4)
Where s is a positive integer.
𝒈(𝑿) =�𝒈𝟏𝟐(𝑿) +𝒈𝟐𝟐(𝑿)�
𝟏
𝟐 (3-5)
(𝑿) =𝒕𝒂𝒏−𝟏(𝒈
𝟐(𝑿)/𝒈𝟏(𝑿)) (3-6)
3.3.4. Corner detection in Drawing
Corner detection is a very important step in image processing and drawing recognition. The quality of corner detection will affect the quality of image processing and drawing recognition directly.
There are different types of corners: • the intersection of two edges • line endings
• a point on a curve where the curvature is locally maximum • an isolated point
There are many existing methods for corner detection. The Moravec corner detection algorithm was one of the earliest methods [53]. In this study, we used a method developed by Rosten and Drummond called Feature from Accelerated Segment Test (FAST) corner detection [70]. The FAST corner detection method starts with a circle of 16 pixels around a corner candidate p. If there are a set of n contiguous pixels in the circle that are all brighter than the intensity of the candidate pixel 𝐼𝑝 plus a threshold t, or all darker than 𝐼𝑝-t, p will be defined as a corner. All 16 locations on the circle around the candidate points will be tested. Then, each location on the circle relative to p will have one of the three states: darker, similar, or brighter. If p is a corner, then at least n of the locations must all be brighter than
3.3.5. Shape Recognition
Recognizing simple geometries, such as lines, arcs and ellipses, can also be an ambiguous parsing problem. Shileman et al. used a hand coded visual grammar to describe shapes [78]. Alvarado and Davis proposed using dynamically constructed Bayesian networks to parse a drawing, using both bottom-up and top-down interpretations [5].
Shilman’s method inspired the recognition method used in this study. Due to the nature of freehand drawing, ambiguity of features is inevitable. Popular recognition methods (identified in the last section) suffer from fundamental limitations. The accuracy they can achieve is limited due to the fact that most existing ink parsing approaches are adapted from algorithms designed to operate on unambiguous tokens, such as typed text. In freehand drawing recognition, there is inherent ambiguity, for example, the multiple lines in Figure 2-3 as a result of the subject sketching a single line segment. It is also possible that the subject actually means to draw multiple lines. A curved line may represent a curve drawing, or the subject’s original intention may have been to draw a straight line.
In order to accurately deal with such ambiguity in drawings, a recognizer must use context. To use visual language is one of the existing disambiguation techniques [47]. Statistical models are common disambiguation techniques, for example, HMMs. A hand coded visual language was used for shape recognition in this study.
3.4.
Summary
CHAPTER 4.
HAPTIC DEVICE AND WORKSTATION
PROTOTYPING
This chapter presents the prototype workstation designed for the ROCF test system, including the design methodology, the design dimensions, device selection and setup assembly.
4.1.
Introduction
At the beginning of this study, it was decided that the automated ROCF test system would capture user drawings, in real-time, instead of using scanned images of paper-pencil drawings. The reasons for this decision are as follows:
• The automated ROCF test system is demanding in terms of pattern recognition, as accurate assessment of drawings by users with varying abilities must be made for neuropsychological inference.
• As mentioned in the last chapter, on-line pattern recognition has much higher recognition rates than off-line recognition.
• Based on the literature review of ROCF scoring systems, sequential information is important for interpreting ROCF performance; therefore, real-time recognition is useful for qualitative feature extraction (e.g. drawing ordering).
4.2.
Haptic Device Selection
The main reason to use a haptic device, instead of a digitizer (tablet), as the input device was that the haptic device has the ability to record user performance in 3D space along with sequential drawing information. This can provide neuropsychologist with data that can be used to build patient performance models in 3D. Another reason for using the haptic device is that the technology has proved to be useful for handwriting training and rehabilitation applications [80]. Research on persons with motor function disabilities reveals that force-feedback functions in hand control provide unique advantages for upper-limb rehabilitation therapy. With this in mind, and considering that ROCF performance is multifactorial in nature and reflects the integrated contributions of many neurocognitive functions, the capability of several haptic-based controls for the ROCF test system was evaluated.
We choose two kinds of haptic devices for comparison:
Figure 4-1. Sensable Technologies Desktop Phantom haptic device.
The other device examined for the system was the Novint Falcon, which was originally developed for gaming purposes. These two kinds of haptic devices have their own advantages and disadvantages. Characteristics commonly considered desirable for haptic interface devices include:
• low back-drive inertia and friction;
• minimal constraints on motion imposed by the device kinematics, such that free motion feels “free”;
• balanced range, resolution, and bandwidth of position sensing and force reflection; • proper ergonomics that let the human operator focus on the task “at hand” when
wearing or manipulating the haptic interface (pain, or even discomfort, can distract a user from a virtual task, reducing overall performance).
Table 4-1 shows a comparison of the two haptic devices (blank cells indicates specification information was not released by the manufacturer). The Phantom device is superior to the Falcon on every parameter, but the Falcon also costs 1/100 of the Phantom device. This means the Falcon could make the new ROCF system accessible to many more potential users. The selection of the input device is validated in the next chapter.
Table 4-1. Comparison of two haptic devices.
Phantom Falcon
Force feedback workspace
~6.4 W x 4.8 H x 4.8 D in. 4" x 4" x 4"
> 160 W x 120 H x 120 D mm.
Footprint (Physical area device
base occupies on desk)
5 5/8 W x 7 1/4 D in. 9" x 9" x 9"
~143 W x 184 D mm.
Weight (device only) 6 lbs. 5oz. 6 lbs
Range of motion Hand movement pivoting at wrist
Nominal position resolution
> 1100 dpi. >400 dpi
~ 0.023 mm.
Backdrive friction < 0.23 oz. (0.06 N)
Maximum exertable force
at nominal (orthogonal arms)
position
1.8 lbf. (7.9 N)
2lb
Continuous exertable force (24
hrs.)
0.4 lbf. (1.75 N)
Stiffness
X axis > 10.8 lbs. / in. (1.86 N / mm.)
Y axis > 13.6 lbs. / in. (2.35 N / mm.)
Z axis > 8.6 lbs. / in. (1.48 N / mm.)
Table 4-2. Continued
Force feedback x, y, z
Position sensing x, y, z (digital encoders)
[Stylus gimbal]
[Pitch, roll, yaw (± 3% linearity
potentiometers)
Interface Parallel port
Supported platforms Intel-based PCs
OpenHaptics™ toolkit
compatibility
Yes
Applications
Selected Types of Haptic Research,
the FreeForm® Modeling™, and the
FreeForm® Modeling Plus™ systems
Degrees of Freedom of
Positional Sensing
6 3
4.3.
Workstation Design
is not applicable to the Falcon’s ball-shaped hand-control (Figure 4-2). Consequently, a semi-transparent rear projection screen was used for the image display. In this way, users can see the projected image of drawing results and through the image they can see the movement of their hand at the same time.
Figure 4-3. Design of workstation based on user physical and cognitive information requirements.
Figure 4-4. Lab-built chair.
4.4.
Summary
CHAPTER 5.
A COMPARISON OF HAPTIC DEVICES FOR
COMPUTER-BASED REY-OSTERRIETH COMPLEX FIGURE
TESTING
5.1.
Introduction
In this study, two commercially available interactive haptic devices were evaluated including the Phantom, manufactured by SensAble Technologies (see Figure 5-1, the device on the top of the rack) and the Falcon, manufactured by Novint Technologies (also see Figure 5-1). In order to compare the devices with pen-paper drawing, a Wacom Cintiq tablet was also used, covered under paper to which the Wacom inking pen was applied (Figure 5-2). This allowed for accurate recording of the pen drawing procedure and time. The ROCF drawing system ran on a high-performance Dell graphics workstation.
Figure 5-2. Wacom Cintiq Tablet used to record pen-paper drawing.
Users of the Novint Falcon haptic device and the SensAble Technology haptic device were compared with pen-paper users in terms of three aspects of performance:
• Physical behavior • Time to completion
• Drawing accuracy and placement
In the following sections, the fuzzy model of handwriting is described, as background material. The experiment environment and protocol are presented, followed by the experimental results and statistical analysis. Finally, a discussion and suggestions for future work are provided.
5.2.
Related work
5.2.1. Fuzzy Model for Handwriting
In 1962 Denier Van der Gon proposed a physical model of the handwriting process as a basis for ergonomic intervention in the design of writing tasks [86].
Figure 5-3 Model of hand and muscle system
The above research demonstrated that EMG signals of muscles during handwriting processes can be used to represent the physical performance of subjects in drawing tasks.
5.2.2. ROCF Scoring System
A standardized approach to the scoring of the ROCF, based on the criteria developed by Rey [62] and presented in Lezak [40], was used for user performance assessment in the present study. Table 3-1 presents the general scoring criteria for the ROCF test. Unit 6 in the ROCF was used as the test unit in this study (see Figure 5-4). The specific scoring criteria were as follows:
Accuracy: A small rectangle should be drawn within the area defined by the left
vertical side of the Large Rectangle and the two lines that form the Diagonal Cross.
The small rectangle should be composed of four line segments. The line segments
intersection no more than 1/8 inch. The lines should fail to intersect at a corner by no
more than 1/8 inch. The height of the small rectangle should be greater than its width
and generally proportional to the complex figure stimulus. Within the Small
Rectangle are two diagonal lines that connect adjacent corners of the small
rectangle. These lines should not overshoot or undershoot the corners by more than
1/8 inch.
Placement. The midpoint of the Small Rectangle should not deviate from the
Horizontal Midline by more than 1/4 inch. The intersection of the two small diagonals
within the Small Rectangle should not deviate from the area defined by the left
vertical side of the Large Rectangle and the Diagonal Cross more than 1/4 inch at
any point.
5.3.
Experiment
5.3.1. Participants
Three (3) subjects were recruited as participants for the experiment through word of mouth and email. All participants were from the North Carolina State University student population.
Subject visual acuity was a selection criterion. Any volunteer indicating a corrected visual acuity less than 20/20 was excluded from participation in the experiment. This was due to the visual requirements of the simulated task and the need for all visual display information to be perceived by subjects to effectively perform the ROCF reproduction. Personal computer experience was also used as a selection criterion. All subjects were required to have some basic computer experience such that they were familiar with typical control devices, including a mouse and keyboard. These criteria were verified through use of a subject survey (presented in Appendix B) administered at the start of the experiment.
5.3.2. System Setup and Apparatus
Figure 5-5. Muscles monitored by EMG.
5.3.3. Procedure
After completing the consent forms and survey, participants were asked to don four (4) pairs of electrodes. Base line force (relaxed muscles) and maximum force exertion were recorded. Subjects were then asked to practice drawing with the Wacom tablet covered by paper, the Novint haptic device and the Phantom haptic device.
Two training trials for each device were conducted. Subjects were asked to draw Unit 6 of the ROCF with each device. Extra training trials were provided if a subject asked for more practice to become familiar with a device.
subjective workload assessment tool (presented in Appendix D). This was followed by the experiment trials. The experiment was designed as a Latin Square:
Table 5-1. Experiment design following a Latin Square.
Subject Trial 1 Trial 2 Trial 3 Trial 4 Trial 5 Trial 6
Subject 1 Paper Paper Falcon Falcon Phantom Phantom
Subject 2 Falcon Falcon Phantom Phantom Paper Paper
Subject 3 Phantom Phantom Paper Paper Falcon Falcon
5.4.
Results
5.4.1. Physical Performance
Figure 5-6. Average muscle activity for four muscles using different drawing devices.
Table 5-2. ANOVA results on EMG responses.
Muscle ANOVA
Abductor Pollicis Longus Muscle (APL) F(2,13)=52.48, p<0.0001***
Extensor Carpis Unaris Muscle (ECU) F(2,13)=4.04, p=0.04*
Extensor Digitorum Muscle (EDM) F(2,13)=14.13, p=0.0005***
Flexor Digitorum Superficialis Muscle
(FDS) F(2,13)=9.78, p=0.0026*** 0% 10% 20% 30% 40% 50% 60% 70% 80%
APL ECU EDM FD
%MV
C Phantom
Novint
A A
B A B A
B
A B B
Correlation analysis showed that subject performance with the Novint device was less related to performance with the pen-paper than the Phantom haptic device (see Table 5-3).
Table 5-3. Correlation analysis for devices.
Novint Paper Phantom
Novint 0.0702 0.2776
Paper 0.0702 0.4583
Phantom 0.2776 0.4583
5.4.2. Time–to-Completion
Figure 5-7. Time to Completion (second).
Table 5-5 reveals the influence of the device completion time. Table 5-5 shows that there was no significant difference between time-to-completion with the Phantom haptic device vs. Falcon haptic device, but the completion time for drawing on paper was significantly different.
Table 5-4. ANOVA results on completion time with three devices. 0
10 20 30 40 50 60
Novint Phantom Paper
Source DF Sum of squares Mean Square F Value Pr>F
Model 2 4.04161428 2.02080714 11.40 0.0010
Error 15 2.65871998 0.17724800
Table 5-5. Tukey Test results on time-to-completion (log transformed) with three devices.
Tukey Grouping Mean N Device
A 3.7570 6 Phantom
A 3.5536 6 Novint
B 2.6657 6 Paper
5.4.3. Accuracy and placement
Subjects complained about difficulty in controlling the Novint Falcon device, due to the fact that tiny adjustment movements were exaggerated by the device. The low resolution of the control translated into a zigzag pattern in line drawing and overshoots or undershoots at intersections/corners.
The graphic drawing results of the Phantom haptic device were similar to pen-paper drawing. Figures 5-8 and 5-9 show the drawing results of one subject. Figure 5-9 reveals an overshoot at the upper left corner, which is a major scoring point for the ROCF testing.
Figure 5-9. Drawing with SensAble Phantom haptic device.
5.4.4. Post-experiment Questionnaire
5.4.5. NASA-TLX Survey Results
At the close of each test trial, ratings of the workload demand components as part of the TLX were conducted. These ratings were integrated with the demand component rankings completed at the beginning of the study as a basis for calculating a composite workload score. The NASA-TLX workload assessment showed that the average workload score was 49.96. The lowest score was 35.33 and the highest was 65.72. The hypothesis was that subjects who had prior experience with haptic devices would produce lower workload scores. The subject with experience in using haptic device for research gave the lowest score, which supported the hypothesis.
5.5.
Discussion and Conclusion
This study showed that both haptic devices, the SensAble Phantom and Novint Falcon, caused forearm muscle activity levels in the ECU, EDM and FD comparable to those observed in pen-paper based drawing tests. There was higher muscle activity in the EDM and FD when using the Phantom device compared to Novint falcon and pen-paper drawing. One possible explanation for this finding is that the Phantom device stylus tip is connected to a robotic arm, which is also connected to the base of the device. The arm rotates around the tip during the drawing process. Consequently, subjects frequently lifted their hand or tilted their wrist, for a better viewing angle on the drawing or a better holding position to avoid the influence of the stylus arm.
drawing compared with the haptic devices. This can be attributed to the frictional force of the tablet stylus on the paper surface and the need to maintain a greater APL muscle force to stabilize the implement relative to stabilizing the Phantom stylus or Falcon ball in free space. In general, the limited differences in muscle activities using different drawing methods suggests that from a biomechanical perspective the haptic devices may be considered as alternate equipment for delivering the ROCF test.
However, it was also observed that the two devices caused significant increases in task completion time compared with the pen-paper tests. The reasons for the extra task time with the haptic devices may include the following:
• A lack of depth cues - Subjects said that they felt they needed to slow down their movement when the virtual pen started to get close to the virtual writing surface, until the pen actually touched the writing surface. Since subjects had to constantly lift the pen and move to a certain point for the next stroke trajectory, the overall completion time increased.

![Figure 3-3. Lab built 5-DOF haptic devices [44].](https://thumb-us.123doks.com/thumbv2/123dok_us/1341373.1167055/42.612.173.468.92.395/figure-lab-built-dof-haptic-devices.webp)