Faculty of Computer Science & Information Systems
Universiti Teknologi Malaysia
Final Report
Development of Compound Clustering
Techniques Using Hybrid Soft-Computing
Algorithms
PROJECT NUMBER: 04 - 02 - 06 - 0093 EA001
VOTE NUMBER: 74252
of molecules. With the advent of combinatorial chemistry, a vast number of compounds can be available either physically or virtually, which can make screening all of them infeasible in terms of time and cost. Therefore, only a subset of the entire database that encompasses the full range of structural types of the underlying dataset needs to be selected for screening to maximise the likelihood of finding as many biologically distinct active compounds as possible in a screening experiment. One of most used compound selection method is cluster-based compound selection, which involves subdividing a set of compounds into clusters and choosing one compound or a small number of compounds from each cluster. Selecting only representative compounds from each cluster is based on the assumption that structurally similar molecules have similar properties. A good clustering method groups similar compounds together, to ensure all activity classes are represented, whilst separating active and inactive compounds into different sets of clusters, to avoid an inactive compound being selected as a cluster representative.
Hierarchical clustering methods such as Ward’s and Group Average are considered industry standard for compound selection purposes. Previously, there is limited work on the clustering and classification of biologically active compounds into their activity based classes using fuzzy and neural network. Furthermore, it has been found that many of the biologically active molecular structures exhibit more than one activity in which case they can be used as drugs for the treatment of more than one disease. However, previous clustering methods on chemical compounds are mostly limited to hard partitioning, which allows a compound to belong to only one cluster.
In this work, neural, fuzzy and hybrid methods are utilized for the clustering of biologically active molecular structures into their corresponding activity classes. The methods have been evaluated for their performance on MDL’s MDDR, NCI’s AIDS and IDDB drug databases containing various biologically active classes of molecular structures. The neural network methods use a number of heuristics to find appropriate parametric values. Initially, the heuristics needs user intervention to select optimal values, which give poor results. To overcome this problem, fuzzy memberships have been employed to find optimal parameters. Since fuzzy clustering methods such as the fuzzy c-means and fuzzy G – K are computationally exhaustive in terms of time and memory requirements, a hierarchical approach have also been used in this work for their implementation. The hierarchical fuzzy clustering algorithm developed in this work assign the overlapping structures (structures having more than one activity) to more than one clusters if their fuzzy membership values are significantly high for those clusters.
TABLE OF CONTENT
Chapter 1 ...3
Introduction
...3
1.1. Background of the Problem
...5
1.2. Problem Statement
...7
1.3. Objectives of the Study
...8
1.4. Scope of the Study
...9
1.5. Milestones of the Project
...9
1.6. Research Frame Work
...11
1.7. Research Contributions
...12
1.8. Report Organization
...13
Chapter 2 ...14
Chemoinformatics and Compound Clustering
...14
2.1. Chemical Structures Representation
...15
2.1.1. Fragmentation Codes
...16
2.1.2. Linear Notations
...17
2.1.3. Connection Tables
...17
2.2. Molecular Descriptors
...18
2.2.1.
2-Dimensional Descriptors
...18
2.2.2.
3-Dimensional Descriptors
...21
2.3. Classical Clustering Methods
...23
2.3.1.
Single Linkage Algorithm
...26
2.3.2.
Complete Linkage algorithm
...26
2.3.3.
Group Average Algorithm
...26
2.3.4.
Centroid Clustering Algorithm
...26
2.3.5.
Median Clustering Algorithm
...27
2.3.6.
Ward’s Clustering Algorithms
...27
2.3.7.
Single Pass Algorithm
...28
2.3.8.
Jarvis Patrick’s Algorithm
...29
2.3.9.
K-means Algorithm
...29
2.4. Classification of Chemical Compounds
...30
Chapter 3 ...31
Neural Networks and Compound Clustering
...31
3.1. Unsupervised Neural Networks
...33
3.1.1. Kohonen Neural Network
...33
3.1.2. Neural Gas Network
...34
3.1.3 Enhanced Neural Gas (ENG) Algorithm
...36
3.2. Supervised Neural Networks
...37
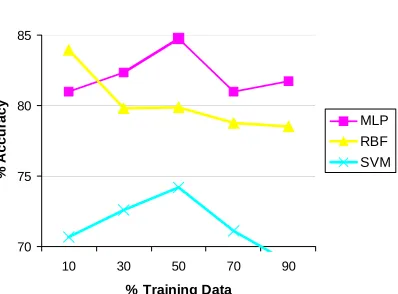
3.2.1. Multi Layer Perceptron(MLP)
...37
3.2.2. Radial Basis Function (RBF) Network
...39
3.3. Other Machine Learning Methods
...39
3.3.1. Support Vector Machines
...39
3.3.2. Rough Set Classifier
...41
3.4. Experiments and Results
...42
3.4.3 Experiment 3
...51
3.5. Summary
...53
Chapter 4 ...55
Fuzzy Logic & Compound Clustering
...55
4.1 Fuzzy Logic
...55
4.2. Fuzzy Set Theory
...56
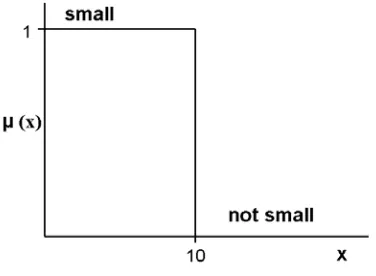
4.3. Membership Function
...57
4.4. Fuzzy Clustering
...60
4.4.1. Hard and Soft Clustering
...61
4.4.2 Fuzzy c-means
...64
4.4.3 Fuzzy Gustafson- Kessel Algorithm
...67
4.4.4 Modified Gustafson- Kessel Algorithm
...69
4.5 Experiments and Results
...72
4.5.1 Experiment 1
...72
4.5.2 Experiment 2
...76
4.6. Summary
...80
Chapter 5 ...82
Hybrid Techniques and Compound Clustering
...82
5.1. Fuzzy Kohonen Self-Organizing Feature Map
...82
5.1.1. Fuzzy Kohonen Network (FKN) Algorithm
...84
5.2. A Hierarchical Fuzzy Algorithm
...87
5.3. Validity of Clustering for Fuzzy Hierarchical Algorithm
...89
5.4. Genetic Algorithm and Clustering
...91
5.5. Experiments and Results
...92
5.5.1. Experiment1
...92
5.5.2. Experiment 2
...95
5.5.3. Experiment 3
...103
5.5.4. Experiment 4
...106
5.6. Summary
...110
Chapter 6 ...111
Discussions and Conclusions
...111
6.1. Research Objectives and their Achievements
...111
6.2. Neural Networks and Chemical Structures
...112
6.3. Fuzzy Clustering
...113
6.4. Hybrid Clustering Methods
...113
6.5. Conclusion
...114
Chapter 1
Introduction
Clustering and classification of chemical databases has tremendous significance in the process of in silico drug designing and discovery. In the field of drug designing and discovery the researchers want to find a subset of compounds or molecules from a large dataset of compounds that can potentially inhibit, block or stop the activity of a malignant protein or enzyme, for further rigorous studies of each and every molecule as a potential drug candidate. These rigorous studies include, engineering of new compounds chemically or genetically or modification or refinement of the current molecules for enhanced disease fighting activity, prediction and improvement of absorption, distribution , metabolism, excretion and other toxic (ADMET) properties, and studies conducted during clinical and pre-clinical administration of the drug for approval [1].
The computational systems used in drug discovery and designing are based on two approaches: one the structure based approach when the 3D structure of the biological target (protein or enzyme) involved in the disease is available, and second the ligand based approach where structural information of known drugs (highly active molecules) are mapped for mining similar molecules from large molecular database [2], and this second approach is the basis of this work. The molecular structure that comprises a number of atoms, special groups of atoms, the bonding arrangements between various atoms and groups, the bond angles and the bond lengths, is responsible for many activities and properties of the molecule. This whole research is based on the similar property principle which states that structurally similar molecules exhibit similar biological activities [3] .
compounds the classifier are trained and after training the classifier is used for the selection of similar compounds. Thus classification is a supervised mechanism, where the system is first trained with help of a priori known examples and then used to classify an unknown dataset into specific classes for which the system is trained.
Generally the main objective of Clustering (or cluster analysis) is to organize a collection of data items into some meaningful clusters, so that items within a cluster are more similar to each other than they are to items in the other clusters. This notion of similarity and dissimilarity may be based on the purpose of the study or domain specific knowledge. But one thing must be kept in mind that, from clustering, we always mean unsupervised classification of data, a course where there is no teacher to provide any guidance of the path. In other words, there is no pre notion about the groups and their number (may or may not be) present in the data set. Cluster analysis and classification are widely used in many diverse fields such as engineering, electronics, biology, medicine, archeology, the social sciences and astronomy, and thus a large number of algorithms have been developed.
Although, the research on the development of new and robust clustering methods is an on going process [4, 5], most of the methods used in the field of chemoinformatics are hierarchic in nature which are not good because of their higher time and space complexities but suits the partitioning of chemical structures because of its tree like branching of the datasets into biologically active groups. An important issue related with these methods is their non overlapping nature. In non-overlapping methods each object (molecule) belongs to only one cluster. These methods also uses distance measure like Euclidean which support only same size and shape for all the clusters. The clustering methods that support overlapping clusters, are efficient time wise and allow the clusters to have any independent shape and size are required for the clustering of natural and real databases like molecular structures.
Both clustering and classification are important data analysis approaches. The classification can be used in situation where partly some knowledge about some of the groups in the data is already known whereas clustering is used in situation where there is no knowledge available about the clusters in the dataset. So, classification is a trained process and the training is based on known examples of data and clustering is not based on training.
chemical structures a number of approaches have been adopted such as the neural networks and support vector machines.
1.1. Background of the Problem
Chemoinformatics can be defined as the discipline of storing, processing and retrieving chemical information using computers. It is a relatively new discipline of science and technology that flourished well in the last 10 to 15 years. Chemoinformatics in its name encompasses all the fields related to the discovery and design and the processing of chemical compounds with the help of computers such as computational chemistry, computer chemistry, chemometrics, chemical information, and QSAR [6]. This field is differentiated from other data processing fields by such requirements as to work with chemical compounds or molecular structures. This requirement urged the researchers to find new ways and methods to represent, store, process and retrieve chemical compounds in computers.
The representation of molecular structures is very important in clustering and all other aspects of chemoinformatics. The molecular descriptors should be able to accurately represent the chemical properties and biological activities of the chemical compounds. The molecular descriptors can be categorized into three main categories namely 1-Dimentional, 2-Dimentional and 3-dimentional.
The term cluster analysis was first used by Tryon in 1939 that encompasses a number of methods and algorithms for grouping objects of similar kinds into respective categories [8]. The aim of a cluster analysis method is to partition a given set of data or objects (compound structures) into clusters (subsets, groups, classes). This partition should have the following properties [9]:
• Homogeneity within the clusters, i.e. data that belong to the same cluster should be as
similar as possible.
• Heterogeneity between clusters, i.e. data that belong to different clusters should be as
different as possible.
In the last six decades of clustering life starting from Tryon [8] until now a large number of methods and ways had been developed that can cluster the underlying datasets. However the effects of each method are different, keeping in view the objective of clustering, the ways these methods work and the variability of the application area.
In computational chemistry, a large number of crisp non overlapping methods have been effectively used. These clustering methods can be divided into hierarchical and non hierarchical methods. In hierarchical methods in each step of iterative process, a pair of clusters is either merged together to form a new cluster or a bigger cluster is divided into two more homogeneous clusters, with a tree like parent/ child relationship established between clusters at each successive level of iteration. On the other hand, in non hierarchical methods, the data set is divided into a number of overlapping or non overlapping clusters in which there is no hierarchical relationships among the clusters.
The applications and evaluation of these methods in clustering chemical datasets have been discussed by many researchers. Downs and Bernard [10, 11] have given a good review of most of the clustering methods for processing of chemical structures dataset. The most significant work is done by Peter Willet and his students on the clustering of a variety of compounds databases using 2D fingerprint descriptors [12-14]. In [15] a number of methods like Wards [16] and Jarvis-Patrick [17] have been evaluated against a number of 2D and 3D fingerprints like MACCS fingerprints, MDL fingerprints and it has been shown that the performance of Wards hierarchical clustering method is the best.
classification of compound structures into two binary groups of active and non-active structures [24-27].
In this work a number of methods have been developed based on the fuzzy, neural, hierarchical, rough sets, genetic algorithms and the hybrid methods based on the combination of these methods for the clustering and classification of chemical compounds and some of these methods show improved performance over the classical methods. Some of the techniques based on fuzzy memberships such as fuzzy and fuzzy hierarchical developed in this work are better for analyzing overlapping datasets. Many of the algorithms here are evaluated on multi class datasets as opposed to only binary class datasets which have been used in most of the studies so far conducted.
1.2. Problem Statement
In recent years, fuzzy logic and artificial neural networks have attracted considerable attention as candidates for novel computational systems, because of the variety of the advantages that they offer over conventional computational systems. If we think in terms of control systems, these methods can be regarded as model free systems as they do not require an exact mathematical model of the controlled process. These methods have the inherent capability to model non linear systems from the input –output data. They share a common framework of trying to mimic the human way of thinking and provide an effective and promising means of capturing the approximate, inexact and vague nature of the real world processes. If fuzzy logic has efficient and simple modeling abilities on one hand, neural networks have good learning capabilities on the other hand. Here in this work, we will evaluate the neural, fuzzy and traditional clustering methods and combine the merits of these techniques to develop more robust, reliable and intelligent methods for the clustering of chemical compounds.
for the clustering of chemical structures. The results of the method are very encouraging as compared to a similar implementation of the hard k-means method.
In this work besides neural network and fuzzy logic some other approaches like rough sets, support vector machines and genetic algorithms have been investigated for improved analysis of the chemical structure databases.
In this work it has been tried to find answers to the following questions:
• How can new algorithms be developed that are robust, reliable, efficient and their
performance is better than current methods in clustering drug like molecular structures into their activities?
• How well the fuzzy clustering methods like fuzzy c-means, G-K Algorithm, GG
Algorithm can be extended for the clustering of multi class and overlapping chemical datasets?
• What are the main neural network techniques that can improve the clustering and
classification of chemical structures?
• What are the advantages of fuzzy and neural clustering methods?
• How can fuzzy and unsupervised neural network methods be combined to develop
new and refined data analysis tools for chemical datasets?
• How can other methods like rough sets and genetic algorithms be employed to
improve the performance of data analysis tools?
1.3. Objectives of the Study
The main objectives of this study can be summed up in the following lines:
• To develop robust, efficient, reliable and high performance algorithms for the
clustering of chemical compounds into biologically active classes.
• To develop fuzzy and neural methods for clustering of chemical datasets.
• To enhance and improve the current fuzzy and neural clustering methods for
application in clustering of chemical datasets.
• Since the chemical data is multidimensional, so, our objective is to look for clustering
methods that could effectively and accurately cluster chemical datasets.
• The chemical datasets are considered large databases of thousands of compounds
structures, so, it is our objective to develop clustering methods based on fuzzy and neural paradigms to be able to cluster large datasets.
1.4. Scope of the Study
This work will focus on the clustering and classification of chemical datasets with the help of traditional hierarchical, fuzzy, neural and hybrid methods such that the objectives of the research outlined in section 1.3 are achieved. The study outlines the different methods used for clustering and classification of chemical compounds in this project. There are a large number of representation schemes available for representing the chemical and biological properties of molecular structures, this work use only 2D descriptors such as topological descriptors and BCI fragment bits screen [28].
In this work chemical compound datasets from sources like MDDR drug database [29], NCI AIDS database [30] and Investigational drug database (IDDb) [31]will be used.
1.5. Milestones of the Project
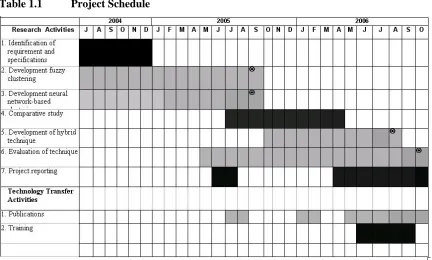
The project is divided into four main milestones and a number of activities along with a tentative time line for the achievements of the milestones and objectives. The milestone and the timeline are briefly discussed here.
Fuzzy logic has been employed in almost all spheres of science and technology and during the course of time a number of robust and reliable clustering methods have been developed. The objective here is to employ these fuzzy based clustering methods for the clustering of chemical structure databases. A number of clustering methods such fuzzy c – means and Gustafson – Kessel will be utilized to improve the clustering of chemical structures. Besides development of algorithms, a number of other tasks such as data collection, data formatting will also be part of the schedule.
2. Development of Neural Network based Compound Clustering
In this part of the project algorithms based on neural networks will be developed for the clustering of chemical structures databases. As discussed in the literature review, a number of neural networks have been employed by the researchers for this purpose, but most of these works deals with problems like separation of chemicals into drug and non- drug classes. However, our approach is to partition the space of drug like compounds into their biologically active classes and so the problem becomes very precise and multi class instead of binary class. Here a number of networks such as Kohonen Self- Organizing Maps (SOMs), Neural Gas, and adaptive resonance theory based networks will be employed.
3. Development of Hybrid Compound Clustering
Based on the achievements of the previous two milestones, the good traits of the three approaches, neural, fuzzy and classical hierarchical clustering will be combined to arrive at more robust, reliable and more easy to use compound clustering methods.
4. Evaluation of Compound Clustering Techniques
In this part of the work, the methods developed in the previous three milestones, will be compared with the existing benchmark compound clustering techniques. Besides utilizing some of the benchmark and artificial datasets, a number of drug datasets of compounds with varying characteristics will be developed for the comparison of the techniques.
Table 1.1 Project Schedule
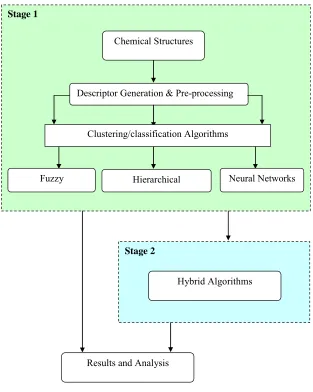
1.6. Research Frame Work
This research had been performed in two stages, stage1 was dedicated to the initial work which composed of the evaluation of the existing important clustering and classification methods based on hierarchical, neural and fuzzy approaches; and in stage 2 some of such techniques were combined to obtain hybrid methods for the clustering and classification of chemical databases.
The first phase of the research concentrated on the development of classical hierarchical methods like Ward’s, Group Average and Jarvis Patrick, fuzzy methods like fuzzy c-mean, fuzzy Gustafson Kessel and neural methods like neural gas, enhanced neural gas, kohonen self organizing maps etc. In this stage a number of classification methods have also been used for the analysis of chemical structures like back propagation neural network, radial basis function neural network and support vector machines.
In stage 2 a number of methods based on the combination of hierarchical methods, neural networks, fuzzy logic, genetic algorithms and rough sets had been employed for the clustering and classification of molecular structures.
1.7. Research Contributions
Clustering and classification of biologically active chemical compounds into their respective classes has a number of applications in almost all the phases of modern computer aided drug designing and other chemical information processes. Currently, most of the industrial systems are based on the traditional methods of clustering chemical compounds like the hierarchical Ward’s and non-hierarchical Jarvis-Patrick methods. These methods suffer from a number of
Stage 1
Fuzzy
Descriptor Generation & Pre-processing Chemical Structures
Neural Networks Hierarchical
Clustering/classification Algorithms
Stage 2
Hybrid Algorithms
Results and Analysis
In this work a number of fuzzy based clustering methods which can be referred to as fuzzy objective function based methods, unsupervised neural methods and the combination of the hierarchical, fuzzy and neural methods have been developed and applied to the analysis of chemical structures for the first time. A few classification methods based on neural networks and support vector machines have also been considered for classification.
1.8. Report Organization
Chapter 2
Chemoinformatics and Compound
Clustering
The applications of computers in chemistry are almost as old as the arrival of computers themselves. Although first computer, the ENIAC (Electronic Numerical Integrator and Computer) was built for the US Army Ordinance Department in 1943 but its functionality was very limited and the first UNIVAC (Universal Automatic Computer) was delivered to the US Census Bureau in 1951. The first company Quantum Chemistry Program Exchange (QCPE) was formed at Indiana University to distribute quantum chemistry codes in 1963. But in fact the right start in computational chemistry was the foundations of two companies Health Design Inc and Molecular Design Inc in 1978, only three years later than the foundation of Microsoft in 1975, for the development of products in computational chemistry. The first product of the Health Design was TOPKAT a program for the prediction of molecular toxicity and that of Molecular Design Inc was the MACCS chemical database [32].
Now a day the name of this field of research is chemoinformatics or chemiinformatics which deals with all the techniques for the processing of chemicals using their structural information. It includes the methods for storing and retrieval of chemical structures, ADMET and QSAR prediction, diversified compound selection, and compound docking etc.
In this chapter fundamentals of chemoinformatics which are important from the clustering and classification point of view are discussed. The clustering and classification methods developed and applied to chemical structure analysis are reviewed. When we talk about processing of chemical compounds by computers, the first question that comes into one’s mind is how to represent molecules for their computational processing. The next section tries to give some representation schemes used in chemoinformatics. Since, most of the clustering and pattern recognition techniques characterize various objects in the dataset with the help of some features of the objects, known as descriptors in chemoinformatics are also discussed. Another important factor in the clustering and pattern recognition is the use of coefficient of similarity, dissimilarity or a distance measure between every pair of objects (structures) in the dataset. So, a number of important distance and similarity coefficients are described before giving the details about the clustering and pattern recognition techniques used in chemical structures analysis.
2.1. Chemical Structures Representation
Today, many chemistry and drug related organizations have their publicly accessible and proprietary databases of chemical compounds, containing large number of molecules; several hundred thousand is a common figure and some have even billion of compounds. Many have virtual libraries of compounds generated using computational techniques that can be converted to chemicals using combinatorial chemistry techniques.
representation due to which it forms the basis of most present day computer libraries and systems.
2.1.1. Fragmentation Codes
Fragmentation codes were the first to be used as structural representation in chemical retrieval systems like structure and substructure searching and are still in use. A fragment code is a set of pre defined substructure attributes, the presence or absence of which is used as
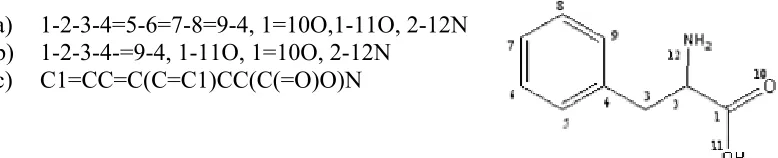
characterization of a molecule. Figure 2.1 shows the possible fragments in phenylalanine.
A fragment code representation has several problems because of its subjective nature. The system is not standardized and so every organization has their own specific code order for its own database of compounds. For example, a retrieval system for IR spectroscopy data would adopt a very different fragmentation code from a system designed for the retrieval of organo-phosphorous compounds. The coding of new compounds is normally a manual task and sometimes all the molecules need to be recoded if the code is changed because of the addition of a new compound [35]. Fragmentation Codes also results in ambiguous representation for the molecule as the set of codes assigned to a molecule might be interconnected in a different number of ways.
Fragments:
-OH
>C=O
-COOH
-NH
2-Ph
2.1.2. Linear Notations
It is an alphanumeric method to represent the chemical graph of a molecule and is very short as compared to the fragmentation codes, so, well suited for storing and transmittion of molecules. A large number of notational schemes like Wiswesser [36], ROSDAL [37], Sybyl Line Notations (SLN) [38] have been developed before the SMILES notation by Weininger in 1988 [39]. The SMILES notation has obtained a wide spread acceptance because of its easiness to use and comprehend than the Wiswesser Line Notation (WLN) which had been in use for more than three decades since its development in 1954 [36]. SMILES is the only line notation that has the capability to encode the contents of an connection table as opposed to other predecessor line notation schemes. Connection tables are another sophisticated structure representation scheme discussed next. There are a number of enhancements of SMILES (like XSMILES, SMARTS, SMIRKS, STRAPS, CHUCKLES, CHORTLES, CHARTS, etc) [40] designed either to represent special molecular structures or to allow specific applications like database handling, reactions, or polymers. Figure 2.2 shows ROSDAL and SMILES notations for the phenylalanine.
(a)
1-2-3-4=5-6=7-8=9-4, 1=10O,1-11O, 2-12N
(b)
1-2-3-4-=9-4, 1-11O, 1=10O, 2-12N
(c)
C1=CC=C(C=C1)CC(C(=O)O)N
Figure 2.2 A possible ROSDAL and SMILES code for phenylalanine a) a complete ROSDAL, b) a Compressed ROSDAL and c) a SMILES notation.
2.1.3. Connection Tables
between the atoms in a molecule, they are particularly well suited to manipulations involving such topological information as atom by atom searching, graphical structure input and display, Structure property correlation and reaction indexing. There are a large number of standardized file formats based on connection tables such as the MDL’s MOL and SDF formats. For a more detailed understanding of the connection tables and its usage as structure representation medium, the MDL’s CTfile formats specifications [41] can be consulted.
2.2. Molecular Descriptors
Molecular Descriptors are numerical values, generated from a mathematical formula, capable of structural properties generation, necessary for the manipulation and analysis of chemical structural information. These numerical values normally characterize most of the physiochemical and biological properties of the chemicals to a large extent. These descriptors can be divided into almost four types 0-dimensional like the atom counts or bond counts in a molecule, 1-dimensional like fragment counts, 2-dimensional like topological indices, 3-dimensional like the 3-D Morse descriptors, and 4-3-dimensional like the descriptors containing 3-D descriptors along with conformation information. The following paragraph gives some detail about the 2-D and 3-D descriptors which are popular descriptors in clustering, classification and property prediction.
2.2.1. 2-Dimensional Descriptors
2-D Fingerprints
A fingerprint can be defined as a string of bits zero or one, describing the presence or absence of some pre-defined substructure or some other features of a molecule. So, the fingerprints can be divided into two types, one based on predefined dictionaries of structural keys and the other one based on some hashing function of the molecule. In case of structural keys, there is always a pre-defined dictionary of molecular substructures and each substructure in a dictionary corresponds to a particular bit in the bit string. Basically 2-D fingerprints have been developed for structural and sub structural searching and for the development of molecular databases and, latter on, have been used in similarity and cluster analysis. So, the aim is to define a structural key when constructing a dictionary that gives the optimal performance in a typical search. In the beginning, the dictionaries were mostly subjective to the type of databases. For example, the dictionary developed for a database of organic molecules might not be useful for a database of solid state materials. But later on there had been much research for finding the set of substructure (fragments), that are most effective in the development of a generalized dictionary [42, 43] 22], and automated methods for screen selection have been developed [44]. The fragments that have higher discriminating power among molecules are selected for a good dictionary and these are neither the most frequently occurring fragments nor the less frequently occurring fragments, rather these are the equifrequent fragments. The most frequently occurring fragments are discarded and the less frequently occurring fragments are combined together so that their usability is increased.
There are three popular fingerprints dictionary systems namely the CAS ONLINE Screen Dictionary for substructure searching [45], Barnard Chemical Information system [28] and MDL MACCS key system[46].
hashed fingerprint has far more number of patterns for each molecule than a structural key based fingerprint and so is more suitable for large datasets and libraries.
Topological Indices (TIs)
Topological indices are a set of features that characterize the arrangement and composition of the vertices, edges and their interconnections in a molecular bonding topology. These indices are calculated from the matrix information of the molecular structure using some mathematical formula. There are hundreds of molecular descriptors based on the mathematical characterization of molecular structures that play an important role in structure-property and structure-activity relationship, particularly when multivariate regression analysis, artificial neural networks and pattern recognition are used for modeling and analysis. Their advantage over the traditional molecular descriptors, or the descriptors derived from quantum chemical approaches is that they are easily available and can be quickly computed for existing and virtual structures. Among hundreds of possible descriptors, a few have been found useful in characterization of molecular properties and activities, such as the Weiner’s index [47-49], Harary index [50], MTI index [51, 52], Balaban index [53, 54], and Zagreb group of indices [55, 56]. Hue Yuan and Chanzhang Cao [57] have recently developed new topological indices based on the vertex, ring and distance of a molecular graph. They are the vertex degree distance index (VDI), odd even index (OEI), ring degree distance index (RDI) and edge distance index (EDI). Although topological indices are being used successfully for more than half a century, still their interpretation is argued. So, Randic (Randic index) and Zupan had recently started work on the structural interpretation of topological indices [58]. There are a number of works predicting structure activity and structure property relationships utilizing the modeling capabilities of TIs. For instance, TI has been used to predict the heats of formation for 60 hydrocarbons and the result show satisfactory predictions [59]. In [60] a QSAR study was carried out for modeling the DNA modeling affinity with the help of distance matrix based TI.
A few of the topological indices are given below as examples:
∑ J I, DI,J
2 1
∀
I
,
J
=
1
→
n
,
where n is the number of atoms in the molecule.
• The Balaban Index. This is the average distance sum connectivity index. It can be
calculated as below.
∑
×
+
I JD
ID
JC
B
,
1
1
∀
I
,
J
=
1
→
n
,
where n is the number of atoms in the molecule, DI is the sum of elements of the Ith row of
the distance matrix, I and J are neighboring non-hydrogen atoms, B is the number of bonds
and C is the number of rings.
• Schultz Molecular Topological Index. It is an important topological index for its
interesting applications in chemistry and very high discriminating power for benzenoid graphs [61].
As already mentioned, there are a large number of available topological indices but the problem is that most of them suffer from the degeneracy problem. The first topological index, i.e. the Weiner index is considered to be the most degenerate but this trend among the TIs is decreasing with time and new TIs are added to the list, which are more discriminative.
2.2.2. 3-Dimensional Descriptors
computational exhaustive and some researchers use the average 3-D descriptors by computing the descriptor for each possible conformer and then averaging it. Two important 3-D descriptors are the 3-D screens and pharmacophore keys.
3-D Screens
3-D fragment screens like 2-D sreens were also initially designed for 3-D substructure searching, but they can also be used as descriptors as we use 2-D screens in similarity measurement and clustering of chemical compounds, and library design. 3-D screens are also strings of bits but encode the spatial distances, angles etc. between different features of a molecule such as atoms, rings, centroids and planes. The ranges of these distances and angles between a pair of features are divided into a number of bins by fixing a constant bin width. Corresponding to each bin of a distance or angle measure, a bit is specified in the bit sring. If the distance or angle calculated for a pair of feature falls in a particular bin , the corresponding bit is set to 1, but intially all the bits in the screen are zeros. For example a
distance range of 0-20A○ between say two nitrogen atoms can be divided into 10 bins of 2A○
, each covering ranges of 0-2A○ , 2A○-4A○ and so on. Instead of distance between pairs of
atoms, in distance based descriptor calculations triplets and quatets of atoms can also be used.
Potential Pharmacophore Point Descriptors
The pharmacophore fingerprints give a common frame of reference for comparing different ligands and for comparing ligands to protein structures using the complementary potential pharmacophores.
Matter et al [63] has compared the performance of 3-D pharmacophore with 2-d fingerprints for diverse compound selection and have found that pharmacophore triplets performed better when the pharmacophores were derived from lower number of conformers but even then they are not comparable to a 2-D fingerprint based design. In [15] Brown et al have used pharmacophore pair and triplets for the clustering of a number of diverse datasets. They have used a number of clustering methods such as Wards, Group Average etc, but their results do not show any superiority of fingerprints based on 3D pharmacophore.
2.3. Classical Clustering Methods
Clustering is a data analysis technique that , when applied to a heterogeneous set of data items, produces homogeneous subgroups as defined by a given model or measure of dis (similarity) or distance. It is an unsupervised process, i.e. there is no pre defined groupings, the clustering job is to find these undefind and unknown clusters. In supervised learning method, there are some known cluster (groups), from which the algorithms learn the underlying relationship among the inputs and their corresponding outputs and so in this way of learning when the model is developed then it is used for the prediction of target groups for new data elements whose groups are unknown. But in case of unsupervised scheme, there is no input output relation in the beginning, only from the input data the groups are predicted. So, clustering can be thought of as an exploratory data analysis technique, that can be used for the selection of diverse compound subsets and data reduction.
Clustering as a methodology for the partitioning of various types of datasets have been in use in almost all fields of social and technical sciences. Everitt [64] has described a number of clustering works in the fields of psychiatry, medecine, social services, education, archialogy, astronomy , market research etc. There are some other good texts available on traditional clustering methods like Numerical texonomy by Sneath and Sokal [65], and classification by Gordon [66]. In case of chemical information a good text is similarity and clustering in chemical information systems by Peter Willet [13]. Later on in the last 15 years, Peter Willet and his group, Barnard, Brown, and Downs have contributed a lot more to the clustering of chemical datasets.
(1) Select a set of attributes on which to base the comparison of the structures. These may be structural features and/or physicochemical properties.
(2) Characterize every structure in the dataset in terms of the attributes selected in step
one.
(3) Calculate a coefficient of similarity, dissimilarity, or distance between every pair of
structures in the dataset, based on their attributes.
(4) Use a clustering method to group together similar structures based on the coefficients
calculated in step 3.
(5) Analyze the resultant clusters or classification hierarchy to determine which of the
possible sets of clusters should be chosen.
There are a number of methods that can be used for the selection of appropriate attributes or descriptors such as the principal component analysis [67] from a set of available descriptors. Although most of the clustering methods uses Euclidean distance as a measure for similarity or dissimilarity among the objects and the centers, in chemical information systems, the Tonimoto coefficient is more useful especially in similarity searching and hierarchical clustering [68, 69].
The classical clustering methods can be divided into two main classes, heirarchical and non-hierarchical clustering methods. A clustering system will be termed as heirarchical if at every iteration a cluster is divided into two clusters or two clusters are merged together to form one relatively homogeneous cluster(s). We find a parent/ child tree like relationship between the clusters at each successive level. Normally these parent/ child relationship in successive levels is visualized with the help of dendograms. In non heirarchical methods, a single partition is divided into more than two clusters and in each iterative step the compounds can go from one cluster to an other cluster untill the compounds in each cluster are more similar than those in other clusters.
Hierarchic methods are, by far, the most popular types of clustering procedure for the clustering of chemical datasets. The methods were developed primarily for applications in life sciences, where the heirarchic clustering could be compared with traditional biological taxonomies in which specimens are grouped into species, and species are grouped into genra [13].
and then successively each cluster is divided into two clusters again and again untill most feasible clusters are obtained. There are a large set of agglomerative methods like single linkage, complete linkage, Group Average, Centroid, median and wards method.
The divisive methods can further be divided into two more subgroups, monothetic and polythetic. The divisive methods where similarity or dissimilarity is computed among various compounds on the basis of only one attribute are called monothetic divisive methods. Similarly, divisive methods based on more than one attribute are called polythetic divisive methods. According to Clifford and Stepheson [70], monothetic divisive methods have several advantages over agglomerative procedures. First, the definition of groups is simple and unambiguous because of the presence or absence of a single attribute. Second, divisive methods should in theory be superior due to the initial split in the data set on the basis of entire data set where the maximum amount of information about attribute frequencies and co- occurrences are available. In contrast agglomerative methods start with individual pair of objects, and so the final clustering may be dependent upon the characteristics of individual data members. In monothetic divisive methods, the selection of proper attribute has significant effects on the final clusters. The attribute selected should be such that it maximizes the dissimilarity among the final clusters and maximizes the similarity among the members of a cluster [13]. But it is also the limitation of monothetic methods that the whole procedure is based on only one variable. It is possible that an object can be more similar to objects belonging to a different group than to members of its own class based on another attribute [66]. There are a number of monothetic divisive methods like association analysis method, Crawford - Wishart method, Information Analysis Method, and Error Sum Squares method. The list of polythetic divisive methods composes of McNaughton-Smith method, Roux method and Minimum Diameter method.
Here some of the traditional clustering methods are discussed briefly, which have been in use for the clustering of chemical structures.
2.3.1. Single Linkage Algorithm
The single linkage clustering method is the simplest of all hierarchical agglomerative methods, also known as nearest neighbor technique first described by Florek et al [72]. The defining feature of the method is the distance between two clusters defined as the distance between the closest data elements of the two clusters and so the rest of the data elements of the clusters has nothing in the calculation of the inter cluster separation.
2.3.2. Complete Linkage algorithm
The complete linkage clustering methods is also called the furthest neighbor clustering method. It is a hierarchical agglomerative method where the distance between two clusters to be merged is calculated using the distance between the two farthest data elements of the two clusters. It is an exact opposite strategy to that of the single linkage clustering method.
2.3.3. Group Average Algorithm
The group average clustering method is an agglomerative hierarchical method that merges two clusters in a hierarchy if the distance between the two clusters is the minimum among all the clusters. This distance is an average of all the distances of the elements of one cluster to the elements of the other cluster in a pair of clusters.
2.3.4. Centroid Clustering Algorithm
so it will be too close to that of the larger size group and so the characteristics of the smaller group are virtually lost.
2.3.5. Median Clustering Algorithm
The median clustering algorithm was developed to remove the limitations of centroid method. In this method, the mean vector is formed in such away as the median point of a triangle formed by three points, the centroids of the two pair clusters and the centroid of a cluster or group formed by merging the two pairs intended for merging.
2.3.6. Ward’s Clustering Algorithms
The Ward’s clustering method was suggested by Ward in 1963 which is based on the minimization of the information loss associated with the merging of two groups in a hierarchy. According to Ward’s those pairs of cluster should be merged which result in the minimum amount of loss of information. Ward defined the information loss in terms of an error sum of squares criterion given as:
2
1
(
')
n
i
ESS
x x
=
=
∑
−
For I=1 to N-1Do For J=I+1 to N Do
Calculte the distance between cluster I and cluster J.
Search the distance pairs to identify the closest pairs of clusters.
Merge the closest pair and set N=N-1 And REPEAT the Algorithm.
Figure 2.2: A general Hierarchical Algorithm
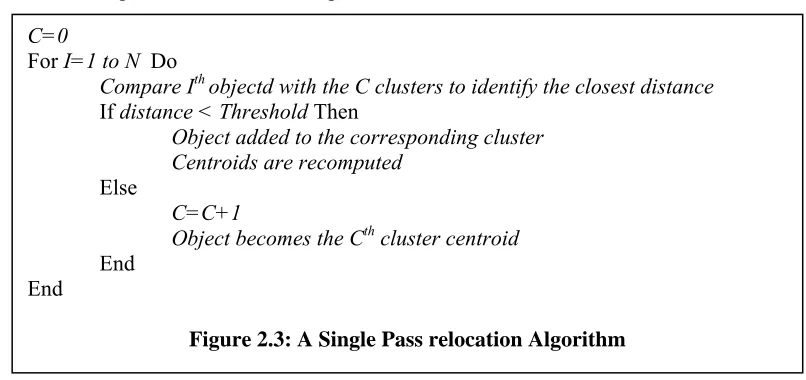
2.3.7. Single Pass Algorithm
Single Pass clustering algorithm is the simplest among the non hierarchical algorithms. The algorithm is based on a user defined threshold. If the distance of a data element from a cluster centre is less than the defined threshold the data element is assigned to the corresponding cluster. The algorithm is outlined in figure 2.3:
Where C represents the number of clusters and N is the total number of objects.
This algorithm is quite fast but is suffered from being totally dependent on the order in which the objects are processed.
C=0
For I=1 to N Do
Compare Ith objectd with the C clusters to identify the closest distance
If distance < Threshold Then
Object added to the corresponding cluster
Centroids are recomputed
Else
C=C+1
Object becomes the Cth cluster centroid
End End
2.3.8. Jarvis Patrick’s Algorithm
Jarvis Patrick’s clustering algorithm [17] is the best nearest neighbor based non hierarchical algorithm. This method is exclusively used for the clustering of chemical compounds. The method has two stages. In the first stage N-1 lists of the top K nearest neighbors for each of the N objects is generated. The nearest neighbors are determined on the basis of Euclidean distance, but in chemical datasets, the Tonimoto similarity is also common. The typical value for K is 16 or 20 [11].
The second stage scans the lists of nearest neighbors to create clusters from the objects that follow the following conditions:
• Object I is in the top K nearest neighbors list of object j. • Object j is in the top K nearest neighbors list of object i.
• I,and j have at least Kmin of their top K nearest neighbors in common, where Kmin
user defined has a range from 1 to K.
According to Downs and Barnard, the commonality among the nearest neighbors is used in Jarvis Patrick like methods as criterion for cluster formation. Since it is more compounds centered so, it is well taken by the researchers and industries working in the area of chemical databases and other relevant fields of chemo informatics.
2.3.9. K-means Algorithm
The K-means algorithm is relocation based non hierarchical clustering algorithm. It minimizes the sum of the squared Euclidean distances between all the members’ objects of a cluster. The basic steps of the algorithm are shown in figure 2.4.
• Select K seed objects randomly to act as initial cluster centroids
• Assign each object to its nearest cluster
• Recalculate the cluster centroids
• Repeat the previous two steps until the change in the centroids is negligible
K-means is considered very efficient as it needs only O(Nmk) time to cluster a dataset of N objects into k clusters in m iterations. Since m and k are usually very small as compared to number of objects, so the time complexity of the algorithm is almost O(N).
2.4. Classification of Chemical Compounds
Classification is another approach to the analysis of multivariate databases. The techniques used range from straightforward statistical classification methods, such as nearest neighbor and linear discriminant classifiers to more sophisticated methods, such as decision trees, neural networks and support vector machines.
The classification approach is a supervised one where some knowledge about the underline datasets such as the number of classes and some examples of each class. Classification systems need to be trained prior to its application to an unknown dataset for mining the desired classes for which the classifier is trained. For example, if a number of Angiotensine Converting Enzyme (ACE) Inhibitors are available, a classifier can be trained by them and then the classifier can be used to extract other ACE inhibitors present in an unknown dataset. The performance of the classifier highly depends on the training set.
Chapter 3
Neural Networks and Compound
Clustering
With the advent of neural networks almost every field of science and technology have undergone revolutionary changes. Neural networks had been applied to various problems of control, system identification, image processing, pattern recognition, and data analysis. The neural network theory has been motivated by the learning abilities of the human brain which is a very complex system capable of thinking, remembering, and problem solving. There have been many attempts to emulate the human brain functions with computer models, and although there have been some rather spectacular achievements coming from these efforts, all of the models developed to date pale into oblivion when compared the complex functioning of the brain. Thus a neural network is a data processing system consisting of a large number of simple, highly interconnected processing elements (artificial neurons) in an architecture inspired by the structure of the cerebral cortex of the brain [77].
The neural networks come in two flavors, the supervised and unsupervised. It is the unsupervised learning neural networks that can be used for clustering purposes where no information is available a priori about the groups or clusters in the dataset.
Classification is the process where the system first learns from the available a priori knowledge about the underlying dataset or process that need to be learned and then identify similar knowledge from the unknown source.
In the last one or two decade neural networks had been employed for clustering and classification problems. The ANNS have a number of important features [5] like:
1
ANNs process numerical vectors and so require patterns to be represented usingquantitative features only.
2
ANNs are inherently parallel and distributed processing architectures.3
ANNs may learn their interconnection weights adaptively. More specifically, theycan act as pattern formalizers and feature selectors by appropriate selection of weights.
The neural networks used in clustering problems are also called the competitive learning networks as in such networks the output class information of a given data sample is not required. In competitive learning, similar patterns are grouped by the network and represented by a single unit (neuron). This grouping is done automatically based on data correlations. Well-known examples of ANNs used for clustering include Kohonen’s learning vector quantization (LVQ) and self-organizing map (SOM) [79], and adaptive resonance theory models [80]. The architectures of these ANNs are simple: they are single- layered. Patterns are presented at the input and are associated with the output nodes. The weights between the input nodes and the output nodes are iteratively changed (this is called learning) until a termination criterion is satisfied. Competitive learning has been found to exist in biological neural networks. However, the learning or weight update procedures are quite similar to those in some classical clustering approaches like hierarchical and k-means methods.
The ANNs used for classification can have more than two layers of neurons and most of the time are fully connected. The large number of connections enables them to learn any kind of linear or non linear processes. These networks are based on procedural learning, where the output for a given input pattern is compared with desired output and based on the error obtained the weights of each and every neuron and layer are updated in successive iteration until the error becomes negligibly small.
3.1. Unsupervised Neural Networks
3.1.1. Kohonen Neural Network
The Kohonen self organizing neural network is an unsupervised, competitive learning network, where the neurons participate in a competition among themselves for learning [81]. The output layer neuron forms a 2D or 3D map that describes the groupings in the dataset. This network basically implements a non-linear projections from a high dimensional space to a low dimensional feature map that shows a shadow of the hidden classes in the dataset on a two dimensional mirror. This type of network imposes a neighborhood constraint on the output units, such that a certain topological property in the input data can be preserved in the weights of the output neurons. During the training the weights of the winning neuron as well as the neurons in its neighborhood are updated and are brought closer to the input patterns. The learning procedure of Kohonen feature maps is similar to that of competitive learning networks. That is, a similarity (or dissimilarity) measure is selected and the winning unit is considered to be the one with largest (or smallest) activation. However, for Kohonen feature map, we not only update the weights of the winning neuron but also all the weights of all the neurons in the neighborhood of the winning neuron. The training process for Kohnen self-organizing map can be described in the following two steps:
Step 1: When an input Zkis presented to the input layer, the output winning neuron is selected
as the one with largest similarity measure (or smallest dissimilarity measure) between all weight vector Wi and the input. If Euclidean distance is used as dissimilarity measure then the
distance of the winning neuron will be the smallest from the input pattern. This is shown in equation 3.1.
i k i c
k W Z W
Z − = min − 3.1
Where the index c represents the winning neuron.
Step 2: If Nc denotes the set of neurons in the neighborhood of winner neuron, then the
weights of the winner and its neighboring neurons are updated as follows:
c i
k i
i t W t t Z t W t i N
W( +1)= ( )+
η
( )( ( )− ( )) ∈ 3.2The neurons which are loser and of course not member of the set Nc are not updated. Here η is
the learning rate parameter and varies with time. The neighborhood set Nc can be defined by a
⎟ ⎟ ⎠ ⎞ ⎜ ⎜ ⎝ ⎛− − = Ω 2 2 2 exp ) (
σ
c ic i p p 3.3
where pi and pc are the positions of the output neurons i and c, respectively, and σ reflects the
scope of the neighborhood. By using the neighborhood function the update formula becomes:
c i
k c i
i t W t i Z t W t i N
W( +1)= ( )+
η
Ω( )( ( )− ( )) ∈ 3.4Initially the value of learning parameter η and size of neighborhood Ω are kept large and as the learning progresses, these are gradually decreased.
3.1.2. Neural Gas Network
The neural gas algorithm is an important neural network, first introduced by Martinez [82] for the prediction of time series and then applied successfully to the clustering of various databases [83], vector quantization [84], pattern recognition [85, 86], and topology representation [87] etc.
According to Martinez [82] the neural gas algorithm has a number of advantages like, 1- converges quickly to low distortion errors, 2- reaches a distortion error lower than that resulting from k-means clustering and maximum entropy clustering (for practically feasible number of iterations), and from Kohonen feature map and 3- at the same time obeys a gradient descent on an energy surface (like the maximum entropy clustering, in contrast to Kohonen’s feature map).
The neural gas algorithm generates a list of the ranks of weight vectors Wk corresponding to
each input pattern Zk which gives the weights a descending order based on the closeness to the
input pattern with Wk0 being the closest weight vector to the input pattern,Wk1as the second
close weight vector and Wki , i = 1,2, …, c-1 being the weight vector for which there are i
vectors Wj with Zk−Wj < Zk−Wki . If the ranking index number k associated with each
vector Wk is denoted by R(Zk, Wki), which depends on Zk and the whole set Wki = (Wk0,Wk1,…, Wkc-1) of weight vectors, then the adaptation step we employ for updating the Wk ‘s is given by
[
( ) ( )]
)) , ( ( ) ( ) ( ) 1(t W t t h R Z W Z t W t
Wki + = ki −
η
λ k ki k − ki 3.5The learning rate parameter
η
(t)∈[ ]
0,1 describes the overall extent of modification andusually is taken as an exponentially decreasing function of time
on Maxiterati t
t
)
(
/
)
/(
η
η
η
Where ηi and ηf are the initial and final values of the learning rate, respectively, which are
initialized in advance. The Maxiteration is also a constant specifies the number of maximum t
steps, also initialized at the start of the algorithm.
As already stated the ranking index R(Zk, Wki) which depend on the input patternZk and the
whole set of the weight vectors Wki = (Wk0,Wk1, …, Wkc-1) of weight vectors which also serve
as the prototypes of the dataset Z. The value of R(Zk, Wki) is zero for the closest weight vector
and is the maximum for the farthest weight vector. The ranking adaptation parameter hλ(t) is a
function of the ranking index R and lies between 0 and 1. Martinez [82] has suggested an
exponential decreasing function
)
/
exp(
)
(
λ
λ
R
R
h
=
−
3.7the value of hλ(t) thus depends on the rank of the weight vector, as the rank increases the the
updation rate decreases and vice versa. For λ=0 the update formula of equation 3.5 becomes
that of the simple competitive neural network where only the winner is updated and the rest of the weights remain unchanged.
According to Martinez [82], NG algorithm is closely related to the framework of fuzzy clustering methods [88]. All the fuzzy methods like fuzzy c-mean and Gustafson and Kessel
algorithm [89] uses the fuzzy membership functions
µ
ij,
2
≤
i
≤
c
,
1
≤
j
≤
n
whichallows the data elements to partially belong to more than one cluster. Instead of fuzzy membership value, the NG algorithm utilizes the uncertainty of belongingness value
hλ(R)/C(λ) to assign each input Zk to all of the prototype vectors Wki, i=1,2, …, c.
Like other partitioning algorithms of clustering, the neural gas algorithm also derives from a criterion function, the minimization of which by a stochastic gradient descent method results in the above updating equation 3.5 which gives the absolute minimum value for the cost function. The cost function for NG algorithm is as follows:
∑∑
= =−
=
c i nk k i k i
NG
C
h
R
Z
W
Z
W
E
1 1 2))
,
(
(
)
(
2
/
1
λ
λ 3.8with
∑
=
=
c i i kW
Z
R
h
C
1))
,
(
(
)
(
λ
λIn order to obtain good results that minimize the energy function ENG to its absolute
3.1.3 Enhanced Neural Gas (ENG) Algorithm
The neural gas (NG) algorithm as described in the previous section has a number of advantages like faster convergence to low distortion errors, lower distortion errors than k-means, maximum entropy and kohonen’s self organizing maps yet the updating formula is highly fragile in an environment having noise and large number of outliers and is also sensitive to the order of input vectors [90].
c i W Z W Z W Z W Z R h t W i k i k i k i k
i , 1,2,...,
) ( . )). , ( ( ) ( = − − − =
∆
η
λ 3.9It is obvious from neural gas updating formula (equation 3.9), if an outlier Z0 is presented to
update all the prototypes, the amplitude Z0−Wi generated along the unit direction
i k i k W Z W Z − − ) (
will be considerably large such that the prototypes will be dragged towards the
outliers. Moreover, if the outliers are highly scattered around the dataset, the training process will not be smooth and there will be lot of oscillation. To overcome these problems Qin et al [60] suggested the following rule which is called the enhanced neural gas:
c
i
W
Z
W
Z
iter
d
W
Z
W
Z
R
h
t
W
i k i k i m i i k i ki
,
1
,
2
,...,
)
(
).
(
).
)
0
(
exp(
)).
,
(
(
)
(
=
−
−
−
−
=
∆
σ
β
η
λ 3.10
Compared with equation 3.9, this formula also does obey the stochastic gradient descent rule and heuristically adjust the amplitude σi(iter) of the gradient descent. The gradient descent
amplitude σi(iter) is given as:
)
1
(
)
1
(
)
(
)
(
)
(
−
<
−
−
≥
−
⎪⎩
⎪
⎨
⎧
−
=
=
t
d
W
Z
t
d
W
Z
if
if
W
Z
t
d
t
iter
i m iter i t m i m iter i t m iter i t m i m m i iσ
σ
3.11with
[
]
{
}
[
]
( 1)) 1 ( ) 1 ( 2 / 1 / 1 ) 1 ( / 1 2 / 1 ) ( 1 − < − − ≥ − ⎪⎩ ⎪ ⎨ ⎧ − + − − + − = − t d W Z t d W Z if if W Z t d W Z t d t d i m iter i t m i m iter i t m iter i t m i m iter i t m i m m i 3.1 2 and 1 1
1
1
)
0
(
− =⎥
⎥
⎦
⎤
⎢
⎢
⎣
⎡
−
=
∑
Nj j imN m i