ISSN(Online): 2320-9801
ISSN (Print) : 2320-9798
I
nternational
J
ournal of
I
nnovative
R
esearch in
C
omputer
and
C
ommunication
E
ngineering
(A High Impact Factor, Monthly, Peer Reviewed Journal)
Website: www.ijircce.com
Vol. 6, Issue 8, August 2018
Analysis of Software Quality Models for
Volkswagen
Shivani Thakare, Trupti Salvi, Vishakha Singh
Symbiosis Institute of Computer, Studies and Research Pune, India
ABSTRACT: Volkswagen AG known internationally as Volkswagen Group is a German multinational automotive
manufacturing company headquartered in Wolfsburg Germany. It designs, manufactures and distributes passenger and commercial vehicles, motorcycles, engines, and turbo machinery and offers related services including financing, leasing and fleet management. Volkswagen Group sells passenger cars under the Audi, Bentley, Bugatti, Lamborghini, Porsche, SEAT, Skoda and Volkswagen marques; motorcycles under the Ducati brand; and commercial vehicles under the marques MAN, Scania, and Volkswagen Commercial Vehicles. On 18 September 2015, The US EPA announced that Volkswagen had installed a "defeat device" software code in the diesel models sold in the US from 2009-15. The code was intended to detect when an emissions test was being conducted, and altered emissions controls for better compliance. Off the test stand, the controls were relaxed, and emissions jumped 35 to 40 times regulatory levels according to investigators at West Virginia University and the California Air Resources Board. 482,000 vehicles are under the recall order, a potential $18 billion ($37,500 per violation) in fines are pending, and news accounts speculate a criminal indictment for the deception is certain. The software code was only revealed when the EPA refused to certify VW's 2016 models for sale in the US unless the corporation provided full disclosure. On Sunday, 20 September 2015, VW Group announced it was halting the sale of its fourcylinder diesel models in the US. On 22 September 2015, VW AG admitted that 11 million cars worldwide had been fitted with software intended to deceive emissions testing. The company issued a profit warning, saying it had set aside 7.3 billion dollars to fix the fraud. On April 21, 2017, a US federal judge ordered Volkswagen "to pay a $2.8 billion criminal fine for rigging diesel-powered vehicles to cheat on government emissions tests."
KEYWORDS: Method, materials, Measurement, Machine, power, People, Management.
I. INTRODUCTION
Over the last month, the German automaker, Volkswagen, has been in the hot seat for installing software that covered up diesel emissions during testing by the EPA. As is often the case, the situation came to a head with the obligatory congressional hearing last week when the company’s Group America President and CEO, Michael Horn, faced questions and criticism from the House Energy and Commerce Subcommittee on Oversight and Investigations. In that testimony, Horn was apologetic, but said he was not aware that the software had been installed. The New York Times was quick to write in an editorial that it is hard to believe this was not a corporate decision rather than the work of “a couple of software engineers.” They went on to suggest that VW needs to come clean now and quickly.
To begin with there are some common objectives:
1. To analysis various software quality models w.r.t various attributes. 2. The presence, or absence, of these attributes can be measured objectively.
3. The degree to which each of these attributes is present reflects the overall quality of the software product. 4. These attributes facilitate continuous improvement, allowing cause and effect analysis which maps to these
attributes, or measure of the attribute.
Toyota went on selling cars successfully despite dealing with legal and regulatory issues. VW will also survive and continue to sell cars. Second, it is useless to spend time trying to figure out who knew what and when. Instead, investigators should be studying the culture that lead to this crisis and the company, like Mitsui, needs to find a leader who can move this great organization beyond this incident. But make no mistake; it will take time, which is something that regulators, the media, or shareholders are going to be happy about. Third, VW needs to focus on both the short-term issue of compromised emissions tests as well as the long-short-term issue of a culture so focused on success and performance that it forgot to remind employees not to do anything they wouldn’t want to read about online the next day. So how can they do that?
1. Realize that radical changes are more difficult in companies with a strong culture and focus on the long-term cultural changes necessary to avoid scandals like this one in the future.
2. Make sure that the strategy of the company aligns with its values and vision.
3. Explicitly state intolerance for wrongdoing and repeatedly suggest that nothing is worth losing your reputation over.
4. Measure and monitor reputational risk in the same way that the company looks at operational and financial risk. 5. Make sure that senior management does not get so caught up managing the crisis that they forget to run the
company for the future.
II. SEVEN QUALITY TOOLS
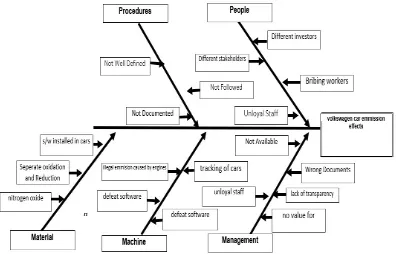
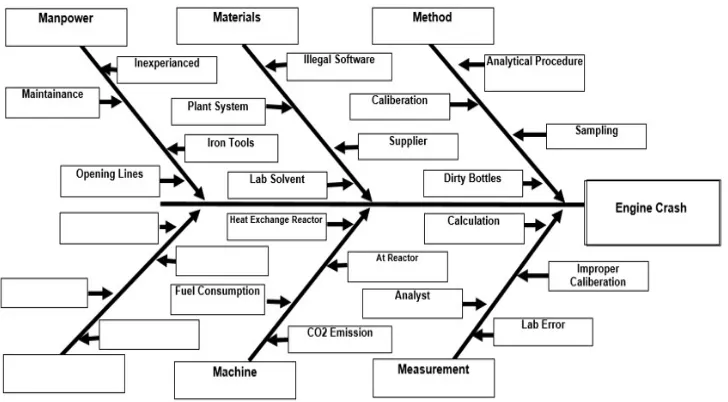
a) Fishbone
A fishbone diagram, also called a cause and effect diagram or Ishikawa diagram, is a visualization tool for categorizing the potential causes of a problem in order to identify its root causes. Here, the effects for the causes are:
1. Volkswagen car emission.
2. Engine crash.
ISSN(Online): 2320-9801
ISSN (Print) : 2320-9798
I
nternational
J
ournal of
I
nnovative
R
esearch in
C
omputer
and
C
ommunication
E
ngineering
(A High Impact Factor, Monthly, Peer Reviewed Journal)
Website: www.ijircce.com
Vol. 6, Issue 8, August 2018
Fig. 2.Fishbone diagram for car emission effects and engine crash
III. HISTOGRAM
The histogram of an image represents the relative frequency of occurrence of the various gray levels in the image. The histogram modelling techniques modify an image globally so that its histogram has a desired shape.
Here, in the below given Histogram, we can conclude that the sales in the month of June and July were the highest.
Fig 2. Histogram analysis
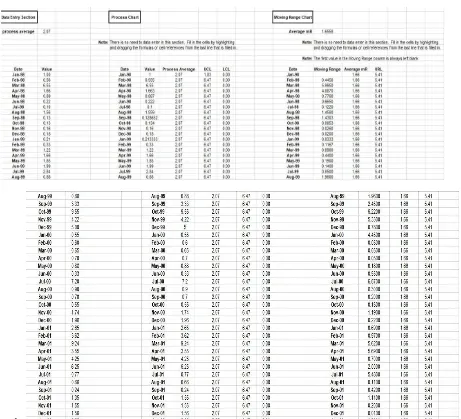
IV. CONTROL CHART
Control charts, also known as Shewhart charts (after Walter A. Shewhart) or process-behavior charts, are a statistical process control tool used to determine if a manufacturing or business process is in a state of control. From the Control Chart given below, we can observe the values according to the dates.
Control c
ISSN(Online): 2320-9801
ISSN (Print) : 2320-9798
I
nternational
J
ournal of
I
nnovative
R
esearch in
C
omputer
and
C
ommunication
E
ngineering
(A High Impact Factor, Monthly, Peer Reviewed Journal)
Website: www.ijircce.com
Vol. 6, Issue 8, August 2018
Fig 3 control chart realization to graph
V. SCATTER CHART
A scatter plot (also called a scatterplot, scatter graph, scatter chart, scatter gram, or scatter diagram) is a type ofplot or mathematical diagram using Cartesian coordinates to display values for typically two variables for a set of data. If the points are color-coded, one additional variable can be displayed.
Fig 4 scatter chart table and scatter chart graph
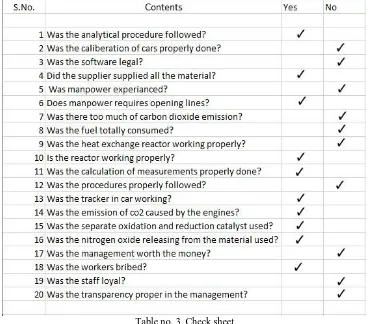
VI. CHECKLIST
A checklist is a catalog of items/tasks that are recorded for tracking. This list could be either ordered in a sequence or could be haphazard. From the below checklist, we can conclude if the contents are checked or not.
ISSN(Online): 2320-9801
ISSN (Print) : 2320-9798
I
nternational
J
ournal of
I
nnovative
R
esearch in
C
omputer
and
C
ommunication
E
ngineering
(A High Impact Factor, Monthly, Peer Reviewed Journal)
Website: www.ijircce.com
Vol. 6, Issue 8, August 2018
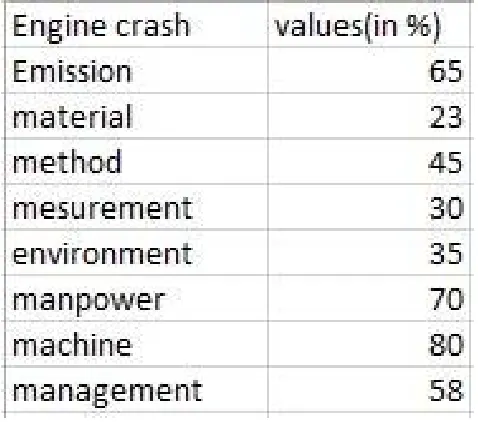
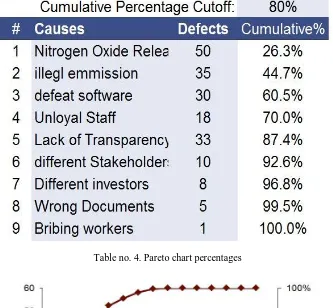
VII. PARETO CHART
A Pareto chart, named after Vilfredo Pareto, is a type of chart that contains both bars and a line graph, where
individual values are represented in descending order by bars, and the cumulative total is represented by the line.
Table no. 4. Pareto chart percentages
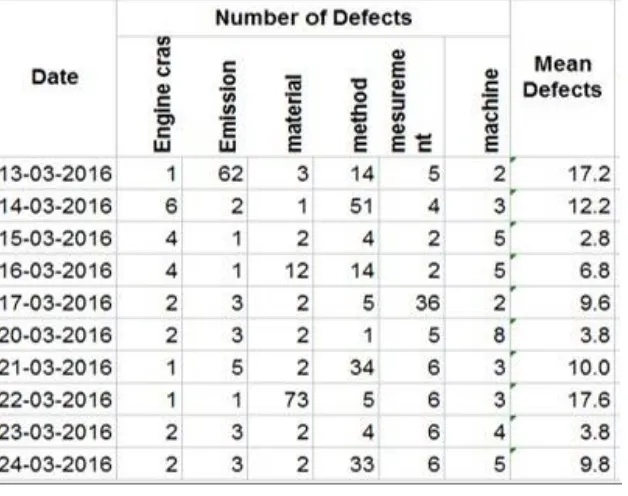
VII. RUN CHART
A run chart is a line graph of data plotted over time. By collecting and charting data over time, you can find trends
or patterns in the process. Because they do not use control limits, run charts cannot tell you if a process is stable.
However, they can show you how the process is running.
The Run chart below gives details of defects on weekly basis.
Table no. 5. Pareto Chart details
ISSN(Online): 2320-9801
ISSN (Print) : 2320-9798
I
nternational
J
ournal of
I
nnovative
R
esearch in
C
omputer
and
C
ommunication
E
ngineering
(A High Impact Factor, Monthly, Peer Reviewed Journal)
Website: www.ijircce.com
Vol. 6, Issue 8, August 2018
VIII. 5 WHY’S?
1. Why? - Volkswagen recalled 482000 vehicles 2. Why? - They installed “defeat device” software code 3. Why? - To alter emission control
4. Why? - To show less CO2 emission in the test result 5. Why? - To satisfy regulatory levels
IX. POKA YOKE
A poka-yoke is any mechanism in a lean manufacturing process that helps an equipment operator avoid (yokeru) mistakes (poka). Its purpose is to eliminate product defects by preventing, correcting, or drawing attention to human errors as they occur. It’s a quality assurance process introduced by Japanese engineer Shigeo Shingo. This term is used in the Japanese language as “Poka” meaning mistake and “Yoke” meaning prevent i.e. mistake preventing or mistake proofing technique. The purpose of Poka-Yoke is to develop processes to reduce defects by avoiding or correcting (design to show alerts or warning messages to the user) mistakes in early design and development phases. This technique is mostly used in manufacturing industries but now this effective technique is also adapted to software development processes as well.
There are several reasons for engine crash:
1. Manpower: The staff was inexperienced, did not had proper iron tools, maintenance and not capable enough to do things correctly and appropriate. Inexperienced business analysts who aren't doing the job effectively and are wondering how to get the most out of them.
2. Materials: Illegal use of software, plant system, buying fake materials from suppliers and duplicate lab solvent can be prevented by using the original materials and checking the materials while purchasing it from suppliers. The materials must be purchased under warranty and guarantee to prevent them from getting damaged and illegal use.
3. Method: Calibration, analytical procedure, dirty bottles and sampling are few methods where engine is checked but were not checked properly and the problems like engine crash happened. Proper focus on calibration, procedures, sampling can help reduce the Crash.
4. Measurement: calculations, improper calibration, analysis and lab errors data and their numbers are updated incorrectly and can be prevented by checking up the facts and figures properly. At the time of updating the data in records there must be a checking system for the digits or alphabets entering in it. There should be a fix alpha-numeric pattern for entering the data.
Machine: heat exchange reactor was causing lot of heat in the engine which could be prevented by the heat reactor in proper working conditions. Coolant reservoir tank can be added to prevent the heat generated in the car.CO2 emission
in the engine must be prevented. The reasons for car emission were due to: 1) Procedure
2) People 3) Material 4) Machine 5) Management
It could have been avoided by the following the below mentioned: 1) Procedure:
The set of rules should have been well defined so that there would not have been any illegal manufacturing of the car.
The document was not well defined. They could have used a set of rules or standards which could have been followed.
2) People:
Many stakeholders and investors were involved in this scam, hence it wasn’t easy to point out one person and stop the illegal manufacturing to happen.
3) Material:
Illegal software had been implanted in the cars which lead to the issue.
The implantation should have been avoided in order for better processing or better going of the system. Due to the same, Nitrogen Oxide was released which were causing health related problems. This could have been avoided only if the illegal software installation was not done.
X. TAKT TIME
Takt time is the average time between the start of production of one unit and the start of production of the next unit,
when these production starts are set to match the rate of customer demand.
For example, if a customer wants 10 units per week, then, given a 40-hour work week and steady flow through the production line, the average time between production starts should be 4 hours (actually less than that in order to account for things like machine downtime and scheduled paid employee breaks), yielding 10 units produced per week. Note, a common misconception is that takt time is related to the time it takes to actually make the product. In fact, takt time simply reflects the rate of production needed to match the demand. In the previous example, whether it takes 4 minutes or 4 years to produce the product, the takt time is based on customer demand. If a process or production lines are unable to produce at takt time, either demand leveling, additional resources, or process re-engineering is needed to correct the issue. Volkswagen car manufacturer produces 1500 car engine in 4 hour sprint, 8 hours shift. Considering 500 workers in the plant. The takt time for the production of the car engine in one day is:
Takttime = 8
1500∗500∗4
=1/37500 hours = 3 engines / worker (approximately)
Conclusion: The takt time for car production is 3 engines per worker per day approximately.
XI. RECOMMENDATIONS
ISSN(Online): 2320-9801
ISSN (Print) : 2320-9798
I
nternational
J
ournal of
I
nnovative
R
esearch in
C
omputer
and
C
ommunication
E
ngineering
(A High Impact Factor, Monthly, Peer Reviewed Journal)
Website: www.ijircce.com
Vol. 6, Issue 8, August 2018
XII. CONCLUSION
In accordance with findings and analysis under previous sections, Volkswagen deceptive scandal is an overwhelming complicated case having created dramatic hassles for its direct and indirect stakeholders. Albeit Volkswagen cheating in diesel emission test was an unethical action resulting in series of disastrous consequences, the proposal of green punishment is a suitable solution to finalize this case. Electronic cars enable environment protection agencies to save cost and time for finding out new systems for controlling emission tests. Moreover, in this way, Volkswagen is not only penalized but also compensates its scandal appropriately. In conclusion, since this is an ongoing case, there is a chance to lodge the proposal of green punishment to judge to solve the issue in a win-win method.
REFERENCES
[1] http://www.bbc.com/news/business-34324772
[2] https://blog.caranddriver.com/everything-you-need-to-know-about-the-vw-dieselemissions-scandal/
[3] https://www.theguardian.com/business/2015/dec/10/volkswagen-emissions-scandalsystematic-failures-hans-dieter-potsch
[4] https://www.managementtoday.co.uk/caused-volkswagens-emissionsscandal/article/1394371
[5] https://www.nytimes.com/interactive/2017/business/volkswagen-diesel-emissionstimeline.html