University of Windsor University of Windsor
Scholarship at UWindsor
Scholarship at UWindsor
Electronic Theses and Dissertations Theses, Dissertations, and Major Papers
8-3-2017
Physiological Responses to Increasing Battling Rope Weight
Physiological Responses to Increasing Battling Rope Weight
During two 3 Week High Intensity Interval Training Programs
During two 3 Week High Intensity Interval Training Programs
Derek Bornath University of Windsor
Follow this and additional works at: https://scholar.uwindsor.ca/etd
Recommended Citation Recommended Citation
Bornath, Derek, "Physiological Responses to Increasing Battling Rope Weight During two 3 Week High Intensity Interval Training Programs" (2017). Electronic Theses and Dissertations. 6597.
https://scholar.uwindsor.ca/etd/6597
This online database contains the full-text of PhD dissertations and Masters’ theses of University of Windsor students from 1954 forward. These documents are made available for personal study and research purposes only, in accordance with the Canadian Copyright Act and the Creative Commons license—CC BY-NC-ND (Attribution, Non-Commercial, No Derivative Works). Under this license, works must always be attributed to the copyright holder (original author), cannot be used for any commercial purposes, and may not be altered. Any other use would require the permission of the copyright holder. Students may inquire about withdrawing their dissertation and/or thesis from this database. For additional inquiries, please contact the repository administrator via email
Physiological Responses to Increasing Battling Rope Weight
During two 3 Week High Intensity Interval Training Programs
By
Derek Bornath
A Thesis
Submitted to the Faculty of Graduate Studies
Through the Department of Kinesiology
in Partial Fulfillment of the Requirements for
the Degree of Master of Human Kinetics at the
University of Windsor
Windsor, Ontario, Canada
2017
Physiological Responses to Increasing Battling Rope Weight
During two 3 Week High Intensity Interval Training Programs
By
Derek Bornath
APPROVED BY:
____________________________________
R. Carriveau
Department of Civil and Environmental Engineering
___________________________________
K.J. Milne
Department of Kinesiology
___________________________________
K.A. Kenno, Advisor
Department of Kinesiology
iii
DECLARATION OF ORIGINALITY
I hereby certify that I am the sole author of this thesis and that no part of this thesis has
been published or submitted for publication.
I certify that, to the best of my knowledge, my thesis does not infringe upon anyone’s
copyright nor violate any proprietary rights and that any ideas, techniques, quotations, or any
other material from the work of other people included in my thesis, published or otherwise, are
fully acknowledged in accordance with the standard referencing practices. Furthermore, to the
extent that I have included copyrighted material that surpasses the bounds of fair dealing within
the meaning of the Canada Copyright Act, I certify that I have obtained a written permission
from the copyright owner(s) to include such material(s) in my thesis and have included copies of
such copyright clearances to my appendix.
I declare that this is a true copy of my thesis, including any final revisions, as approved
by my thesis committee and the Graduate Studies office, and that this thesis has not been
iv
ABSTRACT
The purpose of this study was to determine the effect of increasing battling rope (BR)
weight during 6 weeks of BR high intensity interval training (HIIT) on upper body oxygen
consumption and skeletal muscle strength, endurance and power performance.
Eighteen recreationally active men and 15 women (23±2y) performed ten, 30 sec bouts of
all-out exercise separated by 60 secs of rest, 3x/week, for 6 weeks. Males and females exercised
at a minimum of 85% of their predicted maximum heart rate, with post exercise blood lactates
peaking at 10.79 mmol/L and 8.33 mmol/L, respectively, alternating between the double whip
and alternating whip exercises. For the first 3 weeks, women used 40 foot, 1.5 inch, 20 lb ropes,
and men used 50 foot, 1.5 inch, 25 lb ropes, after which the BR weight was increased by 10 lb
for a second 3 week period of BR HIIT. After 3 weeks and 6 weeks of BR HIIT, males and
females increased maximum isometric shoulder flexion and extension, shoulder power output,
push-ups, sit-ups, and maximal oxygen consumption. These increases in aerobic and skeletal
muscle measurements are similar to previous HIIT studies involving treadmills, cycle
ergometers, and stair climbing. Battling rope HIIT produced adaptions in skeletal muscle and
aerobic performance in as little as 3 weeks, and with increases in BR weight displaying further
improvements after 6 weeks of BR HIIT. These data support the implementation of progressive
v
ACKNOWLEDGEMENTS
I would like to express my gratitude to my advisory committee, Dr. Rupp Carriveau, Dr.
Kevin Milne, and my direct advisor Dr. Kenji Kenno for all their assistance throughout my thesis
and graduate school experience. I would like to thank Don Clarke for his help in setting up the
lab, and fixing any problems that I managed to create throughout the duration of my study. I
would also like to thank Dr. Jenn Voth for her assistance with my statistics. Without her help, I
would surely be lost, and would not have completed my thesis in a timely manner.
As well, this study would not have been possible without the extensive support shown by
my 36 subjects and the Kinesiology student volunteer who helped make the data collection
process efficient and effective. Without their participation, I would not have been able to
complete my thesis, and I cannot extend enough appreciation for their help.
I would also like to thank my roommates, my friends, and my family for their on-going
support throughout the two years of my Masters degree, and for making these last two years as
vi
TABLE OF CONTENTS
DECLARATION OF ORIGINALITY ... iii
ABSTRACT ... iv
ACKNOWLEDGEMENTS ... v
LIST OF FIGURES ... viii
LIST OF TABLES ... xi
ABBREVIATIONS ... xii
INTRODUCTION ... 1
METHODS ... 9
Session 1- Documentation and Familiarization session ... 9
Session 2: Baseline Testing Session ... 11
Battling Ropes HIIT Sessions ... 21
Participant Confidentiality ... 25
Sample Size ... 25
Statistics ... 25
RESULTS ... 27
Descriptive Statistics ... 27
Battling Rope Specific Physiological Performance ... 27
Battling Rope HIIT RPE Response ... 27
Battling Rope HIIT Heart Rate Responses ... 28
Battling Rope HIIT Blood Lactate Response ... 30
Skeletal Muscle Endurance ... 32
Push-ups... 32
Sit-ups ... 33
Skeletal Muscle Strength ... 34
Shoulder Flexion MVIC ... 34
Shoulder Extension MVIC ... 35
Skeletal Muscle Power ... 36
Medicine Ball Slam Peak Force ... 36
Blood Lactate Concentrations ... 37
vii
VO2 Maximum ... 40
DISCUSSION ... 41
LIMITATIONS AND IMPLICATIONS ... 47
REFERENCES ... 48
APPENDIX A ... 55
APPENDIX B ... 56
APPENDIX C ... 57
APPENDIX D ... 61
APPENDIX E ... 65
APPENDIX F... 69
APPENDIX G ... 70
APPENDIX H ... 71
APPENDIX I ... 72
viii
LIST OF FIGURES
Figure 1: Double whip motion. The starting position of the double whip exercise (with the ropes in a downward position) followed by the participant whipping the rope up, and then downward back to the final position, representing one complete cycle. ... 3
Figure 2: Alternating whip motion. Participants create battling rope motion with arms and shoulders alternating in movement. This shows both the starting and finishing point at which one full cycle is completed. ... 3
Figure 3: A is the Polar Heart Rate Monitor (Model E40) watch and the corresponding chest strap. B is the proper placement of the Polar Heart Rate Monitor chest strap. The chest strap should rest below the nipples and be centered just below the sternum. ... 12
Figure 4: A is the Lactate Scout Analyzer (1) and Medlance 1.8 mm, 21G Autolancet (2) which was used for obtaining a single blood droplet and analyzing it for lactic acid concentrations. B is the participant’s ear being cleaned with an alcohol swab while the investigator was wearing protective gloves and safety glasses, before obtaining a blood droplet. C is the use of the Medlance Autolancet which was held against the earlobe and pressed until it clicks and then disposed of into the sharps container (only simulated in this photo). D is the Lactate Scout testing strip touched to the droplet of blood on the earlobe. Once the droplet touches the strip adequately and a reading is given by the Lactate Scout, the testing strip will be disposed of into the sharps container. E is the earlobe being cleaned with a different alcohol whip post sample. The Medlance Autolancet lactate testing strip and alcohol wipe were disposed of into the sharps container which is seen in F. All areas used were disinfected post-test, with the liquid
disinfectant found in the lab. ... 13
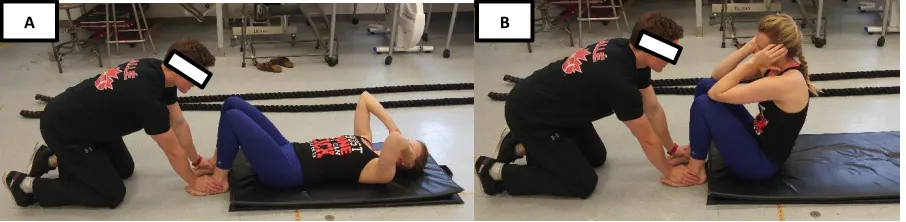
Figure 5: A shows shoulder positioning at 90 degrees for the shoulder flexion maximum
voluntary isometric contraction (MVIC) test, with each participant pulling downward 3 separate times, for 3 secs, with 30 secs of rest in between each attempt B depicts the same shoulder positioning but for the extension MVIC test with participants pulling upward 3 separate times, for 3 secs, with 30 secs of rest in between each attempt. As seen above, participants maintained a flat back throughout both testing procedures, with a padded belt across their hips and torso to prevent lower body and trunk muscle activity. ... 15
ix
participant has slammed the medicine ball into the force platform. There were 3-5 practice slams allotted, followed by 3 recorded slams. ... 16
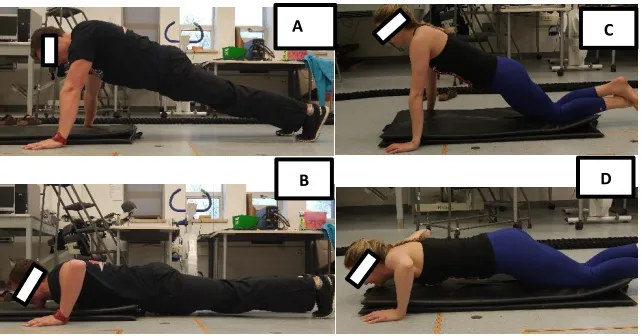
Figure 7: A was the male starting (upward) position from the toes for the ACSM Push-up Test while B was the male lower finishing position for the ACSM Push-up Test. C was the female starting (upward) position from the knees for the ASCM Push-up Test. D was the female lower finishing position for the female ACSM Push-up Test. ... 17
Figure 8: A was the starting positioning for the YMCA Bent-Knee Sit-Up Test. B was the end positioning for the YMCA Bent-Knee Sit-Up Test. Once the elbows touch the knees, the
participant returned to the starting position (the shoulder blades return to the mat) to complete one full repetition. ... 18
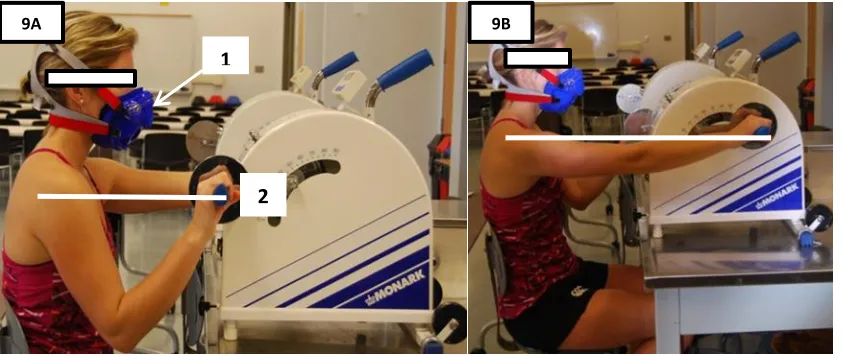
Figure 9: A illustrates the starting position of the Astrand Arm Ergometer Protocol (Appendix F). The head of the humerus was set parallel to the axis of the arm ergometer pedal axis. B displays the second half of a full rotation of the Arm Ergometer. The seat was set to allow adequate arm extension during the pedalling motion. 1 is the Hans Rudolph VO2 max mask with
head straps for positioning and 2 is the Monark Arm Ergometer set shoulder height. ... 20
Figure 10: Gymboss Interval Timer was pre-set to indicate the beginning and end of every work and rest period with a “beep”. ... 23
Figure 11: Number of push-ups to volitional fatigue completed by males and females following 3 and 6 weeks of BR HIIT. Males n=18, Females n=15. Values are means ± SD, a p<0.05, 0 vs 3
wks; b p<0.05, 3 vs 6 wks; c p<0.05, 0 vs 6 wks. ... 32
Figure 12: Number of sit-ups to volitional fatigue completed by males and females following 3 and 6 weeks of BR HIIT. Males n=18, Females n=15. Values are means ± SD, a p<0.05, 0 vs 3 wks; b p<0.05, 3 vs 6 wks; c p<0.05, 0 vs 6 wks. ... 33
x
Figure 14: Shoulder extension maximum voluntary isometric contraction (MVIC) for males and females following 3 and 6 weeks of BR HIIT. Males n=18, Females n=15. Values are means ± SD, a p<0.05, 0 vs 3 wks; c p<0.05, 0 vs 6 wks. ... 35
Figure 15: Male and female medicine ball slam peak power output following 3 and 6 weeks of BR HIIT. Males n=18, Females n=15. Values are means ± SD, a p<0.05, 0 vs 3 wks; b p<0.05, 3 vs 6 wks; c p<0.05, 0 vs 6 wks. ... 36
Figure 16: VO2 maximum for males and females during the Astrand arm ergometer protocol
xi
LIST OF TABLES
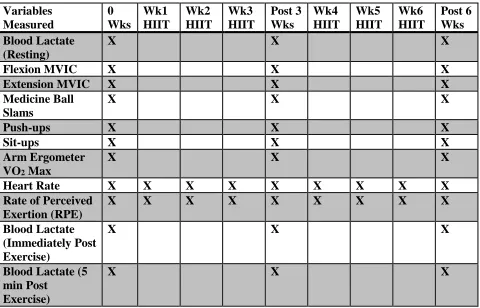
Table 1: The order of testing and data collection: “x” represents data collection. Baseline
testing, during training weeks 1-3, post 3 weeks of BR HIIT, during training weeks 4-6, and post 6 weeks of BR HIIT. The first 3 wks BR size for males was 50 ft, 1.5 inches, 25lbs, and for females was 40 ft, 1.5 inches, 20lbs. The last 3 wks battling rope size for males was 50 ft, 2 inches, 35lbs, and for females was 40 ft, 2 inches, 30 lbs. ... 10
Table 2: The exercise protocol throughout each HIIT session which saw the double whip and alternating whip interchanged each interval to minimize specific muscular fatigue, and reduce breakdown of form during each successive workout set. ... 23
Table 3: The investigator recorded each participants HR, RPE and cadence during each session to determine physiological responses throughout the BR HIIT study. ... 24
Table 4: Participant characteristics ... 27
Table 5: Double whip vs. alternating whip mean peak RPE and mean peak heart rate (HR) responses during the first and last 3 weeks of battling rope HIIT. ... 28
Table 6: Summary of 9th and 18th battling rope HIIT session blood lactate values for male and female participants... 30
Table 7: Summary of BR HIIT blood lactate values pre and post Astrand arm ergometer VO2
xii
ABBREVIATIONS
ACSM – American College of Sport Medicine
AVG - Average
BLa – Blood Lactate
BR – Battling Ropes
ft – Foot
HIIT – High Intensity Interval Training
HR – Heart Rate
KB – Kettlebell
kg – Kilograms
lb - Pound
lbs – Pounds
min – Minute
mins - Minutes
ml – Millilitres
MVIC – Maximum Voluntary Isometric Contraction
N - Newtons
RM – Repetition Maximum
RPE – Rate of Perceived Exertion
SD – Standard Deviations
sec – Second
secs - Seconds
VO2 – Oxygen consumption
VO2 max – Maximal oxygen consumption
1
INTRODUCTION
High intensity interval training (HIIT) is a form of cardiorespiratory training typically
performed at 80 -100% of maximum oxygen consumption (VO2 max) for 15- 90 seconds on a
cycle ergometer or treadmill (Gibala et al., 2012; Gibala & McGee, 2008). Each HIIT exercise
bout is separated by a period of low-intensity work or inactivity with work to rest ratios ranging
from 3:1 to 1:11, (Gosselin et al., 2012; Laursen & Jenkins, 2002), repeated 4-10 times per
session, with 1-7 workouts per week (Green et al., 2000; Rodas et al., 2000), for 1 to 15 weeks
(Simoneau et al., 1985; 1987).
Multiple studies have shown that HIIT yields the same oxygen consumption (VO2)
improvements as classical 12-16 weeks of aerobic conditioning, but with up to 90% less training
time (Burgomaster et al., 2008). Two weeks of HIIT produced significant increases in VO2 max,
cycle endurance time (increased 81-169%), and aerobic enzyme activity (citrate synthase,
cytochrome c oxidase, succinate dehydrogenase, and malate dehydrogenase) (Burgomaster et al.,
2005; Little et al., 2011). HIIT also improved anaerobic threshold (Astorino et al., 2012; Bayati
et al., 2011), and anaerobic enzyme activity (hexokinase, phosphofructokinase, and lactate
dehydrogenase) (Pilegaard et al., 1999; Ziemann et al., 2011). All of these HIIT improvements in
anaerobic/aerobic metabolic function may potentially lead to an increased time to volitional
fatigue (Juel et al., 2004).
In most studies, HIIT is performed on a motor driven treadmill (Cheetham et al., 1986;
Gosselin et al., 2012), or cycle ergometer (Gibala et al., 2006; Jacobs et al., 2013; Mckay et al.,
2009) focusing on VO2 training improvements in the lower body. Given the success of lower
2
muscle performance. Le Foll-de Moro et al. (2005) examined the effect of upper body HIIT on
VO2 in male and female wheelchair bound individuals using their wheelchairs and an
electromagnetic ergometer to apply propulsion resistance. This upper body (wheelchair) HIIT
consisted of a 1:4 work to rest ratio (i.e. 1 minute (min) work: 4 mins active recovery) for 6 sets,
3 times/week for 6 weeks, which resulted in a 36% increase in upper body VO2 max (Le Foll-de
Moro et al., 2005). Recently, Osawa et al. (2014) reported on a combined HIIT arm-leg cycle
ergometry protocol with the arm HIIT being 4 sets working at 90% arm ergometer VO2 max at a
1:1 work to rest ratio (60 seconds (secs): 60 sec active recovery), 2 times/week for 16 weeks.
Arm-leg combined HIIT resulted in a significant 20% increase in arm ergometry peak watts
suggestive of an increase in arm VO2, and an increase in muscle cross sectional area of the psoas
major, anterolateral abdominal muscles and the quadriceps femoris. HIIT arm-leg induced
skeletal muscle hypertrophy also correlated (r=0.90) strongly with an improved VO2 max
(Osawa et al., 2014).
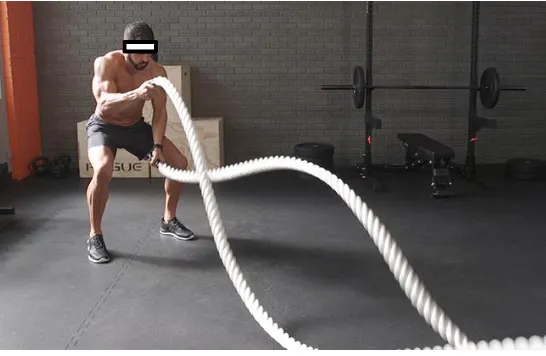
In the last decade, exercising with large diameter ropes (1-2.5 inches) called battling
ropes has emerged as a form of HIIT for upper-body cardiovascular training and strength
development. Battling ropes (BR) are typically 40-50 feet in length and anchored to the floor
creating two equal 20-25 foot lengths weighing between 20-75 pounds (lb). Typically,
participants position their bodies with knees and trunk slightly bent while grasping the BR ends
and moving their arms/shoulders up and down rapidly in the sagittal plane performing a double
whip exercise with both arms moving in unison (Figure 1), and/or an alternating whip exercise
3
Figure 1: Double whip motion. The starting position of the double whip exercise (with the ropes in a downward position) followed by the participant whipping the rope up, and then downward back to the final position, representing one complete cycle.
Figure 2: Alternating whip motion. Participants create battling rope motion with arms and shoulders alternating in movement. This shows both the starting and finishing point at which one full cycle is completed.
Compared to HIIT cycling or treadmill exercise, which are leg dominant, BR HIIT primarily
involves activation of upper body musculature (i.e. deltoids, biceps, triceps, and forearms), and
trunk musculature (external oblique abdominals and lumbar erector spinae) (Calatayud et al.,
4
In an acute BR study, Ratamess et al. (2015a) compared VO2 responses of BR HIIT
training to a series of standard resistance exercises and body weight exercises. The BR HIIT
training used a 50 foot, 1.5 inch diameter rope weighing 25 lb with subjects training at a 1:4
work to rest ratio (10 sec of alternating whip, 10 sec of double whip, and 10 sec of rope slams,
with 2 mins of rest) and this was compared to resistance exercises (squat, bench press, bent-over
barbell row, deadlift) for 3 sets, 10 repetitions at 75% 1RM, and to body weight exercises
(burpees, planks, push-ups) for 3 sets, 10-20 repetitions per exercise, with 2 min rest intervals
between all exercise modalities. They reported that the BR HIIT routine elicited the highest
mean VO2 response (24.6 ± 2.6 ml kg-1 min-1) compared to both burpees (22.9 ± 2.1 ml kg-1 min
-1) and squats (19.8 ± 1.8 ml kg-1 min-1), and also produced the greatest heart rate response (153.5
± 13.9 b min-1) compared to all other exercises (Ratamess, et al., 2015a).
Peak VO2 and heart rate (HR) responses to double whip BR HIIT were also examined by
Fountaine & Schmidt (2015) completing a 1:3 work to rest ratio (15 sec work: 45 sec rest), in
male and female subjects using a 50 ft, 1.5 inch, 35 lb BR. The BR HIIT protocol resulted in
heart rate responses that were 86% of age predicted HR max, and a peak VO2 of 40.2 ± 3 ml kg-1
min-1 in males and 31.3 ± 9 ml kg-1 min-1 in females (Fountaine & Schmidt, 2015). Similarly,
Ratamess et al. (2015b) examined BR peak VO2 responses following 8 sets of either at a 1:4
work to rest ratio (30 sec work: 120 sec rest), versus responses to a 1:2 work to rest ratio (30 sec
work: 60 sec rest), performing alternating whip action for 15 sec, followed immediately by 15
sec of double whip exercise. The 1:2 work to rest ratio elicited a higher peak VO2 response in
both male and female groups (31.6 ± 3.5 and 26.3 ± 5.4 ml kg-1 min-1) compared to the 1:4 work
to rest ratio (27.5 ± 4.3 and 21.9 ± 6.8 ml kg-1 min-1) (Ratamess et al., 2015b), suggesting a
5
In our lab, unpublished data by McAuslan (2013) examined VO2 responses to 4 weeks of
BR HIIT in males using a 50 ft, 1.5 inch rope weighing 25 lbs, and in females using a 40 ft, 1.5
inch rope weighing 20 lb for 10 sets, 3 times/week, at a 1:2 work to rest ratio (30 sec: 60 sec).
The BR HIIT protocol, produced a significant 7% increase in arm ergometer female VO2 max
(pre 31.1 ± 4.0 ml kg-1 min-1 vs. post 33.5 ± 3.2 ml kg-1 min-1), but did not significantly increase
male VO2 max (McAuslan, 2013). McAuslan (2013) also analyzed male and female blood
lactate values following 4 weeks of BR HIIT as an indirect measure of anaerobic glycolysis and
exercise intensity following an arm ergometer VO2 max. When comparing pre and post BR HIIT
blood lactate values after 4 weeks of training, females remained similar to pre BR training
indicating an increase in BR weight may have evoked a further increase in female blood lactate
and VO2 max. However, male blood lactate values decreased by 9% immediately post exercise,
and by 7% 5 minutes post exercise following 4 weeks of BR training. Data indicated that the 25
lb BR did not provide an adequate stimulus to significantly increase anaerobic metabolism
(blood lactate), rate of perceived exertion, or evoke a significant change in male VO2 max.
It is interesting to note that Ratamess et al. (2015a) used a 25 lb BR with a 1:4 work to
rest ratio (30 sec: 120 sec), peak VO2 responses were 38.6 ± 4.7 ml kg-1 min-1 while in a study by
Fountaine & Schmidt (2015), using a 35 lb BR with a 1:3 work to rest ratio produced a greater
peak VO2 response (40.2 ± 3 ml kg-1 min-1)(Fountaine & Schmidt, 2015), suggesting that
increasing BR weight, similar to thatof traditional progressive resistance training protocols, may
provide the critical stimulus to elicit increases in both male and female VO2 max and blood
lactates.
Collectively, various upper body BR HIIT training programs clearly indicate that upper
6
2015a) and VO2 max(McAuslan, 2013) similar to that reported for lower body HIIT programs,
and it has been suggested that increases in BR weight may create the necessary stimulus to
further increase VO2 max with BR HIIT.
While HIIT is traditionally thought of as a form of cardiovascular training, changes in
skeletal muscle characteristics following upper body HIIT have also been reported. Meier et al.,
(2015) studied a combination of BR HIIT exercises and kettlebell (KB) exercises and their effect
on altering muscular strength. Their BR and KB training protocol involved 20 minutes 3
times/week for 5 weeks, with 4 sets lasting 2.5 minutes, at a 1:1 work to rest ratio (15 sec work:
15sec rest), with no additional rest when switching between the BR and KB exercises.
Surprisingly, Meier et al. (2015) only reported a significant increase in right hand grip strength,
and the relative contribution of either BR or KB to the increases in right hand grip strength could
not be determined. McAuslan (2013) examined the effects of 4 weeks of BR HIIT with males
using 50 ft rope weighing 25 lbs, and in females using a 40 ft rope weighing 20 lb for 10 sets, 3
times/week, at a 1:2 work to rest ratio (30 sec: 60 sec). The data indicated a 10% increase in
males, and a 27% increase in female upper body skeletal muscle performance/strength
development (push-ups until failure), and increased female abdominal skeletal muscle strength as
evidenced by a 10% increase in female sit-up scores.
Along with changes in skeletal muscle characteristics due to upper body HIIT,
improvements in skeletal muscle power production have been reported. Driller et al., (2009)
analyzed the effects of HIIT arm-leg rowing in male and female rowers following 7 HIIT rowing
sessions over 4 weeks consisting of 8 work intervals at 90% of each rower’s peak power. They
reported HIIT arm-leg rowing significantly improved 2000m power (watts) 6%, and VO2 peak
7
(Driller et al., 2009). Kramer et al. (2015) comparing BR HIIT and KB training investigated
whether skeletal muscle power, as determined by the Wingate arm ergometer testing, was
improved more with BR HIIT or KB training following 12 training sessions over 4 weeks at a
1:3 work to rest ratio (15 sec: 45 sec), with 10 intervals per session. Kettlebell training weights
were based on each subject’s body weight and exercises consisted of 5 standard KB exercises,
versus 5 BR HIIT exercises. Kramer et al. (2015) reported that only BR HIIT increased peak
Wingate upper body power output by 12.5%.
These studies demonstrated that upper body HIIT and BR HIIT can lead to significant
increases in upper body skeletal muscle strength/endurance and/or power and indicate that
increasing the BR weight has the potential to generate additional increases in skeletal muscle
performance similar to that traditionally seen with increasing weight during resistance training
(Driller et al., 2009; Kramer et al., 2015; McAuslan 2013; Meier et al., 2015).
In summary, acute BR HIIT exposure has a significant effect on increasing upper body
male and female peak VO2 (Fountaine & Schmidt, 2015), increases in BR weight further
increased peak VO2 (Fountaine & Schmidt, 2015; Ratamess et al., 2015a), and 4 weeks of BR
HIIT increased arm VO2 max in females by 7%, but no improvement in male VO2 max
(McAuslan, 2013). Additionally, upper body HIIT improves skeletal muscle power (watts) by
4% (Kramer et al., 2015), and strength/endurance as evidenced by increases in push-ups till
failure for both male and female subjects, and increased female abdominal skeletal muscle
strength (sit-up scores) (McAuslan, 2013). McAuslan suggested that the failure to significantly
increase male VO2 max after of 4 weeks BR HIIT may have been due to the BR weight (25 lbs)
being an inadequate stimulus to evoke an increase in upper body VO2 max, indirectly indicated
8
supported indirectly by Fountaine & Schmidt (2015) who used a BR that was 10 lbs heavier than
the BR used by Ratamess et al. (2015a) and elicited a 4% higher peak VO2 response. Data
suggested that increases in BR weight, similar to increasing load in progressive resistance
training protocols, may provide the adequate stimulus to evoke increases in both male and
female upper body VO2 max, as well as elicit additional increases in skeletal muscle
strength/endurance and/or power.
Therefore, the purpose of this study is to determine the upper body cardiovascular and
skeletal muscle responses to increasing battling rope weight 10 lbs during two 3 week upper
body HIIT programs.
The specific objectives were to determine the progressive changes in:
1. upper body arm VO2 max during the BR HIIT programs
2. upper body strength/endurance, and power due to increasing BR weight
3. heart rate and rating of perceived exertion during and following the BR HIIT programs
4. blood lactate accumulation (immediately post, and 5 min post exercise) during and
9
METHODS
Session 1- Documentation and Familiarization session
This study recruited 18 males and 18 female recreationally active individuals from the University
of Windsor who had been exercising a minimum of 2x/week, for the past 3 months. The
population was chosen due to their familiarity of regular exercise (i.e. fatigue, muscle soreness,
and exercising heart rates). Participants were recruited from the University campus and the local
community via posters, e-mail, social media, and word of mouth (Appendix A, Appendix B).
This BR HIIT study was approved by the Research Ethics Board of the University of Windsor
allowing participants to engage in these tests and training protocols (REB# 16-239). When a
potential participant replied to a recruitment posting, they were sent a letter of information
(Appendix C) via email, giving them a better description of what the study entails. Individuals
still interested in participating were asked to come to the Multipurpose Research Lab (room 202)
in the Human Kinetics building, at the University of Windsor, where they were informed of the
study intentions both verbally and in writing, and asked to sign a written consent form (Appendix
D). Subsequently, participants were asked to complete the Physical Activity Readiness
Questionnaire Plus (PAR-Q+, Appendix E) that determines whether participants are free of any
known risks that would indicate potential issues in partaking in the physical exercise prescribed.
If the potential participants passed the PAR-Q+, they were asked to fill out the participant
information questionnaire (Appendix F), to collect demographic data including age, month/year
of birth, height, and weight, and to confirm inclusion/exclusion exercise criteria stated during the
recruitment process. Participants were then asked to schedule a date for their baseline testing
10
hours prior to testing. No exercise for 24 hours prior to testing minimized any muscle fatigue that
would interfere with testing data (Calatayud et al., 2015).
Participants were shown and explained the experimental design (Table 1). The first
“baseline testing” was done prior to the start of BR training, the second testing session was
completed post 3 weeks of BR HIIT, before rope weight was increased 10 lbs, and the last
testing session was completed at the end of the 6 week BR HIIT protocol (another 9 sessions).
Table 1: The order of testing and data collection: “x” represents data collection. Baseline testing, during training weeks 1-3, post 3 weeks of BR HIIT, during training weeks 4-6, and post 6 weeks of BR HIIT. The first 3 wks BR size for males was 50 ft, 1.5 inches, 25lbs, and for females was 40 ft, 1.5 inches, 20lbs. The last 3 wks battling rope size for males was 50 ft, 2 inches, 35lbs, and for females was 40 ft, 2 inches, 30 lbs.
Testing consisted of skeletal muscle shoulder flexion/extension Maximum Voluntary
Isometric Contractions (MVICs), medicine ball slams, the American College of Sports Medicine
Variables Measured 0 Wks Wk1 HIIT Wk2 HIIT Wk3 HIIT Post 3 Wks Wk4 HIIT Wk5 HIIT Wk6 HIIT Post 6 Wks Blood Lactate (Resting)
X X X
Flexion MVIC X X X
Extension MVIC X X X
Medicine Ball Slams
X X X
Push-ups X X X
Sit-ups X X X
Arm Ergometer VO2 Max
X X X
Heart Rate X X X X X X X X X
Rate of Perceived Exertion (RPE)
X X X X X X X X X
Blood Lactate (Immediately Post Exercise)
X X X
Blood Lactate (5 min Post
Exercise)
11
(ACSM) push-up test, YMCA sit-up test, and upper body Astrand arm ergometer VO2 max
protocol. As well, heart rate (HR), pre/post earlobe blood lactate (REB# 30-455, 031,
16-239), and rating of perceived exertion (RPE) data was collected during the VO2 max test.
During the familiarization session participants were given time to practice the BR
alternating and double whip HIIT techniques to familiarize themselves with BR prior to the
training sessions. At this point the investigator gave feedback to the participants about the proper
form while completing the BR exercise, so that for the first training session, participants gained
an understanding of how the training exercises should be performed. Participants were told that
they will perform 10 intervals, at a 1:2 work to rest ratio, with 30 sec bouts of all-out exercise
separated by 60 secs of rest. An emergency action plan for medical emergencies during exercise
testing and/or training was established as a precautionary measure (Appendix G).
Session 2: Baseline Testing Session
The baseline testing session took place in the Multipurpose Research Lab (room 202) of
the University of Windsor’s Human Kinetics building. Each testing session required
approximately 80 minutes of participation time including warm up, rest intervals, testing
exercises, and post exercise stretching. Participants were reminded via email to fast for 4 hours,
and to be alcohol and exercise free for 24 hours before all testing sessions. All participants
maintained their regular nutritional and exercise habits outside of testing dates. All testing and
training sessions were separated by a minimum of 24 hours, to provide time for muscle recovery.
Before all testing sessions and all training sessions participants were fitted with a Polar HR
monitor (Model E40) (Figure 3), to become accustomed to the feeling of wearing these devices
12
Figure 3: A is the Polar Heart Rate Monitor (Model E40) watch and the corresponding chest strap. B is the proper placement of the Polar Heart Rate Monitor chest strap. The chest strap should rest below the nipples and be centered just below the sternum.
On testing days, once the HR monitor had been fitted, participants were seated for 10 minutes of
rest prior to the collection and determination of baseline earlobe blood lactate concentration.
Increases in baseline blood lactate concentrations following exercise testing (arm ergometry)
represented the contribution of anaerobic metabolism to energy demand and exercise intensity
(Gibala & Mcgee, 2008; Ziemann et al., 2011). For blood lactate determination, the standard
earlobe technique (Figure 4A-F) was used. (REB #09-197; 16-031; 30-455; 16-239).
13
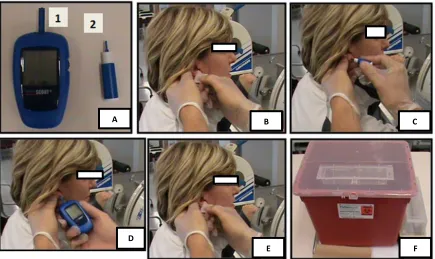
Figure 4: A is the Lactate Scout Analyzer (1) and Medlance 1.8 mm, 21G Autolancet (2) which was used for obtaining a single blood droplet and analyzing it for lactic acid concentrations. B is the participant’s ear being cleaned with an alcohol swab while the investigator was wearing protective gloves and safety glasses, before obtaining a blood droplet. C is the use of the Medlance Autolancet which was held against the earlobe and pressed until it clicks and then disposed of into the sharps container (only simulated in this photo). D is the Lactate Scout testing strip touched to the droplet of blood on the earlobe. Once the droplet touches the strip adequately and a reading is given by the Lactate Scout, the testing strip will be disposed of into the sharps container. E is the earlobe being cleaned with a different alcohol whip post sample. The Medlance Autolancet lactate testing strip and alcohol wipe were disposed of into the sharps container which is seen in F. All areas used were disinfected post-test, with the liquid
disinfectant found in the lab.
Participants with long hair were asked to have their pulled back to expose their ears. The
tester wore goggles and disposable latex gloves, and wiped the earlobe of the participants with an
alcohol wipe and dried the area (Figure 4B). The earlobe was then pricked with a single use
Medlance 1.8mm, 21G autolancet for the collection of a single drop of venous blood (Figure 4C)
onto a Lactate Scout Analyzer disposable lactate test strip (Figure 4D). Immediately following
collection, the investigator wiped the earlobe with another alcohol wipe (Figure 4E), recorded
A B C
D
14
the lactate value from the Lactate Scout, and immediately disposed of the lactate testing strip into
the sharps container (Figure 4F).
It should be noted that blood lactate measurements were taken immediately post arm
ergometry testing, and 5 minutes post arm ergometry testing, to facilitate the diffusion of
intramuscular lactate into the blood stream for a more accurate estimation of blood lactate
concentration (Cheetham et al., 1986; MacRae et al., 1992; Plowman & Smith, 2014). Each
lactate measurement was drawn from alternate earlobes to increase participant comfort.
Following blood lactate collection, a standardized dynamic warm-up took place
consisting of 10 jumping jacks, 10 backward and forward arm circles, and 10 alternating lunges.
This ensured that participants were prepared for movements associated with the baseline testing
session. Following the warm-up, a 3 minute rest break was taken prior to the initiation of the
muscular strength, endurance, and power tests to allow adequate recovery.
The first test was the shoulder flexion maximum voluntary isometric contraction (MVIC)
(Figure 5A). The subject was seated with their hips and torso secured using a padded belt
(EL881, Kuny’sTM Leather Manufacturing Company, Leduc, AB, CA) to ensure no movement of
the lower body and trunk during the test. During the initial testing procedure, the notch that the
belt was tightened to was recorded to maintain consistency with the other testing dates.
Participants were instructed to keep their back flat against the back of the chair to isolate
shoulder joint movement. The flexion MVIC set up (Figure 5A) used a rope handle attached to a
cable, which was attached to a load cell (Interface, AZ, USA) anchored to an overhead steal
beam. The load cell recorded the force generated during shoulder flexion (pulling downward) or
15
positioning was the same, however positioning of the load cell was changed to be anchored to
the floor (Figure 5B). Participants held the rope handles parallel to the ground (90 degrees of
shoulder flexion) for both flexion and extension MVIC (Figure 5A & 5B).
Figure 5: A shows shoulder positioning at 90 degrees for the shoulder flexion maximum
voluntary isometric contraction (MVIC) test, with each participant pulling downward 3 separate times, for 3 secs, with 30 secs of rest in between each attempt B depicts the same shoulder positioning but for the extension MVIC test with participants pulling upward 3 separate times, for 3 secs, with 30 secs of rest in between each attempt. As seen above, participants maintained a flat back throughout both testing procedures, with a padded belt across their hips and torso to prevent lower body and trunk muscle activity.
Each of the MVIC tests was held for 3 secs, and done 3 separate times (REB #16-031,
16-239). Participants were given 30 secs of rest between each of the MVIC’s to allow for muscle
recovery. The average of the forces was calculated and recorded as the baseline value for each
participant. Performing maximum voluntary flexion and extension isometric contractions were
measurements of isometric strength (Figure 5A and 5B), focusing on muscle activation of the
deltoids, biceps, triceps, and forearms used during BR activity (Calatayud et al., 2015). This
baseline MVIC value was then be compared to the post 3 weeks of BR HIIT values before the
rope weight is increased, and the post 6 week BR HIIT values.
A
90 Degrees
B
Load Cell
Padded Belt
Cable
16
The next participants completed the medicine ball slam test (Figure 6A/B), which
assessed muscular power changes due to BR HIIT.
Figure 6: A was the starting position for the medicine ball slam test with the medicine ball (6 lbs for males and females) at head level, with arms fully extended. B was the final position after the participant has slammed the medicine ball into the force platform. There were 3-5 practice slams allotted, followed by 3 recorded slams.
Participants were given 1-2 mins of rest to recover from the shoulder MVIC tests, but
remained seated in the testing chair. The investigator will demonstrate the medicine ball slam
test holding the ball with arms extended between 110-120 degrees of shoulder flexion at eye
level. The participant then threw the medicine ball into the force plate (Figure 6B), and the data
was recorded. Participants performed 3-5 practice slams followed by 3 recorded slams, which
were averaged providing a baseline value to be compared to the post 3 week BR HIIT values,
and post 6 week BR HIIT values, to demonstrate power improvements. Male and female subjects
used a 6 lb medicine ball (UltraFitTM EvolutionTM, Gopher®, Owatonna, MN, USA), to
accommodate strength and hand size differences between the sexes. Participants were given 30
secs of rest between each of the recorded ball slams.
A B
Force Platform Padded
17
After completion of the medicine ball slam test participants were given 2-3 minutes to
recover, this was followed by a test of each participants upper-body strength/endurance using the
American College of Sports Medicine (ACSM) push-up test (Figure 7).
Figure 7: A was the male starting (upward) position from the toes for the ACSM Push-up Test while B was the male lower finishing position for the ACSM Push-up Test. C was the female starting (upward) position from the knees for the ASCM Push-up Test. D was the female lower finishing position for the female ACSM Push-up Test.
Subjects were told to place their hands on the floor shoulder width apart (Figure 7A &
7C), with females performing push-ups being supported from their knees (Figure 7C) and males
performing this push-up test were supported by their toes (Figure 7A). During each push-up, the
chin must touch the mat to count as a successful attempt. Once they could no longer maintain
proper form on two consecutive push-ups, the test was terminated. This test was designed to
measure the maximum number of push-ups that a participant can do until volitional fatigue, and
represented a measure of skeletal muscle strength/endurance. This allowed the investigator to
determine the effect of BR HIIT on push-up endurance, comparing the baseline values, to the
post 3 weeks of BR HIIT values, and the post 6 week BR HIIT values.
B
C
18
After testing upper body muscular endurance, the subjects were given another 2-3 min
rest and then completed the YMCA Bent-Knee Sit-up test to establish trunk muscular endurance
(Figure 8).
Figure 8: A was the starting positioning for the YMCA Bent-Knee Sit-Up Test. B was the end positioning for the YMCA Bent-Knee Sit-Up Test. Once the elbows touch the knees, the
participant returned to the starting position (the shoulder blades return to the mat) to complete one full repetition.
All participants laid on their back, knees bent with their feet off the mat and hands behind
their head, with their elbows forward. The investigator held their feet still while the participants
lifts themselves off the floor until their elbows touched their knees, indicating a successful
repetition. The participant then lowered themselves to the floor until the upper portion of their
back touches the mat. The investigator recorded how many repetitions are completed until failure
at a cadence of 30 sit-ups per minute, or one every 2 seconds. When the participant could no
longer touch their elbows to their knees for two consecutive repetitions, the test was terminated.
The scores achieved by each participant in the baseline testing session provided a score which
was compared to the post 3 weeks of BR HIIT values, and the post 6 weeks of BR HIIT scores.
After the tests of muscular strength, power, and endurance, participants were seated for
10 minutes to recover prior to doing the arm ergometer aerobic capacity (maximal oxygen
consumption, VO2 max) test. The maximal oxygen consumption test for upper body (arm)
determined the participant’s ability to take in and utilize oxygen, the standard measure of aerobic
19
capacity. To determine the upper body VO2 max, participants pedalled with their arms on a
Monark Arm Ergometer (Model 881) (Figure 9), designed specifically for upper body aerobic
testing, while completing the progressive Astrand (1965) VO2 maximum protocol (Appendix I).
Prior to the arm ergometer test, the investigator began by recording HR data with the
previously fitted Polar HR monitor (Figure 3), which displayed the exercising HR of the
participants at each stage of the Astrand VO2 max test. Each subject was shown a Borg Ratings
of Perceived Exertion (RPE) 6-20 point scale which quantified the degree of difficulty felt by
each participant throughout different stages of testing and training sessions (Appendix J). During
the arm ergometer test, the investigator held up the RPE chart at the end of each 2 minute period,
and pointed to the scale, while having the subject indicate (nod) to the effort they perceived. The
participant was fitted with a Hans Rudolph facemask (Model V2) (Figure 9) which was attached
to the VO2 testing apparatus (Cosmed FitMate PRO) for minute to minute gas collection and
20
Figure 9: A illustrates the starting position of the Astrand Arm Ergometer Protocol (Appendix F). The head of the humerus was set parallel to the axis of the arm ergometer pedal axis. B displays the second half of a full rotation of the Arm Ergometer. The seat was set to allow adequate arm extension during the pedalling motion. 1 is the Hans Rudolph VO2 max mask with head straps for positioning and 2 is the Monark Arm Ergometer set shoulder height.
Participants were seated with their seat/body position set so that the head of the humerus
was parallel to the axis of the arm ergometer pedals and at a distance allowing adequate
extension of the arm during pedalling (Figure 9A and 9B).
The subject pedaled for a few minutes to familiarize themselves with the arm ergometer
motion. The participant began by arm pedalling at 60 rpm, which was set using a digital visual
display located on top the ergometer. The initial workload (resistance) was set at a workload of
10 Watts and then the workload was increased by 10 Watts every two minutes until the maximal
workload of 100 Watts was reached (Appendix I). If the participants were still pedalling at 100
Watts, participants then were instructed to increase the revolutions per minute by 10 every 2
minutes until volitional fatigue was achieved. RPE values recorded through each stage. During
the arm ergometer workloads, gas collection was monitored via the Cosmed FitMate PRO
equipment, continuously until volitional fatigue, along with HR via the polar heart rate monitors
and RPE via the Borg scale. As mentioned previously, immediately after completion of the
1
2
21
Astrand arm ergometer protocol an earlobe blood lactate measurement was determined, as well
as a 5 minutes’ post exercise blood lactate concentration. The Hans Rudolph facemask was then
sterilized in-between each participant in an autoclave located in the Kinesiology laboratory
(Room 241).
After all tests were completed, participants were again given the opportunity to practice
the BR alternating and double whip HIIT intervals to familiarize themselves prior to the training
sessions. The investigator provided feedback to the participants about the proper form while
completing BR exercise so that participants gained an understanding of how the BR exercises
should be performed, when they arrived for the first training session.
Battling Ropes HIIT Sessions
When participants arrived at the first training session they were fitted with a Polar HR
monitor (Figure 3), shown a copy of the Borg RPE 6-20 scale (Appendix J), instructed how to
count their cadence for each BR exercise, and given an explanation of the BR HIIT protocol. To
measure cadence during each interval, participants self-reported to the number of complete BR
cycles they performed (the number of times they returned to the start/finish position; double
whip= rope hitting the ground; alternating whip= right hand returning to elevated starting
position), to keep track of potential differences from interval to interval as fatigue sets in. The
standardized dynamic warm-up then took place consisting of 10 jumping jacks, 10 forward and
backward arm circles, and 10 alternating lunges. This is to ensure that participants were prepared
for movements associated with the training session. Following the warm-up, a 3 minute rest
break was taken prior to the initiation of the BR HIIT training to allow adequate recovery from
the warm-up. Participants were reminded about the work to rest interval ratio to which they
22
participants performed ten, 30 sec bouts of all-out exercise separated by 60 secs of rest, therefore
completing a 1:2 work to rest ratio (McAuslan, 2013; Ratamess et al., 2015b). This ratio was
chosen because it had been previously noted in an acute BR study to elicit greater VO2 response
compared to other less intense work to rest ratios. Total training session time was approximately
30 minutes including warm up, BR HIIT, and cool down.
Participants completed the two most common BR motions; the double whip (Figure 1)
which saw both arms moving together, and the alternating whip (Figure 2) which saw arms
moving opposite of each other in the sagittal plane. The 10 different rounds completed were
comprised of 5 alternating rope whip, and 5 double rope whip, interchanging each set (Table 2)
to prevent specific muscular fatigue and reduce deterioration of BR form between workout sets.
For both exercises, the rope was bolted to the floor using steel anchors, and participants were
coached on maintaining a head up, tight core, with knees and trunk in a slightly bent position. As
fatigue began to set in, the knees and trunk of participants may not remain completely stationary,
and it was the job of the investigator to constantly monitor participant technique and provide
23
Table 2: The exercise protocol throughout each HIIT session which saw the double whip and alternating whip interchanged each interval to minimize specific muscular fatigue, and reduce breakdown of form during each successive workout set.
Workout Set Rope Exercise
1 Double whip
2 Alternating whip
3 Double whip
4 Alternating whip
5 Double whip
6 Alternating whip
7 Double whip
8 Alternating whip
9 Double whip
10 Alternating whip
Participants began their “all out” exercising work interval completing double whip
exercise using a 50 ft 25 lb BR for males, and a 40 ft 20 lb BR for females, at 1.5 inches in
diameter (Figure 1), for 30 secs. A Gymboss Interval Timer (Figure 10) was used to track time of
the intervals using a “beep” to begin the work and rest periods.
Figure 10: Gymboss Interval Timer was pre-set to indicate the beginning and end of every work and rest period with a “beep”.
At the end of each work interval, participants self-reported their HR, RPE, and cadence
during all 18 BR HIIT sessions (Table 3). After 60 secs of recovery, participants then were asked
to complete a maximum “all out” effort of an alternating whip exercise for 30 secs (Figure 2),
and then the same length of recovery time was allotted, with the participants seated between
rounds.
24
Table 3: The investigator recorded each participants HR, RPE and cadence during each session to determine physiological responses throughout the BR HIIT study.
Round Battling Rope Variation (30 Secs) Rest Break (Secs) Heart Rate (BPM) RPE (6-20) Cadence
1 Double Whip 60
2 Alternating Whip 60
3 Double Whip 60
4 Alternating Whip 60
5 Double Whip 60
6 Alternating Whip 60
7 Double Whip 60
8 Alternating Whip 60
9 Double Whip 60
10 Alternating Whip 60
Throughout the first 3 weeks, males utilized a 50 ft, 1.5 inch diameter, 25 lb BR, which
was increased to a 50 ft, 2 inch diameter, 35 lb BR for the last 3 weeks of training (as seen in
Table 1). Females began with a 40 ft, 1.5 inch diameter, 20 lb BR for the first 3 weeks, and was
increased to a 40 ft, 2 inch diameter, 30 lb BR for the last 3 weeks. Female rope size was
shortened, reducing the weight of the rope, due to the difficulty shown with the full-length rope
in a pilot study by McAuslan (2013).
At the end of each testing and BR HIIT session participants completed a stretching
routine, where each stretch is held for a minimum of 20 secs. Sit and reach (hamstrings), seated
twist (low back and gluteal), arm across chest (chest), cobra (back and abdominal), and wrist
flexion and extension (forearm muscles) stretches are to be performed. A foam roller and
lacrosse ball were provided as well to aid in participant recovery post exercise. After each
training session, all equipment used (ropes, ergometer, seat, polar HR monitor, medicine ball)
25
Participant Confidentiality
Participant’s personal information and testing results was stored confidentially. All
digital data was stored on a password protected computer with hard copies being locked in the
investigators office locked away. All Cosmed VO2 data was stored on a password protected
computer in the Multipurpose Laboratory. All personal data was stored as a unique identification
number, instead of a participant name to further keep the data anonymous. Participants were
notified that if they felt uncomfortable, or would like to no longer participate in the research
study, they could withdraw from the investigation at any point in time.
Sample Size
The purpose of this study was to examine if there were any physiological adaptations in
shoulder maximum voluntary isometric flexion and extension contraction, shoulder medicine
ball slam power, push-up endurance, sit-up endurance, arm ergometer VO2 max, heart rate, and
metabolic adaptations in exercising lactate concentration with BR HIIT and increases in BR
weight after the first 3 weeks of the study. With an alpha level of 0.05, an effect size of 0.8, and a
power of 0.8, the sample size necessary to detect significant changes was 12 participants of each
sex. For this study, the aim was to recruit 18 of each sex to prepare against potential dropouts
negatively affecting the statistics.
Statistics
Statistical analyses were performed using IBM SPSS24. All data including descriptive
statistics were presented as means and standard deviations (SD). Discriminative analyses using
univariate ANOVAs were conducted on skeletal muscle performance data (Shoulder flexion
MVIC, shoulder extension MVIC, medicine ball slams, push-ups, and sit-ups), and physiological
26
relationships throughout the training protocol. All ANOVA’s required repeated measures on the
factor of time (baseline, post 3 weeks of BR HIIT, and post 6 weeks of BR HIIT). Direct
comparison of the two sexes were avoided due to the different lengths of BR that were used
throughout the testing and training period. For the analysis of lactate values a 3 (resting,
immediately after, and 5 minutes post exercise) x 3 (baseline, post 3 weeks of BR HIIT, and post
6 weeks of BR HIIT) repeated measures factorial ANOVA was used, with one for each sex.
27
RESULTS
Descriptive Statistics
Participant characteristics are outlined in Table 4. Three females dropped out due to
injuries obtained outside of the study, and the inability to adhere to the time commitment of the
training protocol.
Table 4: Participant characteristics.
Sex Age (years) Weight (kg) Height (m)
Males (n=18) 22.61 ± 2.09 82.99 ± 10.92 1.77 ± 0.07
Females (n=15) 23.13 ± 1.44 64.36 ± 7.13 1.66 ± 0.07
Values are means ± SD.
Battling Rope Specific Physiological Performance
Battling Rope HIIT RPE Response
Univariate analyses for males determined there was no significant differences in their
ratings of perceived exertion (RPE) responses with BR weight increases for both double whip F
(1,17) = 2.942, p=0.125, and alternating whip F (1,17). Females however, demonstrated
significant differences in RPE response with an increase in BR weight for the double whip
intervals F (1,14) = 19.240, p<0.01 (Table 5). Similarly, significant differences in heart rate
response were produced for alternating whip F (1,14) = 23.474, p<0.01, with an increase in BR
weight.
For males, comparing difference in double whip, and alternating whip with the light
ropes, there was a significant difference in RPE response F (1,17) = 235.501, p<0.001, as well as
a significant difference with the heavier BR F (1,17) = 45.720, p<0.001 (Table 5). Females
28
whip intervals for the light BR F (1,14) = 85.235, p<0.001 (Table 5). With heavier BR females
produced significant differences when comparing double and alternating whip intervals, as
alternating whip had a greater RPE response F (1,14) = 49.720, p<0.001.
Table 5: Double whip vs. alternating whip mean peak RPE and mean peak heart rate (HR) responses during the first and last 3 weeks of battling rope HIIT.
Sex Peak RPE
Double Whip Peak RPE Alternating Whip Peak HR Double Whip (bpm) Peak HR Alternating Whip (bpm) Males (n=18)
First 3 Wks (25lb Rope) Last 3 Wks (35lb Rope)
17.78 ± 0.17
17.91 ± 0.30
18.27 ± 0.23b
18.26 ± 0.26b
178.42 ± 1.17
178.52 ± 1.67
178.86 ± 1.15
177.24 ± 1.2ab
Females (n=15)
First 3 Wks (20lb Rope)
17.66 ± 0.26 18.16 ± 0.30b 178.7 ± 1.28 179.35 ± 1.55
Last 3 Wks (30lb Rope)
17.13 ± 0.22a 17.63 ± 0.23ab 176.35 ± 1.39a 176.19 ± 1.31a
Values are means ± SD. beats per minute – (bpm).
a p<0.05 First 3 wks vs Last 3 Wks. b p<0.05 Double whip vs Alternating Whip.
Battling Rope HIIT Heart Rate Responses
Univariate analyses for males produced no significant differences in average peak heart
rate (HR) between the double whip exercises with the increase in BR weight from 25 lb to 35 lb
F (1,17) = 0.018, p=0.897, however there was significant increase in average peak HR during the
alternating whip exercise after an increase in BR weight F (1,17) = 13.708, p<0.01. For females,
there was a significant increase in average peak HR when increasing the BR from 20 lb to 30 lb
for the double whip interval F (1,14) = 14.322, p<0.01, as well as during the alternating whip
interval F (1,14) = 28.283, p<0.01 (Table 5).
When comparing differences between the two styles of BR whips at the same rope
29
with the 25 lb BR weight F (1,17) = 3.189, p=0.112, however there was a significant difference
with the increase in BR weight to 35 lbs when comparing the two styles of BR whip F (1,17) =
8.438, p<0.05 (Table 5). In females, no significant changes in HR response were demonstrated
between the two styles of BR whip with both the 20 lb light rope F (1,14) = 2.425, p=0.158, and
30
Battling Rope HIIT Blood Lactate Response
For males, the univariate analyses determined that the [BLa] during the 9th BR session
rose significant immediately post exercise from resting levels F (1,17) = 194.890, p<0.001.
There was no significant difference between the immediately post exercise [BLa] and 5 minutes
post exercise F (1,17) = 4.540, p<0.05. When comparing resting values to that 5 minutes after
BR intervals, [BLa] remained significantly different F (1,17) = 125.416, p<0.001. For females,
there was also a significant rise in [BLa] during the 9th BR session from resting levels
immediately post exercise F (1,14) = 76.599, p<0.001. Similar to males, there was not a
significant decrease in [BLa] from the immediately post exercise to the 5 minutes post exercise
sample times F (1,14) = 3.346, p=0.089 (Table 6). Females also displayed significant differences
between resting values and 5 minutes post BR intervals F (1,14) = 72.849, p<0.001.
Table 6: Summary of 9th and 18th battling rope HIIT session blood lactate values for male and female participants.
Sex Resting Blood
Lactate (mmol/L) Immediately Post Exercise (mmol/L) 5 Minutes Post Exercise (mmol/L) Male (n=18)
9th Session 18th Session
1.65 ± .0.44 1.46 ± 0.24
10.56 ± 1.98a 10.79 ± 2.19a
9.71 ± 2.47bc 10.29 ± 3.19bc
Female (n=15)
9th Session 18th Session
1.61 ± 0.54 1.79 ± 0.58
8.33 ± 2.71a 8.21 ± 2.27 a
7.70 ± 2.57c 7.01 ± 2.15bc Values are means ± SD.
a p<0.05 Resting vs Immediately Post. b p<0.05 Immediately Post vs 5 Minutes
Post.
c p<0.05 Resting vs 5 Minutes Post.
Based on univariate analyses of [BLa] during the 18th BR session, for males,
concentrations rose significantly immediately post exercise F (1,17) = 188.869, p<0.001, and
31
males, [BLa] were also significantly different when comparing resting values to 5 minutes after
heavy BR intervals F (1,17) = 100.150, p<0.001. For females, during the 18th session [BLa] rose
significantly from resting levels immediately post exercise F (1,14) = 102.830, and then similarly
to males decreased significantly 5 minutes post exercise F (1,14) = 15.882, p<0.01. When
comparing resting values to 5 minutes after exercise, females produced a significant difference as
well, F (1,14) = 75.460, p<0.001.
A comparison of resting [BLa] for males between the 9th and 18th BR sessions did not
display significant changes F (1,17) = 2.283, p=0.149, along with no significant changes
immediately post exercise F (1,17) = 0.263, p=0.614, and 5 minutes post exercise F (1,17) =
0.043, p=0.838. Similar results were produced for females as differences between resting [BLa]
did not reach significance F (1,14) = 0.847, p=0.373, as well as no significant change
immediately post exercise F (1,14) = 0.082, p=0.778, and 5 minutes post exercise F (1,14) =
32
Skeletal Muscle Endurance
Push-ups
For males, univariate analysis showed significant improvements were produced after 3
weeks of BR HIIT F (1,17) = 21.60, p<0.001, with further significant improvements after the
second 3 week BR HIIT phase F (1,17) = 9.831, p<0.01 (Figure 11). Males also produced
significant increases between baseline (0 weeks) and post 6 week BR HIIT values F (1,17) =
30.866, p<0.001.
Figure 11: Number of push-ups to volitional fatigue completed by males and females following 3 and 6 weeks of BR HIIT. Males n=18, Females n=15. Values are means ± SD, a p<0.05, 0 vs 3 wks; b p<0.05, 3 vs 6 wks; c p<0.05, 0 vs 6 wks.
Females sit up scores also improved significantly after the first 3 weeks of BR HIIT F
(1,14) = 17.908, p<0.01. Significant improvements were also produced after the second 3 week
training period F (1,14) = 56.732, p<0.001. It is also important to note that females saw
significant differences when comparing post 6 week BR HIIT push scores, to that of baseline (0
33
Sit-ups
Based on the univariate analyses, for males there was a significant improvement in
consecutive sit-ups after the first 3 weeks of BR HIIT F (1,17) = 16.112, p<0.01, and further
significant improvement after the last 3 weeks of BR HIIT F (1,17) = 32.327, p<0.001 (Figure
12). For males, sit-up scores also increased significantly between baseline (0 weeks) and post 6
wks BR HIIT values F (1,17) = 40.876, p<0.001.
Figure 12: Number of sit-ups to volitional fatigue completed by males and females following 3 and 6 weeks of BR HIIT. Males n=18, Females n=15. Values are means ± SD, a p<0.05, 0 vs 3 wks; b p<0.05, 3 vs 6 wks; c p<0.05, 0 vs 6 wks.
Females also produced significant sit-up endurance improvements from the first phase of
BR HIIT F (1,14) = 37.246, p<0.001, and significant improvements from the second 3 week BR
phase F (1,14) = 9.571, p<0.01. Compared to baseline values (0 weeks), significant
34
Skeletal Muscle Strength
Shoulder Flexion MVIC
Univariate analyses revealed that for males, after the first 3 weeks of BR HIIT significant
shoulder flexion improvement was demonstrated F (1,17) = 14.825, p<0.01, with further
improvement also reaching significant levels after an additional 3 weeks of BR HIIT F (1,17) =
4.656, p<0.05, when compared to the first 3 weeks’ scores (Figure 13). Significant improvements
were also reported after the 6 weeks of BR training when compared to baseline values (0 weeks)
F (1,17) = 25.914, p<0.001.
Figure 13: Shoulder flexion maximum voluntary isometric contraction (MVIC) for males and females following 3 and 6 weeks of BR HIIT. Males n=18, Females n=15. Values are means ± SD, a p<0.05, 0 vs 3 wks; b p<0.05, 3 vs 6 wks; c p<0.05, 0 vs 6 wks.
Females generated significant improvements after both 3 week BR HIIT phases, F (1,14)
= 52.118, p<0.001, F (1,14) = 11.839, p<0.01, respectively. These increases lead to further
significant improvements when comparing baseline levels (0 weeks) to post 6 weeks of BR HIIT
35
Shoulder Extension MVIC
Using univariate analyses to determine shoulder extension improvements, males did not
improve significantly after the first 3 week period F (1,17) = 3.817, p= 0.067. When comparing
the first 3 weeks scores and post 6 weeks BR HIIT scores, males also did not improve
significantly F (1,17) = 0.076, p= 0.787, however comparing baseline scores (0 weeks) to post 6
week BR HIIT protocol score, males did produce significant improvements F (1,17) = 4.706,
p<0.05 (Figure 14).
Figure 14: Shoulder extension maximum voluntary isometric contraction (MVIC) for males and females following 3 and 6 weeks of BR HIIT. Males n=18, Females n=15. Values are means ± SD, a p<0.05, 0 vs 3 wks; c p<0.05, 0 vs 6 wks.
Females demonstrated significant shoulder extension improvement after the first 3 weeks
of BR HIIT F (1,14) = 13.708, p<0.01, but similar to the males, the improvement after the first 3
weeks did not reach significant levels F (1,14) = 0.071, p=0.793. Also, it is important to note that
significant improvements were found between the baseline testing session, and in the final