EVALUATION OF THE
ALBEMARLE-PAMLICO ESTUARINE STUDY AREA
UTILIZING POPULATION, LAND USE AND WATER QUALITY INFORMATION
by
Robert E. Holman
Water Resources Research Institute of The
University of North Carolina
Special Report Series SRS-11 WRRI Project No. 50172
ACKNOWLEDGMENTS
There is a large number of individuals to whom I am grateful for help and support through this sometimes "never ending project". I will only be able to name a few individuals, but without everyone's help this project would never have been completed.
I am particularly grateful to Mike Rink, Bill Mills, Greg Beam and the other members of the Center for Geographic Information and Analysis staff for the many hours of creating overlays, running statistics and plotting maps. Their tireless efforts were a real inspiration to me during the project.
Special thanks for supplying the needed data or providing me with the proper contact to gain the needed Virginia information are due to my state contacts in Virginia: John Carlock with the Hampton Roads Planning District Commission, Ann Brooks with the Virginia Council on the Environment, and Ron Gregory with the Virginia Water Control Board.
I would also like to extend my gratitude to all the county and U.S. Fish and Wildlife officials that took the time and reviewed the land use maps I sent them. I am particularly grateful to the county officials in the three focus areas for their extra effort in reviewing and returning the land use maps in a timely manner.
I am indebted to William Hogarth with the Division of Marine Fisheries for allowing me to make a flight with one of his pilots along the coast of North Carolina and to Richard Hamilton with the Wildlife Resources Commission for allowing me to make a second flight over the Research Triangle with one of his pilots. Both of these flights were invaluable in determining the relative accuracy of specific land use types and in gaining a better perspective of development
patterns.
Special acknowledgement is to David Vogt with the North Carolina Department of Environment, Health and Natural Resources, Environmental Statistics Section for help with the statistical analysis. His suggestions were invaluable in developing the regression models for population and developed land.
A word of thanks is in order for Randy Waite of Albemarle-Pamlico Estuarine Study and Bill Cole of the U.S. Fish and Wildlife Service for their support of this project.
Finally, I would like to express my appreciation to Jennifer Steel, formerly with Albemarle-Pamlico Estuarine Study, and Jeri Gray with Water Resources Research Institute for their review of an early draft of this report.
ABSTRACT
The purpose of this project is to discover and project trends in population and land use in the Albemarle-Pamlico Estuarine Study (APES) area in order to determine where land use conversion may impact the environment. To reveal trends, land use and population data for subbasins throughout the 23,250 square miles study area are described using the State of North Carolina's Geographic Information System (GIS). Results of this study should be valuable in the
development and implementation of a workable growth management strategy for both the entire APES basin and specific locations within the study area.
Land use/land cover information developed by Khorram et al. (1992) is a valuable tool in understanding the land use patterns and population trends
throughout the APES area. However, based on other data sources and government officials' comments, errors are identified in the land use categories of urban and wetlands. Acreage appears to be underestimated up to 50% for both land uses. A method is developed to correct errors in the two land uses of urban and
wetlands based on correlations with independent data sources and the resulting linear models.
Trend analysis for the period 1960 to 1990 indicates that the greatest population growth rate has been in the Neuse followed by the Tar-Pamlico,
Pasquotank and White Oak Basins, while the Chowan and Lower Roanoke Basins have experienced little growth over the 30 year period. Description of individual county population growth rates shows that three distinct clusters of counties/cities -the Virginia Beach Area, the Raleigh/Durham Area and the Greenville/Morehead Area-are experiencing the greatest growth.
Land use information based on a modified LANDSAT classification scheme developed by Khorram et al. (1992) yields seven categories. These categories for the entire APES area are urban (4.8%), agriculture (28.1 %), forest (28.4%), water
(14.6%), wetland (20.5%), shrub land (3.30/0) and barren land (0.2%). The
highest acreage of developed land is in the upper Neuse Basin and is related to the Raleigh metropolitan area. Wetlands are concentrated in the coastal counties/cities of the APES area. Forest wetlands make up approximately 70% of all the wetland types. The largest concentration of agricultural land is in the central portion of the Neuse and Tar-Pamlico Basins. Therefore, conversion of high percentage
agriculture (> 400/0) and wetlands (> 30%) is occurring in subbasins that also have a high percentage of development (> 50/0) and will cause conflicts in land use management.
The Albemarle Sound Basin is very rural, with only the Virginia Beach area experiencing any significant population growth. This growth is pushing south into the coastal portion of Dare County. There are 273 point sources of pollution in the
basin; however, most facilities are very small and discharge less than 10,000 gallons per day of treated effluent. Nonpoint sources of pollution appear to have the greatest affect on the basin and total nitrogen and phosphorus loadings are the greatest for the Chowan River, particularly the Blackwater River tributary.
The Currituck Watershed is quite diverse, ranging from the urban characteristics of Virginia Beach in the north to the rural characteristics of
Currituck National Wildlife Refuge in the south. There are 17 point sources in the watershed and none have any significant wastewater flow. Agriculture and urban runoff appear to be the largest contributors to water quality problems in the
watershed, with total nitrogen and phosphorus loadings among the highest in the entire APES area. The high rate of growth in this area appears to be putting the urban and rural portions of the watershed on a collision course.
TABLE OF CONTENTS
ACKNOWLEDGMENTS . . . iii
ABSTRACT . . . v
LIST OF FIGURES . . . ix
LIST OF TABLES . . . xi
I. BACKGROUND... 1
I-A. Introduction . . . 1
I-B Purpose . . . 2
I-C. Study Area . . . .. 2
II. METHODS OVERVIEW . . . 6
II-A. Information Sources . . . 6
II-B. Methods . . . 6
III. ENTIRE STUDY AREA . . . 9
III-A. Map Development . . . 9
III-B. Errors in the LANDSAT Data . . . 10
III-C. Land Use Map Corrections . . . 14
III-D. County Population Statistics . . . 16
III-E. Basin and Subbasin Population . . . .. 21
III-F. Land Use Statistics: Basins . . . 31
III-G. Land Use Statistics: Subbasins . . . 38
III-H. Intrabasin Comparison . . . 47
III-I. Population Versus Developed Land . . . 53
IV. HIGH GROWTH AREAS . . . 58
IV-A. Virginia Beach Area . . . .. 58
IV-B. Raleigh/Durham Area . . . 62
IV-C. Greenville/Morehead Area . . . .. 64
V. ALBEMARLE SOUND BASIN . . . 67
V-A. Characteristics . . . .. 67
V-B. Population Trends . . . .. 70
V-C. Land Use Classification . . . .. 70
V-D. Point and Nonpoint Sources of Major Nutrients. . . .. 72
V-E. Water Quality Trends . . . 75
V-F. Potential Impact on Striped Bass. . . .. 78
VI. CURRITUCK SOUND WATERSHED . . . 81
VI-A. Characteristics . . . 81
VI-B. Population Trends . . . 83
VI-C. Land Use Trends . . . .. 86
VI-D. Point and Nonpoint Sources of Major Nutrients . . . 89
VI-E. Water Quality Trends . . . .. 89
VII. CONCLUSIONS AND RECOMMENDATIONS . . . .. 93
REFERENCES . . . .98
APPENDIX A: Albemarle-Pamlico Estuarine Study Area . . . 102
APPENDIX B: Comparison of LUDA, LANDSAT, and Corrected LANDSAT Urban Class Acreage . . . 103
APPENDIX C: Comparison of LUDA, LANDSAT, and NWI Wetland Class Acreage . . . 104
APPENDIX D: APES Population Data by County/City: 1960-2010 . . . 105
APPENDIX E: APES Percent Change in Population by County/City: 1960-2010 . . . 106
APPENDIX F: APES Population Densities for Basins and Subbasins: 1970-1990 . . . 107
APPENDIX G: APES Land Use Acreage for Basins and Subbasins: 1987-1990 . . . 108
Figure 1.
Figure 2.
Figure 3.
Figure 4.
Figure 5.
Figure 6.
Figure 7.
Figure 8.
Figure 9.
Figure 10.
Figure 11.
Figure 12.
Figure 13.
Figure 14.
Figure 15.
Figure 16.
Figure 17.
Figure 18.
Figure 19.
Figure 20.
Figure 21.
Figure 22.
Figure 23.
Figure 24.
Figure 25.
Figure 26.
Figure 27.
Figure 28.
Figure 29.
Figure 30.
Figure 31.
Figure 32.
Figure 33.
Figure 34.
Figure 35.
Figure 36.
Figure 37.
Figure 38.
Figure 39.
Figure 40.
Figure 41.
Figure 42.
LIST OF FIGURES
Map of Study Area . . . .. 3
The Six APES Basins and Their Subbasins . . . 4
North Carolina Land Use: Development . . . 17
North Carolina Land Use: Wetlands . . . .. 17
Population: 1960-1990 . . . .. 19
Population Change: 1960-1990 . . . 20
Chowan Basin Population Density: 1970-1990 . . . .. 23
Pasquotank Basin Population Density: 1970-1990 . . . .. 24
L. Roanoke Basin Population Density: 1970-1990 . . . .. 25
Tar-Pamlico Basin Population Density: 1970-1990 . . . 26
Neuse Basin Population Density: 1970-1990 . . . 27
White Oak Basin Population Density: 1970-1990 . . . 29
Population Density by Subbasin: 1990 . . . 30
APES Basin Population in 1 990 . . . 32
Area of APES Basins in Square Miles . . . .. 32
Land Use/Land Cover: 1987-1990 . . . 33
Water Acreage for Each Basin: 1987-1990 . . . 33
Chowan Basin Land Use: 1987-1990 . . . 35
Pasquotank Basin Land Use: 1987-1990 . . . 35
Lower Roanoke Basin Land Use: 1987-1990 . . . 36
Tar-Pamlico Basin Land Use: 1987-1990 . . . .. 36
Neuse Basin Land Use: 1987-1990 . . . .. 37
White Oak Basin Land Use: 1987-1990 . . . .. 37
Chowan Subbasin Land Use: 1987-1990 . . . .. 39
Pasquotank Subbasin Land Use: 1987-1990 . . . 41
Lower Roanoke Subbasin Land Use: 1987-1990 . . . .. 42
Tar-Pamlico Subbasin Land Use: 1987-1990 . . . 44
Neuse Subbasin Land Use: 1987-1990 . . . 46
White Oak Subbasin Land Use: 1987-1990 . . . 48
Urban Land Use >5%: 1990 . . . 50
Areas of Potential Conflicts Between Urban and Other Uses . . .. 50
Land Consumption in Maryland: 1970/73 . . . .. 54
Land Consumption in Maryland: 1990/90 . . . .. 54
Land Consumption in North Carolina: 1970/70 . . . .. 54
Land Consumption in North Carolina: 1990/90 . . . .. 54
Estimates of Developed Land by Basins . . . .. 57
Location of Three Growth Areas . . . .. 59
Location of Albemarle Sound Basin . . . .. 68
Albemarle Sound Subbasins in Square Miles . . . .. 69
Albemarle Sound Subbasins Population: 1990 . . . 69
Albemarle Sound Basin Land Use: 1987-1990 . . . 71
Point Source Locations in the Albemarle Sound Basin . . . 74
Figure 43. Figure 44. Figure 45. Figure 46. Figure 47.
Location of the Currituck Watershed . . . 82 Currituck Sound Watershed Population Densities: 1980-1990 85 Currituck Sound Watershed Land Use: 1987-1990 . . . 85 Currituck Sound Sub-Watersheds Land Use: 1987-1990 . . . 88 Currituck Sound Watershed Point Source Locations 90
Table 1. Table 2.
LIST OF TABLES
Comparison of USGS and AlP Study Classifications . . . 7 Modified Land Use Classes for the Albemarle-Pamlico Estuarine
Study . . . 15
I. BACKGROUND
I-A. Introduction
Population growth and development within the APES watershed has caused the greatest, single environmental impact on the estuarine system. Therefore, a better understanding of the human impact and where it is taking place will be invaluable in developing management strategies for both specific areas of concern and the entire APES area. An evaluation on a subbasin, basin and entire
watershed scale is needed to define the extent of human impact on the existing natural resources.
The Albemarle-Pamlico Estuarine Study (APES) has funded many information acquisition projects over the last five years in the areas of resource critical areas, water quality, fisheries, and human environment (Steel and Scully, 1991). Most of these projects have transferred their data over to the APES's Geographic
Information System (GIS) which was created through a subcontract with the State Center for Geographic Information and Analysis (CGIA). GIS has the ability to bring together (enter, display, edit, and manipulate) data based information with digital mapping (Iocational attributes). At the time of this study, the CGIA had or was creating all of the needed data bases. CGIA was able to combine the data layers in various ways to analyze the relationship among different layers in a visual as well as a statistical manner. A further explanation of the available data layers and a description of the actual GIS system components can be found in two other CGIA documents (SCGIA, 1990a and SCGIA, 1990b).
Interaction with and participation of the North Carolina Striped Bass Study Management Board (SBSMB), which is conducting a study of striped bass in Albemarle Sound and the Roanoke River Basin, has greatly facilitated the development of key data layers. Critical to the completion of successful
I-B Purpose
The purpose of this project was to evaluate many other geographic data layers in relation to the existing land use data layer. The effort was to provide a better understanding of the potential effect human development is having on the APES invaluable estuarine system.
I-C. Study Area
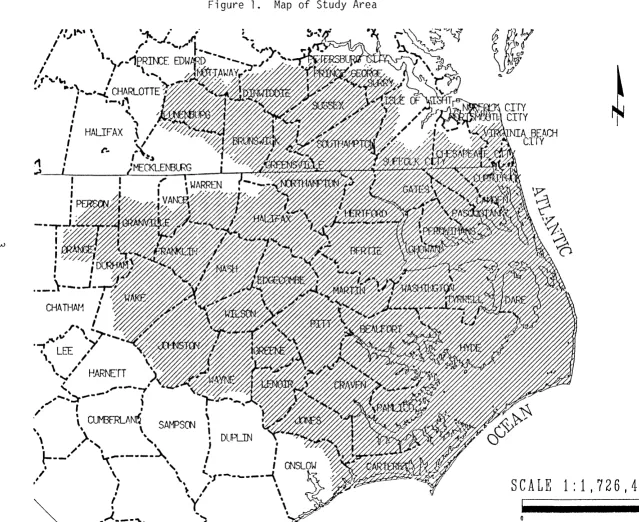
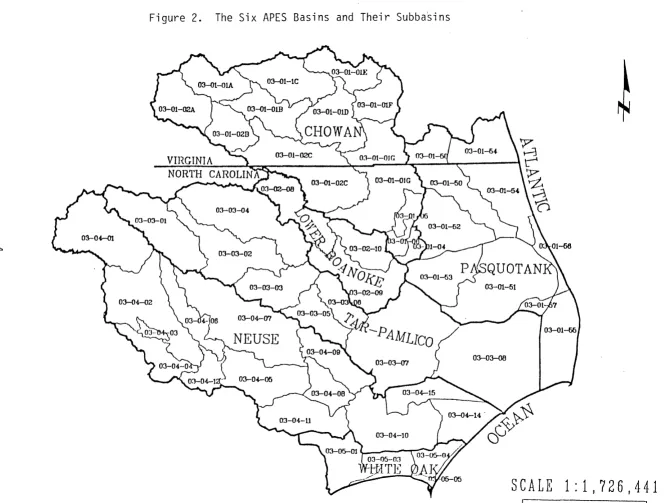
The APES study area, as defined in this study, encompasses approximately 23,250 square miles and includes all or portions of 37 counties in eastern North Carolina and 13 counties and 7 independent cities in southeastern Virginia. There are 5 counties and 1 independent city along the coastline, 9 counties along the sounds, and 36 counties and 6 independent cities that lie in the upper drainage basin (Figure 1 and Appendix A). APES incorporates all or portions of 6 major river basins: the Chowan, Pasquotank, Lower Roanoke, Tar-Pamlico, Neuse, and White Oak (Figure 2). Each basin is divided into subbasins: Chowan, 13; Pasquotank, 8; Lower Roanoke, 3; Tar-Pamlico, 8; Neuse, 14; and White Oak, 5.
One approach in describing the APES area is through aquatic ecoregions as defined by Omernik (1987). Ecoregions identify areas of relatively homogeneous ecological systems. The concept was developed to provide a geographic
framework for more efficient management of aquatic ecosystems and their
components. Omernik defined ecoregions as perceived patterns of a combination of causal and integrative factors including land use, land surface form, potential natural vegetation, and soils. A map of the conterminous United States that
defines 76 separate ecoregions was compiled by Omernik in 1986. The APES area is located in two ecoregions that are divided by a line running north and south and generally follows the western border of Isle of Wright, Hertford, Bertie, Martin, Beaufort, Craven and Jones Counties. The Southeastern Plain is the western ecoregion and is described as having a smooth to irregular plain land-surface form;
w
Figure 1. Map of Study Area
~
r •
. ' 1 . '-MEcKLENBlRG ////%f~~~~@~~u~v
.,l I I i I .-' .-'- , T , . ,
•
4'/' __ -"".
~
•
\•
~
DUPLIN
J,
I
~
\ , p
-~.
~
&~'
CJ
'F.:
?
'7
vi,
~
(")SCALE 1:1,726,441
+::>
Figure 2. The Six APES Basins and Their
Subba~ins~
, L H V l l " U / \ ) . \, l \ ~
<~
c , (
~03-03-08
~
~
(")SCALE 1:1,726,441
oak/hickory/pine and southern mixed forest (beech, sweetgum, magnolia, pine, oak) as the potential natural vegetation; a mosaic of cropland, pasture, woodland, forest, and urban land use; and ultisol soils. The Middle Atlantic Coastal Plain is the eastern ecoregion that lies adjacent to the Atlantic Ocean and is described as having a flat plain land surface form; oak/hickory/pine, pocosin (pine, holly), southern floodplain forest (oak, tupelo, baldcypress), and southern mixed forest (beech, sweetgum, magnolia, pine, oak) as the potential vegetation; woodland, forest with some cropland and pasture, and swamp as the land use; and aquult soils.
II. METHODS OVERVIEW
II-A. Information Sources
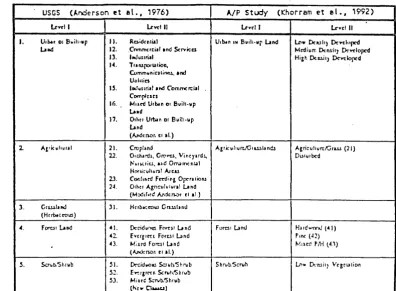
This study builds upon two earlier APES projects on land use and population trends. The objective of an earlier project by Khorram et al. (1992) was to obtain current imagery (Winter 1987-88) from the LANDSAT 5 satellite and develop a land use/land cover classification scheme of the entire APES study area. There were 18 separate classifications developed with U.S. Geological Survey's Level I and II classification scheme as seen in Table 1. Accuracy for all Level I classes was 73 percent except urban or built up land, which was 46 percent accurate. The objective of the second project by Tschetter (1989) was to characterize the demographic trends and seasonal population of 33 counties in the North Carolina portion of the APES area. The investigator found that during the 1980's the highest rate of growth in recreational development was connected with private residential housing, motel rooms, and marinas. Peak seasonal population was the greatest in Dare County with four times more people living there in the summer than year-round.
The investigations of Khorram et. al (1992) and Tschetter (1989) were the starting point for an evaluation of the population and land use trends of the entire APES area. A GIS was utilized to combine the land use and population data layers for a number of different years.
II-B. Methods
The idea for determining the relative accuracy of the various classes of land cover/land use was to send the map products to federal, state and local officials who would utilize them for their every day work. These individuals were asked to determine the relative accuracy of these map products based on the officials' particular application. No statistical tests were preformed on the government officials' interpretation of land use maps provided to them for review because it
Table 1. Comparison of USGS and
AlP
Study ClassificationUSGS (Arderson et eL, 1976) A./P Study (Khorram et eL, 1992)
uY'I'IJ UYCI" u .. dJ t.r .. cl II
I. V,boar 01 El~ill'.p II. Roidclllial U,btr. III B"ih'"r und t...c> .. DclUiI) ~YCI"pc1!
uad 12. .Commuci., Ind xn-ica Mel! i U/T, Oeruit} ~YC'oped
13. '...!umi.1 Hi&h 0e1W1) Oc-YCloped
104. T,. ns ror ~ I ioll,
Cumm~nic;linru. and UI/Illies
IS. IDJuJlri.1 Ind C"omrnc: rti.1 Comr'cus
Ir.. M.ud U,bn 0' Buill,"p Lud
J7. Orhc. Urmn 01 Eluili."p L.IIId
(N)dcfl.Or, tl II.)
l- A"iewh" •• , 21. Crop:and A,rKllhurt./G. &nIl nc.s A&ri=ullurtf,jr&n (21) 22. O.c.Jurtll, Ciro~. ViMyudl, DUlurbed
"""r~:.Jiu, .hd Orr .. mcn~1
H04'lirulr .. ~1 Alec
23. Cod.,.~ F~in, Op=-r.lK>ru
2~. 011>(1 AgriC\llulllr.! und (M:xlrr.rd A1I:kr=r cl II.)
3. CirLUlu",I 31. Hc,b,ceQuJ G~IHlI
(Hcrb.crollS)
~. fOfOI Lud .1. Occidll~ Forc11 und Fl>fCS1 urn.! Hm~..-nnJ (.1) .2. E"CI(,ctt forc..sl und f'mc (~2)
H Mjl~ FO=I und ~~llCC f'/H (4.'\)
(Iv>&:rwr, CI 11.)
S. So-wb. 'S~,rllb 51. Dt-=idllOw.l Scrwh'Shrub S h ru b. 'SCT\Ih Ln,. [kll.\il~ Vc,culion 52. EY::I,r~r, Sc",h/Shrub
53. MilrG 5..-r.rb.'Shrub
("'C'" Clw.&.U)
USGS (Anderson et elo, 1976) AlP Study (Khorrarr. et al., 1992)
u~I' uycllI lz~11 lrY't11l
G. W'I~ (~r-atrr) (,I. M./ir>e WaItt W,ld
62. E.. I • ., lI,e G). V~I"IIC (,.I. J:'pcrlllC
(o-.,dl. ~I .1.)
7. ","tll.nd 71. E..'nrl .. , '.".:rtid.1 Well.nd nor''''''' • ...! H.,!!...,.x. (71)
'km.~mw' RI1'Crl~! S"''''t (72 lowl 74)
72. EJh,trlw. '"tertillol Wr>od, r. .... rrtt. H."""cr:xi-'C",,Hc-r (7~)
73. E.'lu.rI", l"I~'lirl.l Nr>n. """."ric \Io'),1~ Cnhr (74) Vcr-Ialt'll t..r:-f'ocml. (,.",!I,r eo 75) ''14. '.'rU.;"c Ftwcurll Lr>-M.n~ (71) 75. ,.'etlllt( Sc .. b.'~hnrb Hi,~, Ma~ (7 I)
7(,. ra'"shllte Emel!e"'
77. hl"",1ott ~,Vcr-ialed
(0-,1111. rilL)
I. Ehrrco urtll "'- Dry ~It Flats e.rru ul'd S ... d (&2 _!J)
~2. Socha
n s.~J Are~ oIhcr rt.lft
f)acJ,a
~. F1arc E.trm~ Rnd
~S. Stir Mirr:s., 0..''';0, .Itd
On.-d ~hs ~. T,u,hlot<al ArtOIS
17. Mi.f'1!9mn ul'ld
(A.dc""'" t'I II.) .
t. TWMl" 91. Sltrwt .., Bm~ T.rodn
J2. t~T-'rt
fJ. .arr OroelOC!TII'I06n
f.C. " t l TPCl,.
'So MI.~ T.rodrt
(I\MkmJfl tI II.)
10 "CI"e1I"h:~Clfk:t 101. '~":~Id1 N/A
.02 Olacku (A.dcnoo r! II.)
was felt that individual interpretation is hard to measure with statistical methods. This phase of the methods section was only to determine whether Level I or Level II classification scheme was the most usable form for this study.
The method was broken into three phases. Phase One was the creation of county land use maps from the existing LANDSAT classification scheme. These map products were sent to the U.S. Fish and Wildlife Service, state, and county officials to determine the relative accuracy of the defined land use classes. The land use maps were also used by the author during flights over the coastal and Raleigh metropolitan areas to further clarify classification errors. Phase Two was to determine a method to correct some of the relative errors in the existing
classification. This was carried out by digitizing the corrections to the map products that were returned from the U.S. Fish and Wildlife Service, state, and county officials. The map information was also supplemented with other sources of information such as the U.S. Fish and Wildlife Service - National Wetland Inventory, U.S. Forest Service - Forest Inventory and Analysis, U.S. Bureau of Census - Census of Agriculture and U.S. Soil Conservation Service - National
Resources Inventory and Hydric Soils in North Carolina Counties. Phase Three was identifying correlations between different data sets such as county census
population and county acreage of developed land. If a strong correlation was found then a simple linear regression model was applied in order to predict the relationship between the two parameters. These models were used to correct some of the error in specific land use categories.
III. ENTIRE STUDY AREA
III-A. Map Development
There were two tasks involved in the development of land use and
population maps for the entire APES area: (1) defining the actual drainage area; (2) digitizing all the basin and subbasin boundaries in order to determine the land use and population.
The first task was to define the study area. It was decided to include the entire drainage area of the Albemarle and Pamlico Sound system including Core and Bogue Sounds. The upper Roanoke Basin (above Roanoke Rapids Dam) and a portion of the White Oak Basin (lying southwest from Camp Lejeune Marine Base) were not included. The two areas were excluded for the following reasons: (1) the upper Roanoke River Basin covers approximately 8,370 square miles in
Virginia/North Carolina and stretches over two-thirds the length of North Carolina. The combination of low growth, extensive reservoir systems, and distance from the sounds meant the cost/benefit ratio of including this portion of the Roanoke Basin was too low; and (2) a policy decision was made at the start of APES to have Carteret County as the furthest area south. However, due to the watershed approach used in this project to define the study area,
IDl
the subbasins in the White Oak Basin are included except the one furthest southwest, for which there was no compatible land use data.The second task was to digitize all basins and subbasins so population and land use could be estimated. All North Carolina basins and subbasins were digitized by the Research Triangle Institute and compared closely with the U.S. Geological Survey subbasins in North Carolina. Virginia subbasin information was supplied by Information Support Systems Laboratory within Virginia Polytechnic Institute and State University and was based on Soil Conservation Service (SCS) information. Due to the large number of subbasins identified by SCS in the Virginia
portion of the Chowan and Pasquotank Basins, subbasins were combined to create areas of similar sizes to subbasins identified in North Carolina. All subbasins were digitized from U.S. Geological Survey's 1 :24,000 scale topographic maps. Specific subbasins were identified by a six number code that was broken into two digit sets. The first two digits identified the regional basin; the second two digits
identified the basin; and the third two digits identified the subbasin. Codes used in this report were the same ones adopted by the North Carolina Division of
Environmental Management.
III-B. Errors in the LANDSAT Data
The next task was to determine any errors in the LANDSAT land use data, to develop methods to correct for these errors, and define the unclassified data referred to as "mixed pixels". Khorram et al. (1992) found that the "urban or built up" land use category was only 46% accurate based on "user's accuracy"
estimates and the accuracy of "forested wetlands" was unknown. The land use classification from 1987-88 developed by Khorram et al. (1992) will be referred to as the "LANDSAT" classification in this study. The Khorram classification was based on 1987-88 LANDSAT satellite imagery that was semi-automatically interpreted. The county map series was at a scale of 1: 1 00,000 with a final resolution of 1 acre.
The first decision was to determine what land use classification scheme to be used. LANDSAT land use classification defined 18 separate classes that can be generally broken into similar U.S. Geological Level I and Level II groupings. The land use classification was based on LANDSAT data which Khorram classified mostly as land cover with some land use classes. There is a distinct difference between land cover and land use that should be understood. "Land cover"
identifies the actual extent of vegetative and other cover types such as water that exists at anyone time. "Land use" is an interpretation of the data as to the
inferred use of the land. Therefore, interpretation of land use data is much more subjective and difficult to quantify than interpretation of land cover and is
dependent on the background and knowledge of the individual interpreter.
To determine whether the 18 class scheme would serve the purposes of this analysis, a test run was conducted. County land use maps were produced with 18 classes and sent out to have the information on the maps verified. These maps were provided to officials of three National Refuges within the APES area. The Great Dismal Swamp National Wildlife Refuge staff reviewed the LANDSAT land use map of the refuge (Dave Brownlie, Forester, Great Dismal Swamp National Wildlife Refuge, Personal Communication, June 1991). This refuge is located on the border between North Carolina and Virginia just south of Portsmouth, Virginia. The refuge covers approximately 105,000 acres and is predominantly forested wetland. The staff felt there was good clarity among development, agriculture, water, and forest; however, the different forest cover types had serious reliability problems. A major problem was the misclassification of wetter deciduous stands like cypress/gum and maple/gum as pine/hardwood forest. A second land cover map was sent to Mattamuskeet and Swan Quarter National Wildlife Refuges
personnel for their review (Kelly Davis, Wildlife Biologist, Mattamuskeet and Swan Quarter National Wildlife Refuges, Personal Communication, April, 1992). These two refuges are located entirely in Hyde County, North Carolina, and Swan Quarter is adjacent to the Pamlico Sound. These refuges together cover approximately 65,800 acres and are predominantly water, wetland, and forest. The staff found quite a few areas that were referred to as "mixed pixels" or unclassified sites that were actually open water or irregularly flooded brackish marshes. The staff also found several "White Cedar stands" that were actually marsh impoundment areas around Lake Mattamuskeet, and several "pine forests" that were actually mixed pine/hardwood or hardwood/cypress/pine forest. In general, both refuges indicated errors with the different forest and the mixed pixel classifications.
The Level II (18 classes) land cover maps were also sent early in the study to the counties that lie in the Currituck Sound Basin located south of Virginia Beach and adjacent to the Atlantic Ocean. Many map variations were sent to these county or state officials for their comment. The county or state officials could not evaluate all the classifications found in the Level II because of the time limitation and having little knowledge of a particular class such as wetlands.
Based on the comments by the U.S. Fish and Wildlife Service and county or state officials in the trial run, it was decided that the final map type to be sent to all county officials for comment would have the following attributes: LANDSAT land cover/land use data displayed at the USGS Level I with 6 categories shown in color, road network displayed from U.S Census TIGER files, map scale of
1 : 1 00,000, and modified Land Use Data Analysis (LUDA) land use data utilized to better define the urban or built up category.
LUDA was an early GIS effort started by U.S. Geological Survey in 1975 to define the land use for the entire United States (Kleckner, 1981). Source images were 1 :56,000 color infrared photography and 1 :80,000 black and white
photography dating back to 1970. All the photography was manually photo-interpreted. The map series included 1 :250,000 scale maps of North Carolina defining 37 uses based on the Level II classification system. Resolution was 10 acres for the urban or built up categories and 40 acres for the remaining
classifications (Robert Johnson, U.S. Geological Survey, Personal Communication, Reston, Virginia. June, 1991).
In 1991 and 1992, the author flew over portions of the coastal and Raleigh metropolitan areas to further define possible errors with the LANDSAT land use data. A flight along the Outer Banks and inland around the estuarine portion of the study area was provided by the North Carolina Division of Marine Fisheries. The fight occurred in December, 1991. A second flight covering portions of Wake,
Durham, and Orange Counties was provided by the North Carolina Wildlife
Resources Commission, occurred in January, 1992. Both flights were conducted to verify the problems with the categories of urban or built up, wetland, and unclassified areas (mixed pixels). The urban or built up class appeared to be underestimated on the LANDSAT 1987-88 land use maps mainly due to forest crown cover .that obscured the true land use on the ground. This changed the overall percentage of urban land from 2.5 on the original LANDSAT classification to 4.8 on the modified LANDSAT classification. High spectral reflectance of bare agricultural fields led them to be classified as developed areas. The problem with fields being identified as developed areas was especially evident in the LANDSAT scene that includes the Raleigh metropolitan area. During the flight
reconnaissance and for the remainder of the study, a state topographic atlas for Virginia and North Carolina produced by DeLorme (1989 and 1992) was utilized to identify specific locations throughout the APES area. A comparison of LUDA, LANDSAT and corrected LANDSAT urban class acreage for 21 counties is presented in Appendix B.
The problems associated with the wetland class were found to be the result of interference from forest crown cover. Wetlands were erroneously classified as "forest". This changed the overall percentage of wetlands from 1 0.9 on the original LANDSAT classification to 20.5 on the modified LANDSAT classification. Open marsh and pocosin wetlands were usually accurately defined by the
LANDSAT 1987-88 land use maps but closed forest canopy prevented standing water below the forest to be seen. Therefore these true wetland types were
usually defined as forest. A comparison of LUDA, LANDSAT and National Wetland Inventory (NWI) wetland class acreage for 14 counties is presented in Appendix C.
The category of "mixed pixels" represents a grouping of land uses that could not be identified. This classification accounted for 0.3 percent of the original LANDSAT classification. Flights over the coastal and Raleigh metropolitan areas
verified that in most cases mixed pixels were a mixture of standing water and wetland vegetation. The only exception to this observation was in Pasquotank County where poorly drained agricultural land had been defined as "mixed pixels" or "wetland".
These land use classification problems and others were identified at a workshop the author attended to verify remotely sensed land cover data for the Coastwatch Change Analysis Program of the National Oceanic and Atmospheric Administration (Burgess et aI., 1992). The findings were categorized into four topics: classification error, cover versus land use, categorical resolution and change detection. Classification errors included "salt and pepper" effect of individual
pixels, shadows and bare ground as urban areas, and problems with the degree of wetness during image acquisition. Cover versus land use describes the inherent problem of distinguishing between land uses and required ancillary information. Categorical resolution is related to spatial resolution and improper classification. Change detection describes the ability to detect a change but not necessary the nature of the change. From the author's own observations and the results of this workshop, methods were developed to overcome some of the problems associated with remotely sensed land cover data.
III-C. Land Use Map Corrections
Land use information was analyzed according to the Khorram et al. (1992) classification system but condensed from 18 to 7 categories (Table 2). Certain corrections were incorporated into some classes depending on the observed and reported error associated with each class. The LUDA data were used only to determine "developed land" because the information appeared to have the proper latitude/longitude coordinates and to be closer to the actual size of the land
encompassed than the original 1987-88 LANDSAT data set. Corrected LANDSAT built up areas on the maps returned by the county or state officials were found to
Table 2.
LAND USE CLASSES FOR
THE ALBEMARLE-PAMLICO ESTUARINE STUDY*
Urban/Developed
Agriculture/Grass
Shrub Land
Barren Land
Forest
Wetland
Water
Description
Residential, commercial, and industrial development
Cropland and pasture, including bare and grass covered soil
Area having some vegetative cover; can include old field, utility corridor and vegetative covered spoil pile
Bare, dry sandy soil; can include sand dune, bare sandy ridge and highly
reflective agricultural soil
Stand of conifer, decidUOUS, and mixed conifer/deciduous with evergreen hardwood shrub
Bottomland hardwood, Atlantic White
Cedar, riverine swamp, low pocosin, irregularly flooded marsh and
regularly flooded marsh
Lake, reservoir, pond, estuary, sound and large stream or river
* a U.S. Geological Survey Level I classification scheme was used because a more detailed Level II scheme was not found to be reliable at a county scale
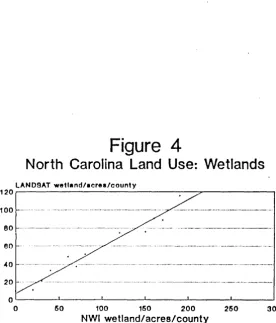
have a higher degree of correlation (R-squared of 0.9) with the LUDA "developed" category than LANDSAT maps (R-squared of 0.7). A linear regression model was used to predict built up land from the LUDA data (Figure 3). U.S. Fish and Wildlife Service's NWI data were used as a source of wetland acreage for the coastal plains of North Carolina (Wilen, 1990 and Burgess at aI., 1992). Wetland acreage for twelve of the coastal counties was obtained from an article by Morehead (1992). There was a high correlation between LANDSAT and the NWI county wetland acres (R-squared of 0.9) and a simple linear regression model was used to predict wetland acres from the NWI values (Figure 4). The actual character of the "mixed pixel" class was determined by the U.S. Fish and Wildlife Service personnel and 2 overflights of the APES area to be predominantly wetlands. The "mixed pixel" figures were incorporated into the wetland classification. All the corrections to the original LANDSAT data lead to the development of 1990 land use statistics. These corrections were solely based on the information provided from the sources cited above and error statistics can not be provided for the various interpretations of the land use data set.
III-D. County Population Statistics
Population change data for the study area were compiled from U.S. Census data (U.S. Census Bureau, 1960, 1970, 1980, 1990). Compatible census data for Virginia for 1970 was not available for the basin evaluation but was presented on a county level. The data will first be presented on a county level and then presented on a basin and subbasin level.
The 1990 census found the population of the U.S. to be almost 250 million people, an increase of 9.8% from the 1980 census. Since 1980, population in North Carolina had increased by 12.7%, and in Virginia by 15.7%. Over the same ten year period, the counties that make up the APES area grew, on average,
19.4%. This is double the national rate.
~
...,
Figure 3.
North Carolina Land Use: Development
LUDA DfWelopmentlThouund ACffle
eOr---~~
10
60 ..
---.---.---50 _ ... _ .. -.. -.. --.. ---... -.. - ... -... --... --... -..
~O "-'---'-'-'--30 - .. -- .... ~ .. ---.--. 20
10
or·-o 20 ~o 60 eo 100 120
LANDSAT Development/Thousand Acres
1072 LUDA11087-00 LANDSAT
140
Figure 4
North Carolina Land Use: Wetlands
LANDSAT wetland/acrea/county
120,r---~---~
100
eo
f-60 40 f-...
20
50 100 150 200 250 300
NWI wetland/acres/county
1990 county population within the APES area ranged from a low of 3,856 in Tyrrell County to a high of 423,380 in Wake County. (Complete county/city
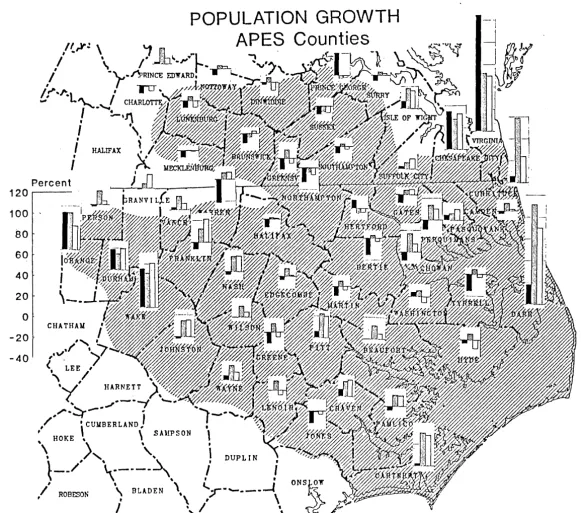
population data for 1960, 1970, 1980, 1990, 2000 and 2010 can be found in Appendix D and the percent change statistics for each county/city can be found in Appendix E). When all the counties' population for 1960 through 1990 are
displayed as bar charts a distinct pattern is evident (Figure 5). In very general terms the greatest population is in the counties that make up the southwestern
portion of the study area and the lowest population is in the counties that make up the northeastern portion of the study area. The Virginia Beach metropolitan area is an exception.
When the rate of growth is compared for the three census periods in each county, the rapid expansion of more metropolitan areas become even more
apparent (Figure 6). Growth occurs at the edge of the population centers and spills over into the surrounding areas. This is most evident in the Virginia Beach
metropolitan area with the spill over into Currituck and Dare Counties. The same trend is seen in the Raleigh area with the spill over from Durham into Orange County. One isolated area also emerges as having fairly high growth rates: the counties of Pitt, Craven and Carteret. This third high growth area has not experienced the 50 and 60% average growth rates of the Virginia Beach and Raleigh regions but has seen continued growth in the 10 to 20% range. The
highest growth rate average over the thirty year period is Virginia Beach at 68.9%, closely followed by Currituck County with 59.7 %.
In contrast to the experience of the majority of counties in the study area are some parts of the region did not grow. Over the thirty year period
Northampton County experienced an 8.0% population loss followed by Sussex County which lost 6.2% of its 1960 population. A total of 20 counties lost population over the thirty year period - Bertie, Greene, Halifax, Hertford, Hyde,
HALIFAX
Figure 5.
. POPULATION:1960-90
APES Counties/Cities
500 r - , ---
-400
f - '
1O 300 ..
200
100 CHATHAU I
I
o
,tv ..r
" '~/ ~(, LEE /
"\ /
''I'
HARNETT>
..
.. .".---t ...
"..
..
'-----
..
,..
/
# - f , "-_.",
, • CUMBERLAND , ..
: HOKE \, \ SAlfPSON "
\
)
,
.
\ • ' . ' . , DUPLIN
~-_/ \.----~\
i
,
. . , .
, /
ROBE~ON
' \ BLADEN.
' .~;r---l
\ '
\
I
~/
·
:
~
\
. . Pop. 1960 k~;.:.j Pop. 1970 0 Pop. 1900 D Pop. 1990
ij;r
:111
N
a
Figure 6.
- - 1 I
~~Jil
I
~O
- r;!I
}4 I:
dtiJ'
Go
I
,
/
Percent 1201 00
~
, . J(hPRANVIL,.EJb .---[1 7~ ~.
"-..
r~//lW~---1 . • - -~ z ~ /~;IT, t·/.~; . - - ~ i
. , n"q'£/,(g/1'//h, ...
,J,.
//p
.~~A (/~~
V'///.w . .
fn .
....{l, / / h _~
. '_~
_ _80 60 40 20
o
-20 -40 I_ • . . . , I' , . ,. I" . I . I I" , I" I" . , I' I" .I I" I" , , . . 1 , T . . . , I' I" I' I" I" , I" • _ . ~ . , ,. I" , . . , , , _ ,. , . , . , . I' ,. , . , " , . ./ J' , . ., ___ , . , , . , . , . , I _ , , . r _ ~ .. ~ _ ,-_ _ _ • _ , " . I .I
- .. -.,,_ - ,. .... _ . - - - - .,." _.," I
lo{(#f~I~ I
I
\-. ...1
CHA THAll •
I
' " ,
.
,,~,~
· J
<,
"LEE ' /"\ / ,
' , ( ' HARNETT
>,
/" ..
~--.. ." .. --! "-..
,/# • CUMBERLAND'
: HOKE \ \ SAlIPSON
\ ),
I"~
~-_/#
' \ - - - \,
.
".
, / ROBESON \ BLADEN ' . ....
;r---l
t \ ' \
I
' /
'
:
"
\•
,
,
\ t DUPLIN
I
Jones, Martin, Northampton, Tyrrell, and Warren in North Carolina and Brunswick, Charlotte, Dinwiddie, Greenville, Lunenburg, Mecklenburg, Nottoway,
Southhampton, Surry, and Sussex in Virginia. Most of these counties are located in the northern portion of the study area; 15 of the 20 are in the Chowan Basin and have shown little if any growth over thirty years. In summary, population growth within the APES area is not uniform; different parts of the areas face different challenges in dealing with population changes. For example, the Virginia Beach/Chesapeake City and Wake/Durham areas have both large population bases and continue to grow at rapid rates. On the other hand, the Washington/
Tyrrell/Hyde Counties and Nottoway/Lunenburg/ Brunswick Counties have small population bases and are not growing. Metropolitan areas are rapidly expanding outward while most rural areas are experiencing little if any growth based on the population census from 1960 to 1990.
III-E. Basin and Subbasin Population
The basin and subbasin population data were analyzed on the basis of density (persons per square mile [per./sq. mi.]) to compensate for shifts in tracts boundaries over time. A change in density is a surrogate for a change in
population. The population densities for basins and subbasins in the APES area can be found in Appendix F. To provide some perspective on the densities that exist, the average density for the United States during the 1990 census was 69 per./sq. mi. During this same census the average density for North Carolina was 126 per./sq. mi. and Virginia was 152 per./sq. mi.
Subbasins will be identified by their six number code as seen in Figure 2. When Virginia subbasins are identified, they may have an extra letter after the six number code. The extra letter is needed in order to correspond with the North Carolina Division of Environmental Management's coding system that was used in this study.
The Chowan Basin is subdivided into 13 subbasins and only 3 subbasins are entirely located in North Carolina. Population densities in 1990 range from 25.1 to 86.8 per./sq. mi. The highest population density appears to be in Subbasin 03-01-04 and associated with the Town of Edenton (Figure 7).
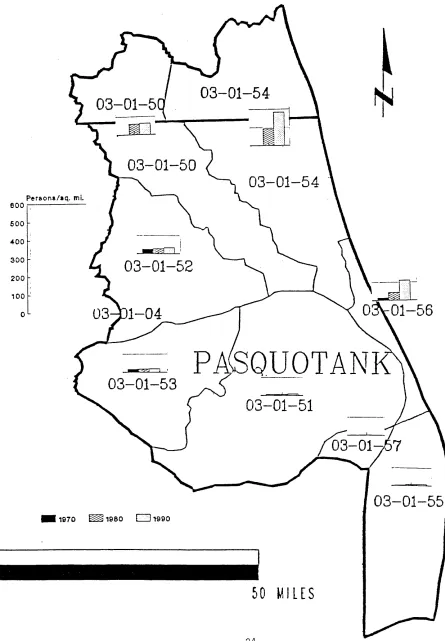
The Pasquotank Basin is subdivided into 8 subbasins, and all but 2 subbasins are located entirely in North Carolina. Population densities in 1990 range from 2.2 to 184.1 per./sq. mi. The highest population density is in Subbasin 03-01-54A and associated with the Virginia Beach and Chesapeake City (Figure 8).
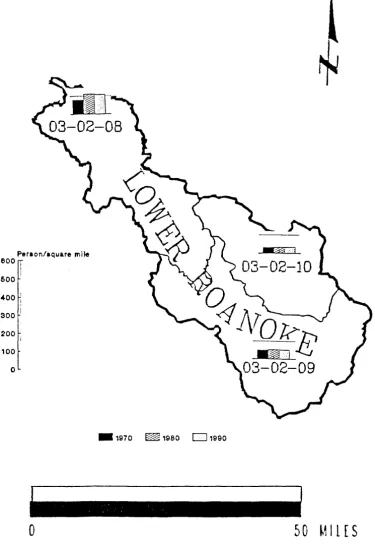
The Lower Roanoke Basin is subdivided into 3 subbasins, and 1990 per./sq. mi. varies from 32.6 to 107.0. The highest population density is in Subbasin 03-02-08 and associated with the City of Roanoke Rapids (Figure 9).
The Tar-Pamlico Basin is subdivided into 8 subbasins, and 1990 per./sq. mi. ranges from 3.4 to 222.5. The highest population density is in Subbasin 03-03-05 and associated with Greenville area (Figure 10). Review of the 1970 and 1980 census data reveals that growth has taken place in two upstream Subbasins (03-03-01 - Oxford/Louisburg areas and Subbasin 03-03-02 - Rocky Mount area). In the remaining subbasins (03, 04, 06, 07, and 03-03-08), little growth is taking place.
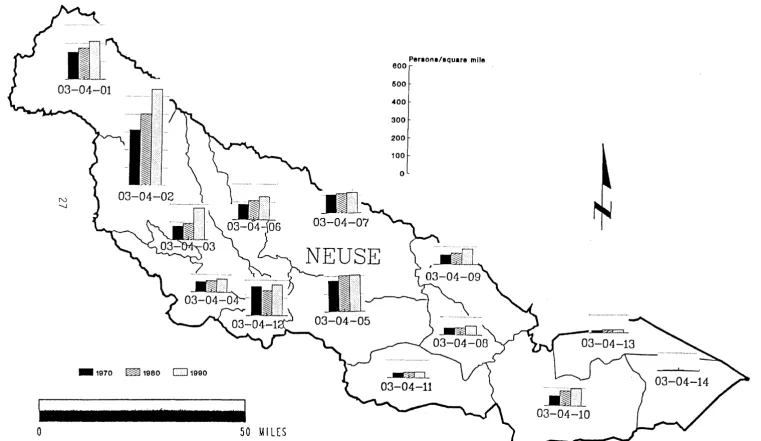
The Neuse Basin is subdivided into 14 subbasins, and 1990 per./sq. mi. range from 2.4 to 539.4. The highest population density is in Subbasin 03-04-02 and associated with the Raleigh area (Figure 11). A review of the 1980 and 1970 census data reveals that significant growth has taken place in 6 subbasins
including 03-04-01 (Durham/N. Wake County), 03-04-02 (Raleigh area), 03-04-03 (Middle Creek area), 03-04-06 (Zebulon and West Goldsboro areas), 03-04-09 (South Greenville), and 03-04-10 (Havelock and New Bern areas). The remainder of the subbasins, 03-04-04, 03-04-05, 03-04-07, 03-04-08, 03-04-11, 03-04-12,
Figure 7
Chowan Basin Population Densities
N . Personslsquare mile
w 600 -
---600
"'00
VIRGINIA
200 300
NOR'TH CAROLINA
~ m:zl100
03-01-02C
o
o
50.MILES·
o
Figure 8.
Pasquotank Basin Population Densities
Persona/aq. mi.
eoo~--500
400
300
200
'00 '
o
03-01-52
_>2,.. J I
03-01-53
_ '970 ~ 'geo 0 1990
03-01-54
Q.UOTAN
03-01-51
50 MILES
24
Figure 9.
L. Roanoke Basin Population Densities
Per.on/.quare mHe
600 I
!
500
400 ;
300 I
200
100
o
_ 1970 ~ 1980 01990
o
5 0
~111[ S
N
Q")
o
,Figure 10.
Tar-Pamlico Basin Population Densities
~
03-03-04
_ 1970 ~ 1980 01990
_ n . - -_ - - - . - - - _ n _ _
I
50 MILES
Penona/aquare mile
eOOr,---1500
.. 00
300
200
100
o
---PAMLICO
.... -_.-_.
-~
03-03-07
o
jl
.~.:
~.:... :.: ... ::: .. :: ... :.: .. :
...
..~
~
03-04-01
N '-l
_ 1970 ~ 1980 D 1990
Figure 11.
Neuse Basin Population Densities
50 MILES
Peraona/square mile
600 ~
500
400
300
200
100
~
03-04-13, and 03-04-14, showed little or no growth during the 30 year period. Subbasin 03-04-14 (located on the eastern tip of Carteret County in the Cedar Island area and consisting mostly of open water and wetland) showed negative growth during this same period.
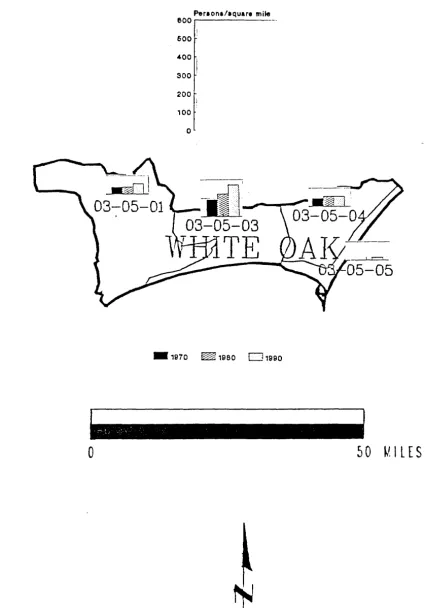
The White Oak Basin is subdivided into 5 subbasins, and all but one
(Subbbasin 03-05-02) are within the study area. Population densities range from 15.2 to 170.9. The highest population density is in Subbasin 03-05-03 and
associated with the Morehead City and Atlantic Beach areas (Figure 12). A review of the 1980 and 1970 census data indicates that the remaining subbasins (03-01-01, 03-05-04, and 03-05-05) showed no significant growth during the 30 year period.
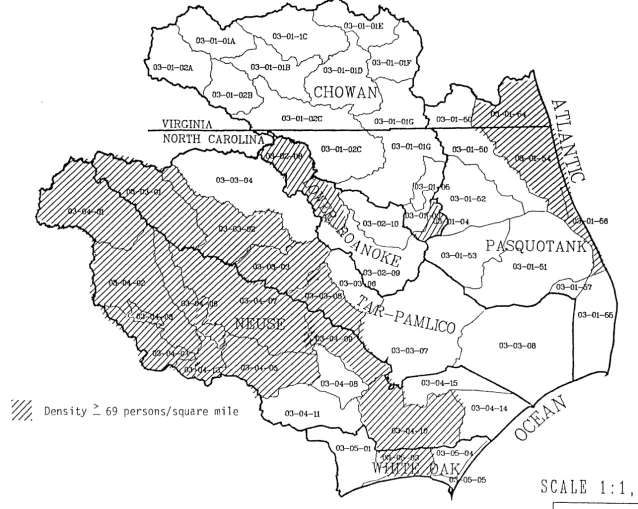
Specific population patterns for the APES area can be observed from the subbasin population densities that are equal to or greater than 69 per./sq. mi. (Figure 13). The Chowan Basin has higher density only in the most downstream subbasin (03-01-04) associated with the City of Edenton, and the Pasquotank Basin is experiencing a great deal of growth associated with the Outer Banks (03-03-54 and 03-03-56) in the areas of Nags Head and Duck. The Lower Roanoke Basin is experiencing growth in the upstream subbasin (03-02-08) related to City of Roanoke Rapids and the Tar-Pamlico Basin is experiencing growth in the four upstream subbasins (03-02-01, 03-02-02, 03-02-03 and 03-02-05) associated with Cities of Oxford, Louisburg, Rocky Mount, Tarboro and Greenville areas. The Neuse Basin is experiencing rapid growth particularly in the eight upstream
subbasins (04-01, 04-02, 04-03, 04-04, 04-05, 04-06, 03-04-07 and 03-04-12) associated with the Cities of Durham, Raleigh, Smithfield, Wilson and Goldsboro areas. There is also growth taking place in lower basins
(03-04-09 and 03-04-10) associated with the Cities of Greenville, Havelock, and New Bern. While the data do not show subbasin census tracts it is logical to
o
Figure 12.
White Oak Basin Population Densities
Peraona/aquare mi~ 600
600 .
400
I
300
200
100
o
- '970 ~ '980 D '990
29
w o
Figure 13. Population Density by Subbasin:
1990~
Density
~
69persons/square mile
03-03-08
:<:y~~
a
CJ
SCALE 1:1,726,441
- I
assume that the growth in these indicated subbasins is not occurring throughout each subbasin but is localized.
In summary, the APES region population data for the census years of 1970, 1980, and 1990 were evaluated on a subbasin level. Both county and
basin/subbasin data were reviewed to determine trends in the population of the APES area in 1990. The population of the study area was almost 2 million people with 53.1 % residing in the Neuse Basin which occupies only 26.8% of the land area (Figures 14 and 15). Together the Chowan, Tar-Pamlico, and Neuse Basins comprised 720/0 or 16,937 square miles of the APES area. Average population density for the basins ranged from 136.5 per./sq. mi. in the Neuse to 40.1 per./sq. mi. in the Chowan.
Generally, the region with the greatest population is located in the North Carolina Piedmont. The one exception is the Virginia Beach metropolitan area located in the extreme northeastern corner of the study area adjacent to the Chesapeake Bay. In contrast, the Chowan Basin located in the northeastern portion of the study area, 71 % of the counties lost population over the 30 year period from 1960 to 1990. This basin is heavily engaged in the agriculture and forest product industries. A large population base is not needed to maintain these commercial activities and the basin has remained rural. The trends indicate that the metropolitan areas of Raleigh and Virginia Beach will continue to expand
downstream in their respective basins and most rural areas will remain the same or lose population in the future.
III-F. Land Use Statistics: Basins
There were seven classes with the following percentages: urban (4.8%), agriculture (28.1 %
)' forest (28.4%), water (14.6%), wetland (20.5%), shrub land
(3.3%), and barren land (0.20/0) (Figure 16). However, the class of water is not a
true land use and will be discussed separately from the other six land use classes ..
W N
Figure 14.
APES Basin Populations in 1990
L. Roanoke (4.3%) • 85357
Neuse (51.2%) 1015511
• Only. portion ot the . . b.alna
• ..•• ~ Chowan (9.8%) 195485
_ White Oak (3.4%) •
64943
Figure 15.
Area of APES Basins in Square Miles
L.
ROan~;~gl.
,,,.dit
Whit. Oak 13.4%) ,56%)' . .
.HHH"~
801Tar-Pamllco (23.9%) 5577
w w
Figure 16.
LAND USE/LAND COVER: 1987-1990
Barren Land 0.2
Wetland 20.5
Modlfl.d 1987-88 LANDSAT Data
Agriculture 28.1
Figure 17.
Water Acreage for Each Basin: 1987-1990
Tar-Pamllco (30.0%) 651800
• Only a portion of th ••• baaln.
.. ~ Chowan (2.9%) 63003 White Oak (5.4%) •
118434
Neuse (18.6%) 403822
In general, the study area is rural in nature with less than 5% of the total area developed. More than 50 percent of the total APES acreage is in the categories of agriculture and forest.
When each basin is compared to the other five basins, the Pasquotank Basin has the largest percentage of water (928,208 acres) in the APES area (Figure 17). This fact is not surprising because this basin lies entirely in the coastal plain and encompasses many water bodies including 4 sounds, 7 rivers, 5 lakes and 1 bay. The basin with the second largest number of acres of water (403,822) is the Tar-Pamlico and includes 3 rivers, 17 bays and 1 sound. Because of the amount of water found in these basins there is a higher potential that land based pollution will reach the aquatic environment especially the estuarine areas. The remaining
discussion in this section (III-F) and the next section (III-G) will not include the class water as part of the analysis.
Urban use ranges from 3.9% in the Chowan Basin to 8.8% in the Neuse Basin. Agriculture ranges from 12.0% in the White Oak Basin to 37.7% in the Tar-Pamlico Basin. Forest ranges from 16.5% in the White Oak Basin to 42.2% in the Chowan Basin. Wetlands range from 18.2 % in the Chowan Basin to 57.2 % in the White Oak Basin. Shrub Land ranges from 1.4% in the Pasquotank Basin to 6.30/0 in the Lower Roanoke Basin. Barren Land ranges from 0.0% in the Chowan and Lower Roanoke Basins to 0.80/0 in the Pasquotank and White Oak Basins. Figures 18-23 provide the 1990 land use for each basin.
In general, while similar percentages of land uses exist in all the basins there are some clear exceptions. For instance, the Pasquotank and White Oak Basins are dominated by wetlands -- 41.4 and 57.2% respectively. The rural Chowan Basin has a high percentage (74.0%) of forest and agriculture land use while both the Neuse and White Oak basins are relatively developed. The White Oak has a low
w
Ol
Figure 18.
Chowan Basin Land Use: 1987-1990
Forest~~_.
42.2 ~
• doe. not Inc Iud. water
Agrlcul ture 31.3
Figure 19.
Pasquotank Basin Land Use: 1987-1990
Barren Land 0.8
Forest 23.4
Shrub Land
1.4
• do . . not Include water
Wetland·
41.4
w
Ol
Figure 20.
L. Roanoke Basin Land Use: 1987-1990
Wetland • 29.5
Shrub Land
6.3
• do . . not Include water
Urban
4
Forest
31.3
Figure 21.
Tar-Pamlico Basin Land Use: 1987-1990
Barren Land
0.4
Wetland • 18.7
• doe. not Include water
Forest
34.8 Urban
W
-.J
Figure 22.
Neuse Basin Land Use: 1987-1990
• do .. not Include water
Forest 31
Barren Land 0.1
Figure 23.
White Oak Basin Land Use: 1987-1990
Wetland 57.2
• do . . not Include water
Barren Land 0.8
Urban 7.7
percentage of agricultural land, which may be due to the high percentage of land in the wetland category. The percentage of shrub land is the highest in the White Oak and Lower Roanoke Basins and may reflect the high pocosins in the White Oak and young pine plantations in the Lower Roanoke. The percentage of barren land is the highest in Pasquotank and White Oak Basins and appears to be mainly
associated with sandy beaches along the Outer Banks. This category also includes highly reflective soil associated with the many scarps (old shorelines) located along the Coastal Plain of North Carolina. A listing of all the land uses including water with their associated percentages and acres for each basin and subbasin can be found in Appendix G.
III-G. Land Use Statistics: Subbasins
A graphical comparison has been made of land uses in subbasins within each basin (Figures 24-29). The sizes of these subbasins vary from 51 to 1225 square miles, with the average size being 455 square miles.
The Chowan Basin has 13 subbasins that drain three main tributaries of the Blackwater, Nottoway and Meherrin Rivers. Each subbasin in the Chowan Basin can be described from a land use perspective as seen in Figure 24. Overall, the headwater portion of the basin is very rural with more than 70 percent of the land use in forest and agriculture. The urban land use varies from 1.3 to 10.0 percent and becomes more prominent near the river mouth. Agriculture is fairly consistent through out the basin with percentages ranging between 26.4 and 47.9 except for Subbasin 02B with 19.0%. The forest classification is also consistent through out the basin and ranges from 29.8 to 59.4. Wetlands range from 3.1 to 26.7% and increases downstream to a maximum in Subbasin 01 G where the Blackwater and Nottoway Rivers merge to form the Chowan River at the state line between North Carolina and Virginia. Shrub land coverage ranges from 2.2 to 7.1 percent and appears to have the greatest acreage in a north-south band in the middle of the
Land Use Percentage
w 100""
lD
75"
50 ..
VIRGINIA
Figure 24.
Chowan Subbasin Land Use: 1987-90
25""
NORTH CAROLINA
0""
o
lffim Developed
lliilll Weiland
03-01-02C
50.MILES·
~ Agriculture 0 For . . t
m Shrub Land _ Barren Land
1-04
basin (Subbasins 01 F, 01 G and 050). Barren land is seen only in the downstream subbasins (030, 040, and 050) near the river's mouth and is probably associated with the highly reflective soil along the cliffs and scarps found in this region of the basin.
The Pasquotank Basin has 8 subbasins that drain the Yeopim/ Perquimans Rivers, Pasquotank River, North River/Currituck Sound, Scuppernong River
Area/Alligator River Area, Stumpy Point Bay, Nags Head Outer Banks Area, and Cape Hatteras Outer Bank Area. Each of the subbasins in the Pasquotank Basin can be described from the land use perspective as seen in Figure 25. In general, the basin has its greatest urban percentage and its lowest agriculture and forest percentage along the Outer Banks. Wetlands are highest in the subbasins
associated with the Dismal Swamp and Albemarle-Pamlico Peninsula. Urban land use varies from 0.6 to 30.0 percent and becomes very prominent along the Outer Banks (especially in subbasins 550 and 560). Agriculture is fairly constant in the western subbasins (29.7 to 38.90/0) but decreases to less than 12 percent in the Outer Banks subbasins (550, 560, and 570). Forest class is consistent (19.4 to 21 .5 percent) in the western subbasins but, increases to more than 70 percent in Subbasin 570. Wetlands ranges from 22.4 to 52.8 percent and predominate in the Subbasins of 50A, 510 and 54A. These subbasins are part of the Great Dismal Swamp and Albemarle-Pamlico Peninsula, and both are known for the extensive forested wetlands that are defined in this report as wetlands. Shrub land ranges from 0.3 to 2.6 percent and is considered a minor land use. Barren land has the highest percentage (8.0 to 9.0 percent) in Subbasin 550 and 560 and probably indicating the sandy beaches along the Outer Banks.
The Lower Roanoke Basin has 3 subbasins that drain the lower portion of the Roanoke River including the Cashie River. Figure 26 provides an overview of the various land uses for each subbasin. Urban land use varies from 2.3 to 7.0 percent and is highest in the upper subbasin (080) which is associated with the
Land Uae Percentage '00'1.
75'1.
50'1.
25'1.
0'1.
o
Figure 25.
Pasquotank Subbasin Land Use: 1987-90
I
03-:::\::::.-53
E3 Urban
[ 3 W.IlUld
03-01-54
03- ····-54
~
I
QUOTANl
111111
03-::::::-51
~ AQrlcultural
lID: 8hrub Land
41
lim!'
::" :~
50 MILES
o
Fornt'oo~
75~
50~
25~
Figure 26.
L. Roanoke Subbasin Land Use: 1987-90
land Use Percentage
o
§ Urban
o
Weiland~ Agricultural CJ Fore.t
~ Shrub L.and _ Bar,..n Land