Netbench – large-scale network device testing with real-life
traffic patterns
Stefan NicolaeStancu1,∗,Adam LukaszKrajewski1,MattiaCadeddu2,MartaAntosik1, and
BerndPanzer-Steindel1
1CERN, Geneva Switzerland
2Università degli Studi di Cagliari (IT)
Abstract. Network performance is key to the correct operation of any
mod-ern data centre infrastructure or data acquisition (DAQ) system. Hence, it is crucial to ensure the devices employed in the network are carefully selected to meet the required needs. Specialized commercial testers implement standard-ized tests [1, 2], which benchmark the performance of network devices under reproducible, yet artificial conditions. Netbench is a network-testing frame-work, relying on commodity servers and NICs, that enables the evaluation of network devices performance for handling traffic-patterns that closely resemble real-life usage, at a reasonably affordable price. We will present the architecture of the Netbench framework, its capabilities and how they complement the use of specialized commercial testers (e.g. competing TCP flows that create tempo-rary congestion provide a good benchmark of buffering capabilities in real-life scenarios). Last but not least, we will describe how CERN used Netbench for performing large scale tests with partial-mesh and full-mesh TCP flows [3], an essential validation point during its most recent high-end routers call for tender.
1 Introduction
When evaluating the performance of network devices we need to ensure they have the re-quired features in terms of management and protocols (software features, with a fast en-hancement cycle) and, more importantly, in terms of raw performance (hardware features, with a much slower enhancement cycle).
Given the diverse nature of CERN’s networks (campus network, data centre, accelerator control network, experiments’ control and data acquisition networks), we need to ensure that devices can correctly cope with various traffic patterns. For example:
• A full-mesh traffic distribution [3] is most likely the best benchmarking pattern for a
net-work device to be employed in a multi-purpose data-centre;
• A unidirectional partial-mesh traffic distribution [3] closely mimics the event-building
traf-fic pattern from a DAQ system.
The established benchmarking methodology [1, 2] consists of various tests that create pre-defined traffic patterns, in order to allow a precise comparison. However, some features
(e.g. buffer depth) are not exercised by these tests, and performing a full test for a high end
device with many ports requires a large number of expensive commercial testers.
We will start by presenting the typical approach to benchmarking network devices using specialized commercial testers, and describe the benefits and limitations of these approaches. Subsequently we will introduce Netbench (the network testing framework that we have de-veloped, which uses commodity servers and the iperf3 [4] traffic generator) and describe how
it addresses the shortcomings of specialized commercial testers (i.e. the cost of large-scale setups, and the ability to inject realistic traffic patterns that exercise buffering capabilities).
Furthermore, we will present how CERN has successfully benchmarked high-end routers us-ing an affordable combination of a small scale setup with specialized commercial testers (two
ports) and a Netbench setup with 64 servers for large scale traffic injection.
2 Benchmarking with specialized commercial network testers
In this section we will present the two typical approaches for benchmarking network devices performance using dedicated network testers: the full testapproach (desirable, but costly, due to the high tester port count requirement) and the“snake-test”approach (affordable, but
limited to a simple linear traffic pattern).
2.1 Full test with specialized network testers
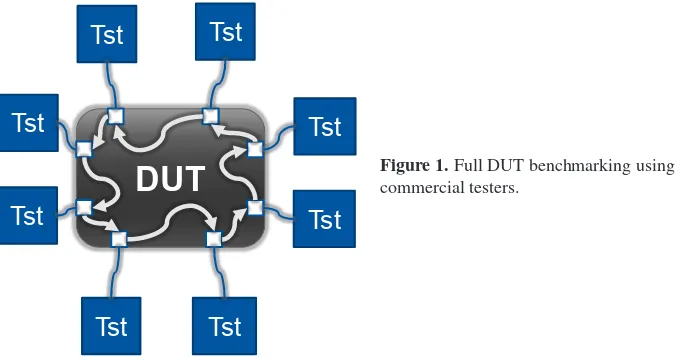
The complete benchmark of a device under test (DUT) requires connecting a tester port to each port of the DUT, as depicted in figure 1. The full mesh test described in [2] exercises the switching fabric of the DUT, but does not stress-test its buffers, because each tester port
must choose its destination in a round-robin fashion that is meant to avoid congestion (i.e. two ports should never simultaneously send packets to the same third port). Specialized congestion tests are foreseen, but they only exercise a handful of ports.
Luxurious approach
Netbench - CHEP2018 Stefan Stancu 3
Tst = Tester
DUT = Device Under Test
Tst
DUT
Tst
Tst
Tst
Tst
Tst
Tst
Tst
A-1
A-N
B-1
B-N
A-1
A-N
B-1
B-N
Figure 1.Full DUT benchmarking using commercial testers.
Thefull testwith specialized network testers has the following advantages:
• It fully exercises all the ports, at line-rate and with a fair range of packet sizes.
• It enables sending complex traffic distributions through the DUT, notably partial-mesh and
full-mesh.
(e.g. buffer depth) are not exercised by these tests, and performing a full test for a high end
device with many ports requires a large number of expensive commercial testers.
We will start by presenting the typical approach to benchmarking network devices using specialized commercial testers, and describe the benefits and limitations of these approaches. Subsequently we will introduce Netbench (the network testing framework that we have de-veloped, which uses commodity servers and the iperf3 [4] traffic generator) and describe how
it addresses the shortcomings of specialized commercial testers (i.e. the cost of large-scale setups, and the ability to inject realistic traffic patterns that exercise buffering capabilities).
Furthermore, we will present how CERN has successfully benchmarked high-end routers us-ing an affordable combination of a small scale setup with specialized commercial testers (two
ports) and a Netbench setup with 64 servers for large scale traffic injection.
2 Benchmarking with specialized commercial network testers
In this section we will present the two typical approaches for benchmarking network devices performance using dedicated network testers: the full test approach (desirable, but costly, due to the high tester port count requirement) and the“snake-test”approach (affordable, but
limited to a simple linear traffic pattern).
2.1 Full test with specialized network testers
The complete benchmark of a device under test (DUT) requires connecting a tester port to each port of the DUT, as depicted in figure 1. The full mesh test described in [2] exercises the switching fabric of the DUT, but does not stress-test its buffers, because each tester port
must choose its destination in a round-robin fashion that is meant to avoid congestion (i.e. two ports should never simultaneously send packets to the same third port). Specialized congestion tests are foreseen, but they only exercise a handful of ports.
Luxurious approach
Netbench - CHEP2018 Stefan Stancu 3
Tst = Tester
DUT = Device Under Test
Tst
DUT
Tst
Tst
Tst
Tst
Tst
Tst
Tst
A-1
A-N
B-1
B-N
A-1
A-N
B-1
B-N
Figure 1.Full DUT benchmarking using commercial testers.
Thefull testwith specialized network testers has the following advantages:
• It fully exercises all the ports, at line-rate and with a fair range of packet sizes.
• It enables sending complex traffic distributions through the DUT, notably partial-mesh and
full-mesh.
The shortcomings of this test setup are:
• The cost is high, due to the large number of required tester nodes1. Benchmarking a high
end device with hundreds of ports (e.g. 100 Gigabit Ethernet ports) is cost prohibitive for most companies. Such tests are generally performed by specialized third-party companies (e.g. [7]).
• The device buffering capabilities are only lightly exercised, due to the round-robin choice
of destinations (as previously explained at the beginning of Sect. 2.1).
2.2 “Snake test” with specialized network testers
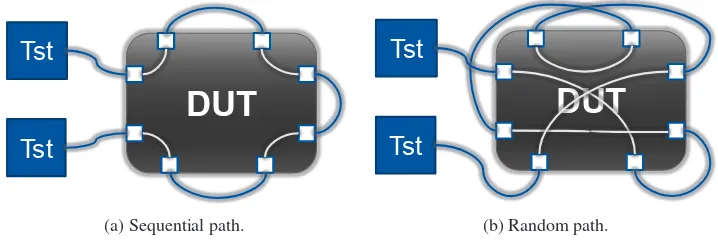
Due to the prohibitive cost of specialized network testers, most companies that need to bench-mark network devices use only two tester ports to inject traffic into the device under test, and
then repeatedly loop traffic back through all ports of the device (the “snake test”, depicted in
figure 2).
Benchmarking a DUT in a “snake-test” setup has the following advantages:
• It is an affordable test setup (it only requires two tester ports)
• It fully exercises all the port (line-rate traffic for any packet size)
The shortcomings of this test method are:
• It barely stresses the switching engine of the device, as the traffic follows a linear path. The
simplest approach is to use a sequential path (as illustrated in figure 2a), with the disadvan-tage of being easy to predict and optimize on the manufacturer side, and barely exercising inter-module communication for modular devices. A better approach is to choose a ran-dom linear path (as depicted in figure 2b), because such a path is impossible to predict and optimize, and it better exercises the inter-module communication for modular devices.
• The buffering capabilities of the DUT are not exercised, as the linear path ensures a
con-gestion free traffic pattern.
Typical approach (affordable) – snake test
Netbench - CHEP2018 Stefan Stancu 4
Tst
DUT
Tst
Tst
DUT
Tst
Tst = Tester
DUT = Device Under Test
(a) Sequential path.
Typical approach (affordable) – snake test
Netbench - CHEP2018 Stefan Stancu 4
Tst
DUT
Tst
Tst
DUT
Tst
Tst = Tester
DUT = Device Under Test
(b) Random path.
Figure 2: Snake test using commercial testers.
1Most established network testing equipment companies (e.g. [5] and [6]) produce generic network testers that
3 Netbench
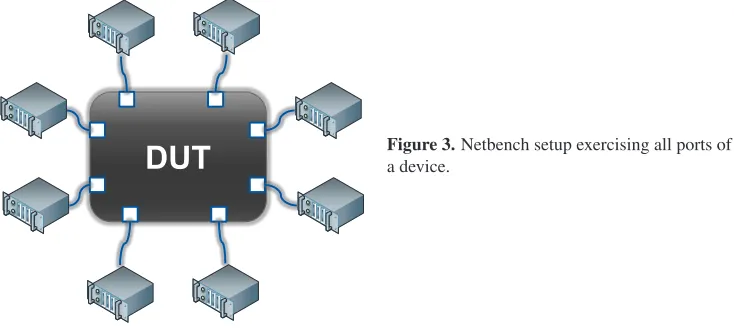
Netbench is a software platform that orchestrates traffic flow generation from multiple
com-modity servers (as illustrated in figure 3) and measures each flow’s performance.
Benchmarking a DUT using Netbench addresses some of the previously mentioned short-comings of specialized commercial testers (see Sect. 2) and offers the following advantages:
• It has a manageable cost. Since network device evaluation is typically a punctual event (e.g. a period of a few month), the servers can be time-shared between production and network tests.
• It possibly exercises all the ports of the device (the only limitation is the number of available servers)
• It can forward traffic with complex distributions (e.g. partial-mesh, full-mesh)
• It exercises the device buffering capabilities. The main traffic generation engine of
Net-bench is iperf3 with the TCP protocol, and there is no synchronization between the senders. TCP flows compete freely for bandwidth and this competition creates congestion.
One of the drawbacks of Netbench with respect to dedicated appliances is the limited rate of packet generation on servers, which prevents line-rate tests for small frames on high speed links (e.g. 40 Gigabit Ethernet). However, real-life traffic is generally composed of a mixture
of large and small frames (due to the nature of applications and protocols), so this limitation has little baring on assessing the performance of a DUT for real-life usage.
Netbench
Netbench - CHEP2018 Stefan Stancu 5
Tst = Tester
DUT = Device Under Test
DUT
Figure 3.Netbench setup exercising all ports ofa device.
In the rest of the section we will present the architecture and functionality of Netbench, as well as some sample results from the evaluation of high end routers.
3.1 Netbench architecture
As depicted in figure 4, Netbench has a layered architecture and uses standard technologies. At its core, it relies on iperf3 [4] as an engine to drive flows between servers2, but it can
easily be extended to support other traffic generators. One of the advantages of using iperf3
is that it supports both IPv4 and IPv6, so Netbench can perform tests with both IP protocol versions. The orchestration platform that sets up multiple iperf3 sessions is written in Python and relies on XML-RPC for fast provisioning of flows. Per-flow statistics are gathered into a PostgreSQL database, and the results visualisation is based on a Python REST API and a web page using JavaScript and the D3.js library for displaying graphs.
3 Netbench
Netbench is a software platform that orchestrates traffic flow generation from multiple
com-modity servers (as illustrated in figure 3) and measures each flow’s performance.
Benchmarking a DUT using Netbench addresses some of the previously mentioned short-comings of specialized commercial testers (see Sect. 2) and offers the following advantages:
• It has a manageable cost. Since network device evaluation is typically a punctual event (e.g. a period of a few month), the servers can be time-shared between production and network tests.
• It possibly exercises all the ports of the device (the only limitation is the number of available servers)
• It can forward traffic with complex distributions (e.g. partial-mesh, full-mesh)
• It exercises the device buffering capabilities. The main traffic generation engine of
Net-bench is iperf3 with the TCP protocol, and there is no synchronization between the senders. TCP flows compete freely for bandwidth and this competition creates congestion.
One of the drawbacks of Netbench with respect to dedicated appliances is the limited rate of packet generation on servers, which prevents line-rate tests for small frames on high speed links (e.g. 40 Gigabit Ethernet). However, real-life traffic is generally composed of a mixture
of large and small frames (due to the nature of applications and protocols), so this limitation has little baring on assessing the performance of a DUT for real-life usage.
Netbench
Netbench - CHEP2018 Stefan Stancu 5
Tst = Tester
DUT = Device Under Test
DUT
Figure 3.Netbench setup exercising all ports ofa device.
In the rest of the section we will present the architecture and functionality of Netbench, as well as some sample results from the evaluation of high end routers.
3.1 Netbench architecture
As depicted in figure 4, Netbench has a layered architecture and uses standard technologies. At its core, it relies on iperf3 [4] as an engine to drive flows between servers2, but it can
easily be extended to support other traffic generators. One of the advantages of using iperf3
is that it supports both IPv4 and IPv6, so Netbench can perform tests with both IP protocol versions. The orchestration platform that sets up multiple iperf3 sessions is written in Python and relies on XML-RPC for fast provisioning of flows. Per-flow statistics are gathered into a PostgreSQL database, and the results visualisation is based on a Python REST API and a web page using JavaScript and the D3.js library for displaying graphs.
2Currently Netbench uses TCP, but it is possible to adapt the tool for using other protocols supported by iperf3.
Netbench - CHEP2018 Stefan Stancu 6
DUT
AgentCentral XML-RPC
PSQL
Traffic statistics
iperf3
Web server {REST}
DUT = Device Under Test
Figure 4: Netbench architecture.
Statistics are presented at different levels of detail allowing the human operator to quickly
assess the overall state of a test. Figure 5 illustrates the available statistics for a full-mesh test with 64 nodes:
Flow count difference For each of the nodes taking part in the test we plot the difference
between the number of flows that we expect to see on the node, and the number of flows recorded in the statistics database. For a test that is running successfully, the values for all nodes should be 0 (as illustrated in figure 5a3).
Per-node total bandwidth For each of the nodes, we plot the total transmit (Tx) and re-ceive (Rx) bandwidth. For a full-mesh test, and a DUT that handles flows in a fair manner, the total TX and RX bandwidth should be flat for all nodes (as illustrated in figure 5b3).
Per-node flow bandwidth For each of the nodes, we compute the per-flow average band-width and standard-deviation for all the flows that are transmitted (Tx) or received (Rx) by the node. For a full-mesh test, and a DUT that handles flows in a fair manner, the mean bandwidth should be flat, and the standard deviation should be small. The results depicted in figure 5c3,4, show a deviation from this behaviour for a node that has a much higher standard
deviation than the others.
Per-pair flow bandwidth A heat map for the bandwidth between each source and desti-nation allows us to gain more insight into the behaviour of the device. For the sample test results, the heat map illustrated in figure 5d5 clearly shows the origin of the previously
ob-served abnormally high standard deviation: for the respective node, one flow uses much more bandwidth than all the others. Netbench is capable of instantiating multiple flows between each sender and destination. For such cases, a similar heat map is used to display the standard deviation of the flows for each source-destination pair.
3For each node there are two bars with different colors, one for Tx (transmit), one for Rx (receive).
4The standard deviation of a flow is represented as a red vertical line, superposed over the bar representing the
average bandwidth of the respective flow.
5The average bandwidth of all flows between a given source and destination is colour-coded. The color bar at
Netbench - CHEP2018 Stefan Stancu 7
Fl
ows
Nodes
(a) Per-node flow count difference.
Netbench - CHEP2018 Stefan Stancu 8
Nodes
Bandwidth [
Gbit
/s]
(b) Per-node total bandwidth.
Netbench - CHEP2018 Stefan Stancu 9
Bandw
idt
h [
Gb
it/s]
Nodes
(c) Per-node flow bandwidth (average and stdev).
Netbench - CHEP2018 Stefan Stancu 10
Dest
in
ati
on
Source
(d) Per-pair bandwidth heat map.
Figure 5: Netbench statistics plots with various level of detail.
3.2 Netbench sample results
During its last call for tender for high-end routers, CERN has employed Netbench6for eval-uating the behaviour of network devices when handling full and partial meshed TCP traffic.
In this section we will present a sample result for a full-mesh test, that reveals Netbench’s capability to create temporary congestion and exercise the buffering capabilities of network
devices.
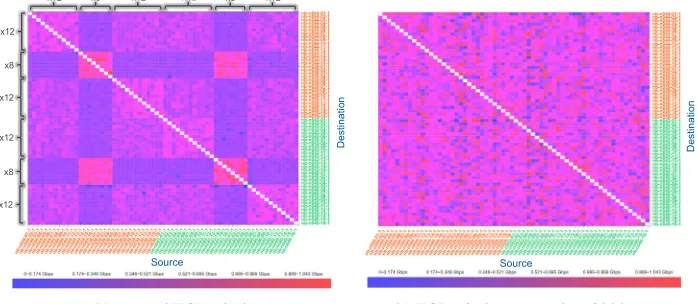
Figure 6a shows the results when running Netbench with TCP flows with an uncapped TCP window. It clearly shows two classes of behaviour. After interaction with the manu-facturer, this was traced down to the internal architecture of the device and an uneven dis-tribution of ports over internal modules (some modules had 12 tester ports connected, while others hand only 8 tester ports connected). The under-populated modules had more per-flow buffering capacity for inter-module transfers, compared to the fully-populated modules.
Big-ger buffers directly translate to a larger TCP round-trip time (RTT), and this results in less
bandwidth for the flows (this is a know behaviour of most TCP congestion algorithms, and the measure of bandwidth imbalance as function of RTT is denoted as “RTT fairness”).
Netbench with free running TCP window is practically emulating a large number of ele-phant flows. In practice, most flows are short lived and typically involve a series of
Netbench - CHEP2018 Stefan Stancu 7
Fl
ows
Nodes
(a) Per-node flow count difference.
Netbench - CHEP2018 Stefan Stancu 8
Nodes
Bandwidth [
Gbit
/s]
(b) Per-node total bandwidth.
Netbench - CHEP2018 Stefan Stancu 9
Bandw idt h [ Gb it/s] Nodes
(c) Per-node flow bandwidth (average and stdev).
Netbench - CHEP2018 Stefan Stancu 10
Dest
in
ati
on
Source
(d) Per-pair bandwidth heat map.
Figure 5: Netbench statistics plots with various level of detail.
3.2 Netbench sample results
During its last call for tender for high-end routers, CERN has employed Netbench6for
eval-uating the behaviour of network devices when handling full and partial meshed TCP traffic.
In this section we will present a sample result for a full-mesh test, that reveals Netbench’s capability to create temporary congestion and exercise the buffering capabilities of network
devices.
Figure 6a shows the results when running Netbench with TCP flows with an uncapped TCP window. It clearly shows two classes of behaviour. After interaction with the manu-facturer, this was traced down to the internal architecture of the device and an uneven dis-tribution of ports over internal modules (some modules had 12 tester ports connected, while others hand only 8 tester ports connected). The under-populated modules had more per-flow buffering capacity for inter-module transfers, compared to the fully-populated modules.
Big-ger buffers directly translate to a larger TCP round-trip time (RTT), and this results in less
bandwidth for the flows (this is a know behaviour of most TCP congestion algorithms, and the measure of bandwidth imbalance as function of RTT is denoted as “RTT fairness”).
Netbench with free running TCP window is practically emulating a large number of ele-phant flows. In practice, most flows are short lived and typically involve a series of
transac-6The setup comprised 64 servers equipped with 40 Gigabit Ethernet NICs
tions. To emulate such real-life traffic patterns we capped the TCP window size7, and thus
limited the amount of data transiting in the network. In these more realistic test conditions all flows received a fair share of the available bandwidth, as illustrated in figure 6b.
Netbench - CHEP2018 Stefan Stancu 11 DUT = Device Under Test
Dest in ati on Source x12 x12 x12 x12 x8 x8
x12 x8 x12 x12 x8 x12
(a) Uncapped TCP window.
Netbench - CHEP2018 Stefan Stancu 12
Destination
Source
(b) TCP window capped to 64 kbyte.
Figure 6: Sample Netbench results from a full-mesh test.
4 Conclusion
We have developed Netbench, a tool that allows provisioning multiple TCP flows with various traffic distributions (pairs, partial and full-mesh). Table 1 summarizes Netbench’s features in
comparison to specialized commercial testers, and highlights its unique abilities (e.g. the potential to create large scale congestion and exercise the device buffering capabilities).
Table 1: Feature comparison between Netbench and specialized network testers.
Feature Full test(specialized testers) Snake test(specialized testers) Netbench
Line-rate test yes yes partial∗
Packet-size scan yes yes no
Complex traffic patterns
(full or partial mesh) yes no yes Create congestion
(exercise buffering) no no yes
Cost for a large scale test high affordable affordable∗∗
∗ Only for large frames
∗∗Assuming a time-shared usage of servers between production and network testing.
As detailed in Sect. 3.1, currently Netbench supports the orchestration of TCP flows and measures their bandwidth. Future work for enhancing Netbench should aim at measuring the
latency between the nodes (e.g. using ping probes) and at supporting other protocols (e.g. UDP).
To summarize, we consider Netbench an essential complement to synthetic RFC tests [1, 2] performed with specialized commercial testers, as it enables affordable, large-scale
testing of network devices with traffic patterns that closely resemble real-life conditions.
References
[1] S. Bradner, M. J.,Benchmarking Methodology for Network Interconnect Devices, RFC 2544
[2] R. Mandeville, P. J.,Benchmarking Methodology for LAN Switching Devices, RFC 2889 [3] R. Mandeville,Benchmarking Terminology for LAN Switching Devices, RFC 2285 [4] iperf3,http://software.es.net/iperf
[5] ixia,https://www.ixiacom.com/
[6] spirent,https://www.spirent.com/