Responses of
Game and Nongame Wildlife
to Predator Control in South Texas
FRED S. GUTHERY AND SAMUEL L. BEASOM
Highlight: One hundred thirty-two coyotes, 27 opossums, 22 skunks, 18 bobcats, 15 raccoons, 12 badgers, and one gray fox were killed on a 1,550-ha area of mixed brush rangeland in South Texas during January-July 1975 and 1976 to determine the re- sponses of herbivore and quail populations to predator control. When compared to an area without predator control, predator removal at this level had little discernible ef- fect on density trends of bobwhite or scaled quail, rodents, or lagomorphs. However, fawn production per unit area was 70% greater in 1975 on the area with predator con- trol and 43% greater in 1976. These data suggest that intensive short-term predator control on South Texas rangeland results in little or no adverse impact on range forage due to expanding populations of small herbivores. Productivity and popu- lations of white-tailed deer may increase and harvests should be adjusted accordingly, as overuse of range forage could occur.
Several studies have evaluated the efficacy of predator control in in- creasing the harvestable surplus of game animals (Beasom 1977), but few have concurrently followed the popu- lation responses of nongame wildlife. The possibility that predator control could release rodent or lagomorph populations causes concern because of the range management implications. Rodents can maintain less desirable seral states (Norris 1950), remove up to one-third of annual forage production (Fitch and Bentley 1949), and retard weight gain in cattle by forage competi- tion (Howard et al. 1959). The diet of black-tailed jackrabbits (Lepus cali- fornicus) approximates that of sheep on salt-desert shrub ranges in Utah, and 5.8 jackrabbits consume or waste as much forage as one sheep in the spring
Authors are assistant professor of wildlife manage- ment, Texas Tech University, and associate professor, Department of Wildlife and Fisheries Sciences, Texas A&M University, College Station 77843.
The study was supported by the Caesar Kleberg Res. Progam in Wildl. Ecol. and the Texas Agricultural Experiment Station. The authors wish to acknowledge J. Williams, R. Fox, and D. Nobles, who aided in field work; M. Ray, who provided deer density and production data; Mr. and Mrs. J. Lee, who granted permission to conduct the study on their ranch; and Drs. C. J. Scifres and W. E. Grant who critically reviewed the manuscript.
The report is published with approval of the Director, Texas Agr. Exp. Sta., as TA 13290.
Manuscript received April 5, 1977.
404
(Currie and Goodwin 1966). About 260 black-tailed or 164 antelope jackrabbits (L. alleni) consume enough forage to feed one cow in the Southwest (Arnold
1942).
Beasom ( 1974) found that intensive generalized predator control enhanced reproductive success of white-tailed deer (Odocoileus virginianus) and wild turkey (Meleagris gallopavo) with no apparent effects on rodent or lago- morph numbers in South Texas. Re- moval of small mammalian predators from experimental areas in South Dakota resulted in large increases in pheasant (Phasianus colchicus) popu- lations, with concurrent moderate increases in jackrabbit and cottontail (SylvilagusJZoridanus) populations and slight increases in rodent populations (Trautman et al. 1974). To our know- ledge, these are the only studies published that have quantitatively monitored the responses of both game and nongame prey to predator control.
The present data resulted from a study to determine the efficacy of predator control in reducing predation on Angora goats. This paper discusses the responses of white-tailed deer, bob- white quail (Colinus virginianus), scaled quail (Callipepla squamata), lagomorph, and rodent populations to that predator control.
Study Area
The study was conducted in northern Zavala County, Tex., in the South Texas Plains vegetation region (Gould 1975). Climate of this region is mild. The average annual rainfall (55 cm) is highly erratic yearly and monthly. From August 1974 through June 1975, the study area received about 9 1.5 cm of rain, and the vegetation responded with lush growth. From August 1975 through June 1976, rainfall totalled 24.8 cm and vegetation growth was retarded, especially during November 1975 through March 1976, when less than 4 cm of rain fell.
Three soil types supported three relative- ly distinct plant communities on the study area. Fertile clay loams occupied flat lowland sites and supported dense stands of whitebrush (Aloysia lycioides). Principal grasses were pink pappus (Pappophorum bicolor) and bristlegrasses (Setaria spp.) on moister areas and common curly- mesquite (Hilaria belangeri) and buffalo- grass (Buchloe dactyloides) on drier areas. lowlands graded into relatively level red
sandy loams where honey mesquite
(Prosopis glandulosa), spiny hackberry (Ceftis pallida), and blackbrush acacia (Acacia rigid&a) occurred in low to moderate densities. Threeawns (Aristida spp.) and red grama (Bouteloua trifda) were important grasses; forbs were sparse. Gravelly ridges with usually moderate slopes and shallow sandy loams were interspersed with the other soil types. These ridges supported dense stands of guajillo (Acacia berlandieri) and black- brush acacia and a sparse ground cover of threeawns and red grama.
Materials and Methods The project was designed and executed such that predator removal was the major source of variation influencing results. Sampling was conducted concurrently, when possible, on two experimental areas. Density trends of wildlife were compared between a 225-ha treated (predator control) and a 20 l-ha untreated (no predator control) pasture (Fig. 1).
Mammalian predators were killed in a 1,550-ha area, which included the treated
Fig. 1. The study area in Zavala County, Tex.
pasture and a 1.6-km buffer zone on three sides of it. Steel traps, snares, and M-44’s were deployed at an average intensity of
165 device days/km’/month, where a
device day is one device operative for 24 hours. Also, 1.55 hours of helicopter gunning and 6.2 hours of predator calling were done. Guthery and Beasom (1977) detailed the predator control effort.
Densities of deer, quail, and lago- morphs were estimated with strip census formulas of the King type (Leopold 1933) for comparisons between treatments. Per- manent linear transects 0.32 km apart were established in the two pastures and flagged with surveyor’s tape. The north-south transects included four 1.8 km long in the untreated pasture and five 1.6 km long in the treated pasture. Counts started at about sunrise and at 2 to 3 hours before sunset. Each transect was walked four times per month. The number, radial flushing dis- tance, and flushing angle were recorded for each individual or group flushed. Distances were paced to the nearest meter, except for long observations of deer where it was estimated visually to the nearest 5 m. Separate analysis (Guthery 1977b) indi- cated the harmonic mean of radial distances (Hayne 1949) was an acceptable measure of effective transect width for deer and quail, though it likely resulted in underestimates of density. The mode of radial distances was used for cottontails. The harmonic means were stratified by month; this refinement was considered unnecessary for cottontails as there was little seasonal variation in their sighting distance.
Density and fawn:doe ratios of white- tailed deer were determined by helicopter censuses conducted by the Texas Parks and Wildlife Department in October of each year. Systematic flights over about 90% of the study area were designed to give total counts. These data were used to compare deer population response to predator con- trol between a five-pasture block (2,016 ha) that received no treatment and a 698-ha area that received treatment (Fig. I), because the helicopter censuses were not stratified by individual pastures during both years.
An upland site dominated by blackbrush acacia and guajillo and a lowland site dominated by whitebrush were selected in each pasture to monitor rodent populations. One hundred Sherman live traps, baited with grains, were placed at 15.2-m inter- vals in a 10 by 10 grid and run for five consecutive days each month of the study period in 1975 and 4 days in 1976. Rodents were marked individually by clipping one or two toes; population size was estimated with the Schumacher-Eschmeyer formula (Overton and Davis 1969). Area trapped was determined by adding the average distance moved between captures to the periphery of the grid (Brant 1962). Because this distance was roughly 30 m for all species (Guthery 1977a), the area trapped was 3.9 ha in each grid.
Jolly (1965:226) derived a method for calculating the “probability that an animal alive at the moment of release of the ith sample will survive till the time of capture of the i + 1 st sample (emigration and death being synonymous for this purpose).” To calculate this probability, we considered a monthly trapping period (five days in 1975, four in 1976) as time i; data for all species were pooled.
Modified life table analyses were con- ducted to compare the mortality of cotton rats (Sigmodon hispidus) and woodrats (Neotoma micropus) between the untreated and treated pastures. Artificial cohorts were created by assigning individuals trapped in February the age of zero. These “cohorts” were comprised, for a given pasture, of animals trapped in both grids during both years to obtain larger samples. Survival was based on trapping records in sub- sequent months.
Woodrat densities were estimated by
spring and summer den counts along the wildlife census transects described earlier. The right-angle distance to dens was paced to the nearest meter, and density was estimated by Leopold et al.‘s (195 1) formula. Dens were considered active if fresh droppings were nearby, if trails were well defined, if cobwebs were absent from
JOURNAL OF RANGE MANAGEMENT 30(6), November 1977 405
entrances, and/or if there was other evidence of recent use. One adult woodrat per active den (Raun 1966) was assumed.
Results and Discussion Predator Control
The confirmed kill of coyotes and bobcats (Table 1) apparently reduced the density of these predators to about 0.4 to 0.8/km”, whereas their density was about 2.O/km” on untreated por- tions of the study area (Guthery I977a). Guthery speculated that the small kill of badgers (Taxidea tuxus) and gray foxes (Urocyon cinereoargenteus) sub- stantially reduced their numbers be- cause few occurred on the study area. He further noted, based on qualitative appraisal of the abundance of their sign, that raccoon (Procyon lotor) and skunk (Mephitis mephitis) populations were perhaps reduced by 40 to 60% on the treated area. The fairly large kill of opossums (Didelphis marsupialis) did not appear to depress their numbers markedly.
Table 1. Mammalian predators killed on a 1,550-ha area, Zavala County, Tex.
Species Coyote Bobcat Raccoon Striped skunk Badger Opossum Gray fox
Number killed
1975 1976
69 63
11 7
10 5
11 11
7 5
24 3
0 1
White-tailed Deer Responses
Although slightly higher in the untreated pasture, deer numbers were roughly equal in the experimental pastures prior to treatment in August
1974 (Table 2). Fawn:doe ratios were 0.38 (untreated) and 0.48 (treated). The observed number of fawns and does, cross-classed with pastures, indi- cated homogeneity (P > 0.05), however.
Response of the deer population to predator control, which began in Janu-
Table 2. Densities of adult deer on untreated (no predator control) and treated portions of the study area, Zavala County, Tex.
Time Aug. 1974 Jan. 1975 Oct. 1975 Oct. 1976
Number/40 ha Untreated Treated
5.8 5.0
5.6 5.0
4.9 6.5
ary 1975, was confounded by human disturbance adjacent to the untreated pasture. Density of this pasture ap- parently declined by about 80% in February (Fig. 2), coinciding with exploratory oil drilling about 2 km from the pasture. Traffic of large trucks on a bordering road was heavy both day and night during this operation. After drilling activities subsided, deer num- bers never attained pre-experiment levels in the untreated pasture.
Hood and Inglis ( 1974) noted the response of white-tailed deer to dis- turbance associated with intensive cattle roundups in a similar South Texas brushland habitat. They found the main response to be within areas of disturbance rather than between dis- turbed and relatively undisturbed areas. Rarely did they observe an abandon- ment of the fidelity for an individual’s home range as was indicated in the present study.
An alteration of the flushing be- havior of the deer in this study also may have influenced the calculated density in the untreated pasture. The average radial flushing distance of deer in this pasture in February increased by 50% over January levels. In dense brush such as occurred on the study area, increased flightiness of deer probably would result in underestimates of density. This would occur because the probability of sighting a deer decreases dramatically with increasing distance from the observer in brushy habitat, where even under average conditions strip censuses may yield underestimates of density because of failure to detect animals (Guthery 1977b). The average radial flushing distance in the treated pasture, con- versely, decreased by 20% from Janu- ary to February in 1975. Regardless of the response of the deer to disturbance near the untreated pasture, the heli- copter censuses indicated the density of the five-pasture block, including the untreated pasture (Fig. 1
),
remained relatively stable during the study (Table 2).The October 1975 fawn:doe ratio of 0.72 in the treated area was approxi- mately 29% greater than that on the untreated area, whereas in October
1976 that on the treated area was about 6% lower than the 0.32 value on the untreated area. Although the age-ratio data indicated little difference in fawn production between areas in 1976, the number of fawns produced per unit area
406
00
40
- COTTONTAILS
I’\ ,
/ ’ /’ /I ‘4
JfMAMJJ 10
t
WHITE-TAILED DEER 5
t - \ \
JFMAMJJ 0
q 150
QL BOB WHITE QUAIL is
z
2
10050
L
I
01 I I I I I I I
J F MAMJ J
JFMAMJJ FMAMJJ
1975 MONTH 1976
1 I I I I 1
FMAMJ J
F M A M J J
_-em Untreated
_ Treated
Fig. 2. Density trends of cottontails, deer, and quails on the untreated (no predator control) and treated pastures, Zuvala County, Tex.
was approximately 70 and 43% greater on the treated area in 1975 and 1976, respectively.
In addition, equal fawn:doe ratios under different deer densities may indicate a positive response to predator control. In central Texas Teer et al. ( 1965) found that fawn production varied inversely with adult density. If this relationship held in our South Texas area the fawn:doe ratio in the treated area should have been lower because of the roughly 25% greater density. Clearly, age ratios, when interpreted without density estimates, may be an incomplete and sometimes misleading measure of the effects of predator control on game production.
The difference in density df fawns on the experimental areas was a reflection of total numbers of adult does. These
JOURNA
females increased on both areas from 1975 to 1976. However, the increase was markedly greater on the treated area (24% above the 5.23 does/40 ha on the treated area compared to 9% above the 3.92 does/40 ha on the untreated area).
Similarly, total numbers of adult deer increased throughout the study period on the treated area and remained relatively stable on the untreated area (Table 2). These data suggest that the approximately 80% reduction in coyote and bobcat activity on the treated area (Guthery and Beasom 1977) resulted in an increased survival of young and/or adult deer and a subsequent increase in the population. That this increase had not become asymptotic was suggested by similar loss rates (1.6/40 ha) in the treated and untreated pastures associ-
ated with drought conditions prevailing from November 1975 through March
1976. Most of the carcasses located were too old for unequivocal ascription of cause of death. Two carcasses were assigned to a predator-killed category and several others showed circum- stantial evidence of predation, but predation may have represented only proximate mortality, the ultimate agent being nutritional stress. Because deer density was higher, nutrition-induced losses also should have been higher in the treated pasture. The fact that they were not suggests the reduction in predator activity ameliorated, to some extent, total over-winter deer losses on the treated pasture. It is unlikely that this condition could be perpetuated, and the harvest rate of deer in the treated area likely should be increased to prevent the classical habitat destruc- tion associated with unchecked un- gulate populations.
Quail Responses
Pi-e-experiment populations of scaled and bobwhite quail apparently were higher on the untreated pasture (Table 3). This condition held from January through April 1975, with
Table 3. Pre-experiment density indices based on 33.6 and 35.2 km of walking transect in the untreated (no predator con- trol) and treated pastures, respectively, in August 1974, Zavafa County, Tex.
Species Cottontail Bobwhite quail Scaled quail
Number/km Untreated Treated
1.04 0.37
6.07 3.32
0.89 0.51
bobwhite densities equalizing in May and scaled quail densities equalizing in January (Fig. 2). Thus the influence of inversity (Errington 1934) on compara- tive productivity was minimized or cancelled. Reproductive success of bobwhites was excellent in 1975 as density was calculated at over 100/40 ha in July. Scaled quail density trends were similar in the experimental pastures, subject to the inherent variability of counts of flocking spe- cies. Both density and productivity of scaled quail were below that of bob- whites.
Whereas little, if any, quail hunting was done on the study area in 1975, it was leased and hunting pressure in- creased in 1976. It seems unlikely, however, that hunting was solely
responsible for a decline in density of about 80% from February of the preceding year (Fig. 2). The droughty period from November 1975 through February 1976 probably played some role in this reduction. Reproductive success of both scaled and bobwhite quail was meager in 1976, as July densities were about 25 and 6/40 ha, respectively. Thus quail populations followed the boom-and-bust cycle typi- cal in South Texas (Lehmann 1953) during the two seasons of study.
The data indicate intensive predator control had but slight influence on quail populations. If there was any effect, it was that the treatment enabled popu- lations on poorer habitat to maintain roughly equivalent numbers with those on better habitat. That the untreated pasture provided better habitat is sup- ported by pre-experiment abundance (Table 3) and by subjective opinion. Similarly, Lehmann ( 1946) and Beasom ( 1974) found no significant difference in bobwhite populations or productivity due to predator control in South Texas.
Lagomorph Responses
Pre-experiment cottontail numbers were two to three times higher on the untreated than on the treated pasture (Table 3). This condition held in January 1975 when predator control began. Cottontail densities subsequent- ly increased at rates of 8.43 and 5.04/40 ha/month on the untreated and treated pastures, respectively, during
1975. These significantly different (P < 0.05) rates are a reversal of the expected condition if predator control
is presumed to release cottontail popu- lations.
Cottontail densities apparently were similar on the two pastures in February
1976 (Fig. 2). Subsequently, densities declined at rates of 3.97 and 4.97/40 ha/month in the untreated and treated pastures, respectively, during 1976. These rates were similar (P > 0.05).
Because pre-experiment densities were unequal in the two pastures (Table 3), at a time when predator pressure presumably was equal, ecological factors other than mammalian preda- tion probably played a role in observed density trends. This lack of homogenei- ty confounds an analysis of predation’s effects on cottontail populations. However, an apparent correlation (P < 0.10) between monthly densities in the experimental pastures suggests that density, though governed by factors common to the two pastures, fluctuated independent of two levels of predator abundance. Clearly, cottontail popu- lations in the treated pasture showed no irruptive tendencies under the con- ditions obtaining in this study.
Jackrabbit densities never exceeded 2/40 ha on either experimental pasture, probably because the study area provided unsuitable habitat.
Although predation may account for a substantial proportion of annual lagomorph mortality (Trent 1972; Wagner and Stoddart 1972), it by no means follows that predation controls lagomorph populations, or that de- creased predation would release lago- morph populations. Because lago- morph fecundity greatly exceeds that of
Table 4. Life table analysis of cotton rats and woodrats in the untreated (no predator control) and treated pastures, during February-July 1975 and 1976, Zavala County, Tex. Animals trapped in February were given an artificial age of zero and survival was based on monthly trapping records.
Artificial age Untreated Treated
(months) 1X dx qx ,x1 ‘X dx qx ex
Cotton rat
0 1,000 478 0.478 1.49 1,000 167 0.167 2.14
1 522 283 0.542 1.41 833 403 0.484 1.47
2 239 130 0.552 1.47 430 236 0.549 1.37
3 109 29 0.266 1.64 194 69 0.356 1.44
4 80 37 0.460 1.05 125 69 0.552 0.95
5+ 43 43 1.000 0.50 56 56 1.000 0.50
Woodrat
0 1,000 636 0.636 1.77 1 ,ooo 412 0.412 1.85
1 364 92 0.253 2.99 588 294 0.500 1.80
2 272 45 0.165 2.84 294 59 0.201 2.10
3 227 0 0.000 2.30 235 117 0.497 1.51
4 227 45 0.198 1.30 118 0 0.000 1.50
5+ 182 182 1.000 0.50 118 118 1.000 0.50
’ I,= number of animals alive at start of age interval; dx = number dying during age interval; qx = rate of mortality during age interval; and ex = mean expectation of life (months) for animals alive at start of age interval.
most mammalian predators, and be- cause limits on predator numbers are imposed, to some extent, by energy available at the secondary consumer trophic level, hare and rabbit numbers apparently may wax and wane irres- pective of predation. Such has been the case, with few qualifications, for jack- rabbits in Utah (Wagner and Stoddart 1972) and snowshoe hares (Lepus americanus) in Alberta (Keith 1974). Considering the diverse predator fauna in South Texas, which includes reptiles, birds, and mammals, it is apparent that the predator control in this study removed only a segment of potential lagomorph predators. The remaining predators, being freed from a certain amount of competition for food, could increase in numbers and compensate decreased predation rates caused by predator control. Breeding efforts of great-homed owls (Bubo virginianus), for example, are en- hanced by rising food supplies (Rusch et al. 1972), and populations of other rapacious mammals apparently in- crease in response to coyote control (Robinson 1961). Such ecological ad- justments have been largely overlooked by those concerned about the environ- mental effects of predator control (e.g. Cain et al. 1972).
Rodent Responses
Infrequent captures of pygmy mice (Baiomys taylori), harvest mice (Reithrodontymys fulvescens), deer mice (Peromyscus spp.), grasshopper mice (Onychomys leucogaster), pocket mice (Perognathus hispidus), and ground squirrels (Citellus mexicanus) made monthly estimates of their popu- lations infeasible. To avoid losing these observations, we based the mark- recapture estimates (Fig. 3) on all species. The observed density trends largely reflect the abundance of cotton rats because they represented, aver- aging over 2 years, 52 to 85% of the catch in any grid. Woodrats, deer mice, and harvest mice were, in descending order, the next most abundant species. Other species accounted for about 3% of the catch.
In 1975 cotton rats apparently ir- rupted on the untreated whitebrush grid, achieving a peak density in July of about 1,700/40 ha (Fig. 3). Overall rodent density decreased on the treated whitebrush grid from January through May 1975. This decline was due partially to high trap mortality of harvest mice during January and Febru-
408
ary , when they comprised 34 and 18%, respectively, of the catch in this grid. Numbers of all species except wood- rats declined in 1976. Deer, harvest, grasshopper, pygmy, and pocket mice virtually disappeared from the catch. Combined numbers of cotton rats and woodrats accounted for 91 to 95% of the monthly catch.
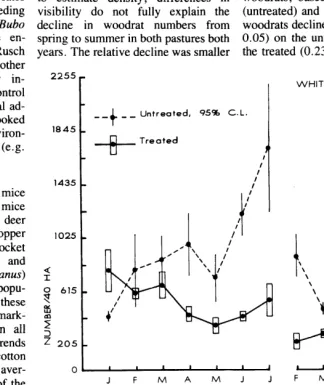
Spring and summer counts in 1975 indicated 252 and 192 woodrat dens/40 ha, respectively, on the untreated pasture. Respective figures for the treated pasture were 2 12 and 204. In 1976 these counts indicated 368 and 160/40 ha, respectively, on the un- treated pasture. Respective figures for the treated pasture were 452 and 288. Because the mean perpendicular dis- tance to dens was stratified by seasons to estimate density, differences in visibility do not fully explain the decline in woodrat numbers from spring to summer in both pastures both years. The relative decline was smaller
2255
1845
1435
1025
0 I __
+
__ Untreated, 95% C.L.
-%- Treated
in the treated pasture both years. The mean probability of an individu- al rodent surviving from one month to the next, calculated over the two treat- ments and years, was 0.57 2 0.035. Whereas this probability was lower in the drier conditions of 1976 (P < 0.05)) it apparently was unaffected by preda- tor control (P > 0.25).
Monthly mortality rates and ex- pected survival of cotton rats were similar in both pastures (Table 4), based on “cohorts” of 138 (untreated) and 72 (treated). Letting y=log(lx), the monthly rates of decline of 0.29 (untreated) and 0.24 (treated) were similar
(P
>
O.OS), indicating no dis- cernible effect of predator control on cotton rat survival.Similar regression analysis for woodrats, based on “cohorts” of
22
(untreated) and 17 (treated), indicated woodrats declined at a lower rate(P
<
0.05) on the untreated (0.16) than on the treated (0.23) pasture. These ratesI’
I I
I 1 I I I I 4
JFMAMJJ
0111”‘”
JFMAMJJ
WHITEBRUSH SITES
F M A M J J BLACKBRUSH SITES
n
FMAMJJ
1975 MONTH 1976
Fig. 3. Density trends of combined rodent populations on the untreated (no predator control) and treated pastures, Zuvala County, Tex.
are a reversal of the expected condition if predator control is presumed to enhance woodrat survival.
No irruptive tendency of rodent populations in response to mammalian predator control was demonstrated. It therefore follows that intensive short- term predator control in South Texas would not result in adverse impact to range forage due to expanding numbers of rodents.
The present findings support results of Beasom ( 1974) and Trautman et al. (1974), who also recorded little or no response of rodent populations to predator control. Schnell ( 1968), how- ever, felt that diverse and highly mobile avian and mammalian predators were more important regulators of cotton rat density than food, weather, or social interactions. He was working with non- breeding cotton rats, and while he may have demonstrated that predation is responsible for most mortality, his conclusions about its population regu- lating effects may well be spurious. Pearson ( 1964) reported that mammali- an predators nearly annihilated a vole (Microtus sp.) population in California. However, because house cats were an important component of the predator fauna, suggesting predator density was artificially high, his findings may be valid only under such specialized circumstances.
The present data suggest a possible inversely density-dependent effect (Keith 1974) of predation on rodent populations, assuming that predation on a population is roughly proportional to the number of predators acting on that population. In 1975, a year with plentiful rainfall and good production of grasses and forbs, rodent densities were higher on the untreated grids (Fig. 3). The droughty period from Novem- ber 1975 to March 1976 probably contributed to decreased rodent densi- ties in 1976 by retarding growth of vegetation. The relative decrease was greater in the untreated grids because
the lowest densities were roughly equal in both pastures in 1976. Thus it may be hypothesized that predation caused a greater decline in rodent densities than would be expected under a lower level or absence of predation. Furthermore, predation had possible effect only on declining and relatively low rodent numbers, i.e. it was inversely density- dependent.
Literature Cited
Arnold, J. F. 1942. Forage consumption and preferences of experimentally fed Arizona and antelope jack rabbits. Arizona Exp. Sta. Tech. Bull. 98.
Beasom, S. L. 1974. Intensive short-term predator removal as a game management tool. Trans. N. Amer. Wildl. Nat. Resour. Conf. 39:230-240.
Beasom, S. L. 1977. The value of predator control in game production. J. Anim. Sci. (in press).
Brant, D. H. 1962. Measures of the movements and population densities of small rodents. Univ. California Pub. Zoo. 62:105-184. Cain, S. A., Chairman. Predator controi- 1971. Institute for Environmental Quality, Univ. of Michigan, Ann Arbor. 207 p. Currie, P.O., and D. L. Goodwin. 1966. Con- sumption of forage by black-tailed iackrabbits on salt-desert ranges in Utah. J. Wildl. Manage. 30:304-3 11.
Errington, P. L. 1934. Vulnerability of bob- white populations to predation. Ecology 15: 110-127.
Fitch, H. S., and J. R. Bentley. 1949. Use of California annual-plant forage by range rodents. Ecology 30:286-287.
Gould, F. W. 1975. Texas plants-a checklist and ecological summary. Texas Agr. Exp. Sta. Misc. Pub. 585 (Rev.). 121 p,
Guthery, F. S. 1977a. Efficacy and ecological effects of predator control in South Texas. PhD Thesis. Texas A&M Univ. 50 p.
Guthery, F. S. 1977b. Evaluation of measures of transect width for strip census in brushland. Unpub. ms. 17 p. (typewritten).
Guthery, F. S., and S. L. Beasom. 1977. Effec- tiveness, selectivity, and population impacts of predator control with traps, snares, and M-44’s. Unpub. ms. 15 p. (typewritten). Hayne, D. W. 1949. An examination of the strip
census method for estimating animal popula- tions. J. Wild]. Manage. 13:145-157. Hood, R. E., and J. M. IngIis. 1974. Behavior-
al responses of white-tailed deer to intensive ranching operations. J. Wildl. Manage. 38: 488-498.
Howard, W. E., K. A. Wagnon, and J. R. Bentley. 1959. Competition between ground squirrels and cattle for range forage. J. Range Manage. 12:110-l 15.
Jolly, G. M. 1965. Explicit estimates from capture-recapture data with both death and im- migration-stochastic model. Biometrika 52: 225-247.
Keith, L. B. 1974. Some features of populations dynamics in mammals. Proc. Int. Congr. Game Bio. 11:17-58.
Lehmann, V. W. 1946. Bobwhite quail repro- duction in southwestern Texas. J. Wildl. Manage. 10: 11 l-123.
Lehmann, V. W. 1953. Bobwhite population fluctuations and vitamina A. Trans. N. Amer. Wildl. Conf. 18:199-246.
Leopold, A. 1933. Game management. Charles Scribners Sons, New York. 481 p. Norris, J. J. 1950. Effect of rodents, rabbits, and
cattle on two vegetation types in semidesert rangeland. New Mexico Agr. Exp. Sta. Bull. 353. 23 p.
Overton, W. S., and D. E. Davis. 1969. Esti- mating the numbers of animals in wildlife populations. In: Wildlife Management Tech- niques. R. H. Giles (Ed.). Wildlife Society, Washington, D.C. p. 403-455.
Pearson, 0. P. 1964. Carnivore-mouse preda- tion: an example of its intensity and bio- energetics. J. Mammal. 45:177-188. Raun, G. R. 1966. A population of woodrats
(Neoroma micropus) in southern Texas. Bull. Texas Memorial Mus. 11. 62 p.
Robinson, W. B. 1961. Population changes of carnivores in some coyote control areas. J. Mammal. 42:510-515.
Rusch, D. H., E. C. Meslow, P. D. Doerr, and L. B. Keith. 1972. Response of great-homed owl populations to changing prey densities. J. Wildl. Manage. 36:282-296.
Schnell, J. H. 1968. The limiting effects of predation on experimental cotton rat popu- lations. J. Wildl. Manage. 32:698-7 11. Teer, J. G., J. W. Thomas, and E. A. Walker.
1965. Ecology and management of white- tailed deer in the Llano Basin of Texas. Wildl. Monogr. No. 15. 62 p.
Trautman, C. G., L. F. Frederickson, and A. V. Carter. 1974. Relationship of red foxes and other predators to populations of ring- necked pheasants and other prey, South Dakota. Trans. N. Amer. Wildl. Nat. Resour. Conf. 39:241-252.
Trent, T. T. 1972. Home range and survival of cottontail rabbits in southwestern Wisconsin. MS Thesis. Univ. of Wisconsin, Madison. 45 p.
Wagner, F. H., and L. C. Stoddart. 1972. In- fluence of coyote predation on black-tailed jackrabbit populations in Utah. J. Wildl.
Manage. 36:329-342.
Individual Sustaining Members
We regret our inadvertent omission of the following members from the list of Individual Sustaining Members published in the September 1977 Journal of Range Management:
Robert S. Campbell John D. Freeman
Species Adapted for Planting Arizona Pinyon-
Juniper Woodland
FRED LAVIN AND T. N. JOHNSEN, JR.
Highlight: Species adaptation trials were observed over periods varying from 21 to 28 years at ten Arizona pinyon-juniper sites. Fifty-nine species and varieties developing fair to excellent stands and persisting five or more years were considered adapted to one or more of the sites. Fifty-four of these were still present at the last rating. Thirty have reproduced themselves and are spreading naturally. Most widely adapted species are Agropyron desertorum, A. inter-medium, A. smithii, A. trichophorum, Atriplex canescens, Bothriochloa ischaemum, Bouteloua curti~ndula, Muhlenbergia wrightii, and Tridkns elongatus. Moisture variation caused some cool season grasses to fluctuate more widely in growth and stand than the other adapted species, especially shrubs. Warm-season growers were generally sensitive to’ low temperatures and cool- season growers to high temperatures. Complete protection from livestock appeared to have detrimental effects on some species. Sites are described and classified to help identify planting potential and facilitate wide application of results. Guidelines are suggested for shortening the time period needed to evaluate species adaption.
Successful improvement of pinyon-juniper rangelands by revegetation depends on the use of adapted species. Species and variety adaptation trials were begun in 1945 at 10 pinyon- juniper sites in Arizona. The plantings varied from 21 to 28 years in age when last evaluated. The long duration of these trials makes them especially useful for selecting species and varieties best suited to different range sites and planting needs. The accompanying site descriptions and classifications will help to identify potential planting sites and facilitate wide appli- cation.
Results apply to similar sites within the 13.5 million acres of pinyon-juniper rangeland in Arizona, including many areas invaded by juniper. Additional areas occur within the 37.5 million acres of pinyon-juniper in New Mexico, Colorado, and Utah. Other work on species adaptation in the pinyon-juniper
Authors are range scientist and research agronomist, respectively, U.S. Department of Agricultute, Agricultural Research Service, Western Region, Arizona-New Mexico Area, Rocky Mountain Forest and Range Experiment Station, Flagstaff, Arizona.
This research involves cooperative investigation by the U.S. Dep. Agr., Agr. Res. Serv.; the U.S. Dep. Agr., Forest Service, Rocky Mountain Forest and Range Exp. Sta., and the University of Arizona Agr. Exp. Sta.
The authors wish to thank those ranchers and personnel in the Forest Service, Soil Conservation Service, and Agricultural Research Service, who cooperated in this study, especially the U.S. Forest Service, Southwestern Region, who provided the land and much of the fencing; the U.S. Soil Conservation Service soil scientists, who provided technical assistance on soils; and the U.S. Soil Conservation Service Plant Materials Center at Tucson, Ariz., who furnished much of the seed.
Manuscript received March 14, 1977.
Editor’s Note: Dr. Lavin died on May 5 shortly afrer revising this manuscript with Dr. Johnsen.
woodland has been reported by Renney ( 1972)) Judd ( 1966), Judd and Judd ( 1976) for Arizona; Springfield ( 1965) for New Mexico; McGinnies, et al. ( 1963) for Colorado; and Plurnmer et al. (1968) for Utah.
The study was initiated by the former Southwestern Forest and Range Experiment Station (now Rocky Mountain Forest and Range Experiment Station), Forest Service, U.S. Depart- ment of Agriculture, and transferred to the Agricultural Re- search Service, U.S. Department of Agriculture, in 1954.
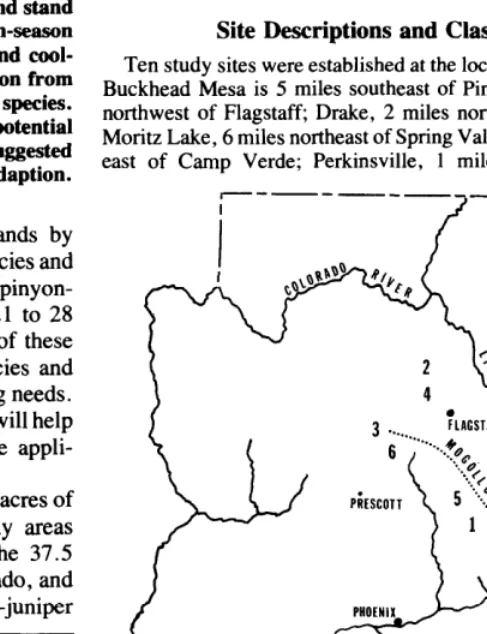
Site Descriptions and Classifications
Ten study sites were established at the locations shown in Figure 1. Buckhead Mesa is 5 miles southeast of Pine; Dog Knobs, 36 miles northwest of Flagstaff; Drake, 2 miles north of the town of Drake; Moritz Lake, 6 miles northeast of Spring Valley; Mud Tanks, 25 miles east of Camp Verde; Perkinsville, 1 mile south of the town of
--- ----_
I
2 DOG KNOBS 7 PETERSON FLAT .\ 3 DRAKE 8 PINE CREEK
4 MDRITZ LAKE 9 PLEASANT VALLEY \.,kL ID SIERRA ANCNA
---
Fig. 1. Location of the ten pinyon-juniper sites used to study species adaptation.
Table 1. Classifkation and description of Arizona pinyon-juniper study sites.
Subtype and study site
Cold-moist Moritz Lake
Elevation (fi above sea level)
Precipitation (inches)’
Annual Nov.-Apr.
16
Temperature (OF)’
Annual Jan.
30
7 49
Series
Sponsellor, warm varient Jacques
Soils
Texture
Silt loam
Dominant trees and shrubs2
Jumo, Juos, Pied
Peterson Flat Colddry
Dog Knobs Cool-moist
Mud Tanks
6,500 17 7 49 29 Loam Jude, Jumo, Pied
Warm-moist Pine Creek Pleasant Valley Buckbead Mesa Warm-dry
Drake Perkinsville Hot-moist
Sierra Ancha
6,400 12 4 49 31 Thunderbird Clay loam Jumo, Pied
5,900 18 9 52 32 Thunderbird Gravelly clay
loam, clay loam Jude
5,200 5,000 4,700
20 19 20
10 53
9 53
10 54
36 Showlow
36
36 Lynx Thunderbird
Gravelly loam Jude, Jumo
Loam Jude, Jumo
Clay loam Jude, Jumo
4,600 4,000
13 13
5 54 36
6 57 39 Tajo Abra, Partri Gravelly loam Loam, clay loam Juos Juos
4,600 17 9 60 43 White House Very gravelly
lOam
Qutu, Jumo, Jude
’ All precipitation and temperature data are means.
’ Jude = Juniperus deppeana, Jumo = J . monosperma , Juos = J. osteosperma. Qutu = Quercus turbinella, and Pied = Pinus edulis.
Perkinsville; Peterson Flat, 1 mile southeast of Pinedale; Pine Creek, 10 miles north of Young; Pleasant Valley, 2 miles east of Young; and Sierra Ancha, 3 miles southeast of the Sierra Ancha Experimental Forest Headquarters.
have soils different from the other sites. All the soils are loamy, ranging from gravelly to clay loams, with depths varying from moderately deep to deep.
Elevations, precipitation amounts and seasonal distribution, tem- peratures, and soils and vegetation of the sites represent a wide range of conditions (Table 1). Detailed site descriptions have been reported by Lavin and Johnsen (1977).
Procedure
The study sites are placed in six pinyon-juniper subtypes based on precipitation and temperature. Information from nearby weather stations (Sellers and Hill 1974) was adapted for seven sites. A combination of data from the nearest station and more distant stations with similar elevation, physiography, and vegetation was used to extrapolate information for the other three sites, namely Buckbead Mesa, Moritz Lake, and Mud Tanks.
Plantings were made from 1945 through 1952 with a total of 240 species and varieties. Several accessions were planted for many of the species. Only results for species and recognized varieties adapted to one or more sites are given here. A listing of all species planted has been made by Lavin and Johnsen (1977).
Sites with 15 inches or less mean annual precipitation are classed as dry; those with 16 inches or more, as moist. All sites received 7-10 inches of summer precipitation, mainly in July and August. Cool season precipitation was more variable. The Arizona pinyon-juniper woodland has distinct periods of summer and winter rainfall, with dry springs and falls. Also, there is a gradual reduction of summer rainfall from south to north and of winter rainfall from west to east (Jameson
1969).
Plantings were: (1) initial nursery plots of three 12-foot rows, spaced l-foot apart, and then (2) larger plots up to an acre in size for the more promising species. All plantings were replicated at least twice in separate blocks at each location. Many species and varieties, especially those that did not attain a fair or better stand or were destroyed by some biotic agent, were replanted several times in attempts to establish them.
Juniper and pinyon were clear cut and removed from the planting sites as required. Seed beds were plowed, disked, harrowed, and cultipacked, except at Buckhead Mesa and Pine Creek, which were disked and harrowed only, and at Moritz Lake, which was plowed with a Wheatland plow only. Nursery seedbeds replanted because of initial failure were prepared by hand hoeing and raking.
Comparisons of available temperature data and survival indicated that mean annual and mean January temperatures apparently were the most significant. Relative temperature groupings, therefore, were delineated on this basis. Sites are classed as: (1) cold, with mean annual temperature 49°F or less and mean January temperature 3 1 “F or less; (2) cool, with 50 to 53°F annual and 32 to 35°F January; (3) warm, with 54 to 58°F annual and 36 to 39°F January; and (4) hot, with 59°F or more annual and 40°F or more January.
Rows were formed, seeded, and covered by using handtools for the small nursery plantings. On the larger plots, seed was either drilled or broadcast. Broadcast seed was covered by harrowing or cultipacking. Seed rates were 20-40 pure live seed per linear foot for row plantings and 30-50 per square foot for broadcasting.
Study sites are all relatively level so that slope and aspect effects on temperature and moisture are minimal. Dominant trees and shrubs may have some use as site indicators because they appear to have a relationship to the climate. Alligator juniper grows on the moister sites, while Utah and one-seed juniper dominate the drier sites.
Seed was planted from g-1 inch deep, depending upon seed size and known species requirements. Most of the plantings were made from late June through July. During a few years plantings also were made at Peterson Flat in September, and at Dog Knobs in September and October. Weeds were not controlled except when replanting.
Soils were described from on-site examination by a soil scientist experienced with Arizona pinyon-juniper soils. Nine soil series were found on the study sites (Table 1). Buckhead Mesa, Dog Knobs, Moritz Lake, Mud Tanks, Perkinsville, and Pine Creek all have the same or similar soils classed as Aridic Argiustolls. Peterson Flat and Pleasant Valley have similar Cumulic Haplustolls soils. Drake, with a Petrocalcic Paleustoll, and Sierra Ancha, with a Ustollic Haplargid,
All sites were fenced against livestock except Moritz Lake. Ad- ditional fencing with l-inch mesh wire was used for protection against rabbits at all nursery plantings except Buckhead Mesa and Pine Creek. Cattle grazed the plantings at Dog Knobs, some of them heavily, during August, 1947, when the fence was being replaced. Fencing was removed from some of the larger plantings at Mud Tanks in the fall of 1959 and they have been heavily grazed each year since that time. Moritz Lake had heavy cattle use from June 1 to October 3 1 starting the year after planting until 1967, and since then has received heavy year-long use.
All plantings were rated at least twice a year from 1945 through 1953, once in 1954, and at irregular intervals thereafter. The last rating
consider the number, distribution, and vigor of the seeded plants. To
was made the fall of 1973. Numerical relative ratings on a scale from
simplify presentation, numbers have been converted to adjectives as
one to 10 representing the actual stand in relation to the best possible
follows: 0 = failure, l-2 = very poor, 3-4 = poor, 5-6 = fair, 7-8 =
stand were used to record planting success (Hull 1974). These ratings good, and 9-10 = excellent. Other information,
such as natural spread, disease, and animal activity, was also recorded.
Table 2. Fiil and maximum ratings1 for species and varieties surviving at least 10 years and attaining a rating of fair or better on one or more study sites.
Cold- Cool-
Cold-moist dry moist Warm-moist Warm-dry Hot-moist
Species and variety
Peterson Moritz
Flat Lake
Dog Knobs
Mud Tanks
Pine Pleasant Buckbead Perkins- Sierra
Creek Valley Mesa Drake ville An&a
Agropyron cristatum A. desertorum A. elongatum A. intermedium
A. intermedium-Amur A. intermedium-Ree A. popovii A. sibiricum A. smithii A. trichophorum Andropogon hallii Atriplex canescens Bothriochloa barbinodis B. caucasica
B. ischaemum
Bothriochloa ischaemum Bouteloua curtipendula B. curtipendula-Tucson B. curtipendula-Vaughn
B . eriopoda B . gracilis B. gracilis-Lovington Bromus erectus B. inermis
B. inermis-Acbenbach Buchloe dactyloides Ceratoides lanata Digitaria eriantha Elymus junceus Eragrostis chloromelas E. curvula
E. lehmanniana E. superba
Festuca ovina-duriuscula F. ovina-sulcata Hilaria jamesii H. mutica Koeleria cristata Medicago falcata Melilotus alba M. oficinalis Menodora scabra Muhlenbergia wrightii Panicum hallii P. obtusum P. virgatum Poa pratensis Purshia tridentata Sanguisorba minor Schizachyrium scoparium Sitanion hystrix Sorghastrum nutans Sorghum halepense Sporobolus airoides S. cryptandrus S. wrightii Stipa viridula Tridens albescens T. elongatus
-King Ranch
WE O/F O/G
G/E PIG F/E FIE*3 % E/E* O/E O/G F/E*
o/E - O/G
G/E* - O/G
O/G - PIG
WE O/G VIE E/E* F/F* E/E* G/G* V/G O/G
o/v - O/F
P/G FIG E/E
o/o - O/G
o/v - o/v
F/F** - O/F
O/F - O/G
o/v - O/E
O/E - O/F
FIG - -
PIG - O/G
G/E O/F O/G O/E O/P O/G
O/G - O/F
FIG - O/G
p/E - -
O/G - O/G
o/o - E/E**
- - o/o
O/E FIE PIE
O/G - O/F
O/E - O/E
- - -
- - -
V/F - -
F/F - -
O/G o/v O/F
o/v - o/v
F/F** - O/P
P/G - O/G
E/E** - O/E
O/E - O/E
- -
o/v E/E** F/G** E/E**
O/G - O/F
O/P - O/F
O/F - O/G
FIG - -
FIG - O/F
% - O/P
o/v - O/F
FIG - O/F
O/F - o/p
O/P - O/F
O/P - O/F
O/G o/p o/v
o/o - o/o
o/F - O/P
% - O/F
O/G - O/G
VlF G/E G/E* G/E* V/G F/E* GIG FIE**3 E/E* E/E* o/o G/E O/F O/G E/E** GIE** VIE O/G - O/E PIG PIG - FIG - O/E - - - E/E* E/E* - o/o - - o/o - o/p - O/F O/G - o/o FIG E/E* o/o O/E E/E** O/G O/E o/o - E/E** E/E** o/p - o/v F/E O/E O/E E/E** - o/v O/F o/o O/E o/o O/E - - O/G O/G O/F O/G O/G F/F** O/G - - - - - G/E o/p - - - - - E/E** E/E** - G/G** - o/p - o/o - - - - G/G* - - O/p O/G O/P VIE VIE FIG* O/G V/G F/E* O/F E/E* F/E* E/E* GIE V/F OIE E/E** GIE** F/E** O/E OIE O/G FIE FIE o/p O/F O/F O/G o/v VIE O/F O/E F/E - o/o o/v o/v GIE F/F - O/E O/E O/E E/E E/E** O/E O/F E/E* - o/o PIE** F/F O/P - O/E OIG O/E E/E** VIP O/E G/G**
- O/G VIE
PIG V/F VIE
- O/E O/E
WE O/G O/E
- O/F O/E
- O/F -
- OIG G/E*
- O/G -
E/E* G/E* E/E* O/E FIG* PIE
- O/F O/G
o/o G/E E/E
- O/F O/E
- o/o O/G
EIE** G/G** E/E**
- PIE - - O/F FIG - - O/G - - - - - - FIE - - - - - - - - - - - - - O/E - o/o - - - OIG O/F
O/G O/G GIG - PIE G/E E/E E/E** P/F P/G GIE VIE F/E G/E
- -
- -
- -
E/E* F/E* F/F** E/E** o/o O/E
O/F F/E**
O/G O/F O/G O/l; o/v - o/o -
- -
- -
o/v - o/o -
- -
- -
- -
- -
O/G O/E P/G O/F
FIG** O/E
OIE O/F
F/F* O/G
- -
V/G o/o
O/G O/E
o/o -
FIG O/F
o/o -
O/E -
O/F FIF
O/G V/G o/o O/F O/F O/F O/G O/F O/G FIG
o/o
o/p - o/o - o/o - o/o o/o o/o - - ON O/E GIG** O/G PIG PIG - o/v PIG - o/v - - - o/o o/o o/o EIE** O/P O/E G/E** - - - - - - - - o/o o/o O/F P/E* - - o/o - - - - - Of0 V/F - o/v O/G V/F’ Final rating/maximum rating: 0 = failure, V = very poor, P = poor, F = fair, G = good, E = excellent, - = not planted. * Italic indicates sites where species and varieties survived IO or more years and attained a relative rating of fair or better. ’ Spreading at time of final observation: * = vegetative spread, ** = spread by natural seeding.
Results and Discussion Adaption
Fifty-nine of the 240 species and varieties tested were adapted to one or more sites. Fifty-four of these were still present in 1973 (Table 2), 45 with stands rating fair or better. The five species adapted but not present in 1973 had all survived for at least 10 years and some as long as 20 years.
Based on our observation, species adaptation might be considered as persistence for at least 5 years and attainment of relative rating of fair or better. This time period, which is shorter than has generally been accepted in the past, appears to be adequate if it includes at least one prolonged drought. The shorter time interval would be especially important for judging small, test plantings because factors other than site adaptability can affect species survival in them.
Forty percent of the species planted in the cool-moist subtype were adapted. Thirty-four percent were adapted to the warm- moist subtype, and 29% to the warm-dry and to the cold-moist subtypes. Only 13% were adapted to the cold-dry and 9% to the hot-moist subtypes. This indicates that the cool-moist and warm-moist subtypes are most favorable for revegetation with the species tested. All species were not planted on all sites because it was initially known that some were not adapted to certain sites.
The most widely adapted species were crested wheatgrass (Agropyron desertorum), intermediate wheatgrass (A. inter- medium), western wheatgrass (A. smithii), pubescent wheat- grass (A. trichophorum), fourwing saltbush (Atriplex canes- tens), yellow bluestem (Bothriochloa ischaemum), sideoats grama (Bouteloua curtipendula), spike muhly (Muhlenbergia wrightii), and rough tridens (Tridens elongatus) (Table 2). These nine species show the best potential for use on Arizona pinyon-juniper rangelands.
Yellow bluestem, the most widely adapted species, did best in the warmer subtypes where it rated excellent on four sites. It is long-lived and forms a dense ground cover. At Buckhead Mesa it has invaded the native vegetation and dominates the study area. Fourwing saltbush probably is just as widely adapted as yellow bluestem, but was not tested in the hot-moist subtype. Western wheatgrass, rated excellent at seven sites, is out- standing in forming a heavy protective cover. Its main dis- advantage is slow establishment. Pubescent wheatgrass rated excellent at Mud Tanks and Pine Creek, but at both sites was stemmy with few basal leaves. Crested wheatgrass at Pine Creek grew in large clumps with wide bare interspaces. This type of growth provides poor protection against both raindrop splash and surface runoff erosion. Spike muhly had a final rating of excellent at four sites. It established slowly but, once established, was vigorous, aggressive, and produced a large volume of foliage. Sideoats grama is widely adapted, apparent- ly doing better on the warmer sites. The difference in responses of the Vaughn and Tucson varieties indicates the need for variety tests on specific sites. Rough tridens was adapted to all but the cold sites. This was a native seed source whose potential is not understood.
Winterfat (Cerutoides lanata) became established at only three sites and rated excellent at two. It is probably more widely adapted than our results indicate, but is difficult to establish because the planting techniques used are not reliable. Russian wildrye (Elymus junceus) maintained an excellent to fair stand at Moritz Lake despite 22 seasons of extremely heavy cattle use. The sweet clovers (Melilofus spp.) maintained excellent stands at Peterson Flat and Pine Creek. Boer lovegrass (Erugrostis
chloromelus ) persisted only at Sierra Ancha. There, however, it dominated the study site, invading bare areas where other species had failed.
Weed competition occurred at all sites but was especially heavy at Pleasant Valley where the study was located on an old cultivated field that had been abandoned for many years. Among the species adaptation characteristics for this site was an ability to overcome weed competition.
Establishment and Survival
Establishment, growth and development of the seedling after initial emergence, was excellent in five of the six subtypes, ranging from 88 to 98%. Poorer establishment, 61%, occurred in the hot-moist subtype. Survival, persistence of living plants from initial emergence to time of the last observation, was 40 to 48% of the planted species in the four most favorable subtypes. Only 27%, however, survived in the hot-moist and 19% in the cold-dry subtypes.
Natural Spread
Thirty species and varieties spread naturally (Table 2). The most vigorous spreaders were western wheatgrass, winterfat, yellow bluestem, and spike muhly . The panicums (Panicurn spp.), sweetclovers, spike muhly , yellow bluestem, Boer and weeping lovegrass (Erugrostis curvula) tended to establish better and spread more rapidly in low-lying areas, such as drainages, swales, and other depressions. Yellow bluestem was the only species observed invading native vegetation. Winter-fat was difficult to establish, but, once established, spread widely. It may be practical to transplant winterfat as widely spaced plants and let the interspaces fill in by natural seeding. Fourwing saltbush did not reproduce itself in any of the plantings, although it is widely adapted and long-lived. The sweetclovers, though only biennials, persisted and spread by natural seeding. Buffalograss (Buchloe duczyloides) spread vigorously and formed good ground cover where adapted, but produced little foliage. Bumet (Sanguisorba minor) established easily and spread aggressively at Pleasant Valley but was short-lived. At nearby Young it is a lawn weed. Some plants originally identified as tall wheatgrass (Agropyron elongatum) were spreading by rhizomes. Possibly they had hybridized with pubescent wheatgrass.
Drought
All surviving species and varieties have persisted through severe, extended droughts. For example, a prolonged regional drought occurred from 1950 through 1957. It was especially severe in 1950-53; also 1956 was the driest year on record in Arizona (U.S. Weather Bureau 1956). In 1963 drought was so severe at several sites that fourwing saltbush lost its leaves.
In general, size, vigor, and stand seemed to fluctuate more widely in response to varying moisture conditions for the grasses than for the shrubs. The greatest variation occurred in the cool season grasses. Crested wheatgrass and, to a lesser degree, intermediate, pubescent and western wheatgrass almost disappeared during drought and improved markedly with favorable moisture. For the hot-moist subtype, low effective precipitation during the growing season, because of high temperatures and shallow-soil moisture penetration from high intensity thunderstorms, may have been the reason for poor establishment.
Temperature
Frost damage and winter kill were observed at all sites. Warm season species apparently were more limited by low tempera- tures than cool season species. Differences in cold resistance