User Satisfaction in Augmented Reality-based
Training using Microsoft HoloLens
Hui Xue1,* , Puneet Sharma1and Fridolin Wild2
1
2
3
4
5
6
7
8
9
10
11
12
13
14
15
1 UiTTheArcticUniversityofNorway;[email protected];[email protected] 2 OxfordBrookesUniversity,UnitedKingdom;[email protected]
* Correspondence:UiTTheArcticUniversityofNorway;Tel.:+47-776-46-625
Abstract: With the recent developments in augmented reality (AR) technologies comes an increased interest in the use of smart glasses for hands-on training. Whether this interest is turned into market success or not depends at the least on whether the interaction with smart AR glasses satisfies users, an aspect of AR use that so far has received little attention. With this contribution, we seek to change this. The objective of the article, therefore, is to investigate user satisfaction in AR applied to three cases of practical use. User satisfaction of AR can be broken down into satisfaction with the interaction and satisfaction with the delivery device. A total of 142 participants from three different industrial sectors contributed to this study, namely, aeronautics, medicine, and astronautics. In our analysis, we investigated the influence of different factors, such as age, gender, level of education, level of Internet knowledge, and the roles of the participants in the different sectors. Even though users were not familiar with the smart glasses, results show that general computer knowledge has a positive effect on user satisfaction. Further analysis using two-factor interactions shows that there is no significant interaction between the different factors and user satisfaction. The results of the study affirm that the questionnaires developed for user satisfaction of smart glasses and the AR application performed well, but leave room for improvement.
Keywords: augmented reality; Microsoft HoloLens; AR application; user experience; user satisfaction
16
1. Introduction
17
Augmented Reality (AR) means enhancing the user’s perception “with additional, artificially 18
generated sensory input to create a new experience including, but not restricted to, enhancing human 19
vision by combining natural with digital offers” (Wild et al., 2018). Augmented Reality typically 20
has three characteristics [1]: first, AR combines the virtual with the real world; second, objects are 21
registered from both the real and virtual world in one coordinate system; third, the interaction between 22
the objects of both worlds is possible in real time. 23
Hands-on training is important for many disciplines and professions, such as medical workers, 24
mechanics, technicians, electricians, engineers, sailors, pilots, and firefighters. In the past decade, AR 25
has been increasingly employed for a number of training applications, such as medical education [2], 26
rehabilitation engineering [3], automotive safety [4], task assistance [5], and manufacturing [6]. 27
For the successful adoption of AR-based training across different domains, one of the key factors 28
is user satisfaction. User satisfaction is defined as a combination of different factors associated with 29
the usage of the AR application and the associated delivery device[7]. These factors include: a feeling 30
of powerfulness and achievement; an efficient use of time, effort, and other resources; meaningful 31
content; a better insight to the training environment; a natural interaction; a feeling of amazement; 32
performance that exceeds expectations; playfulness; the invoking of positive feelings and pleasing 33
memories; immersion and engagement; a transparent interaction; the feeling of participation in a 34
community; a sense of privacy of the user’s content; inspiration, encouragement, and motivation; and, 35
finally, artistic creativity [7]. 36
The rest of this paper is organized as follows. First, we turn to the state of the art, summarizing 37
what the research has found so far with respect to AR user interaction, AR user satisfaction, and 38
questionnaires used for evaluating user satisfaction. Next, the AR app used in the trials is described. 39
Subsequently presented are the research methodology and a summary of the information of the 40
participants, devices, design of trial tasks, and evaluation methods. Finally, findings and results are 41
illustrated, and the discussion and conclusion are given at the end. 42
The main objective of this study is to test and observe user satisfaction in using AR applications 43
and using AR glasses. The method for evaluating includes questionnaires and interviews. The AR 44
app used in this evaluation, therefore, has two parts: one is the expert recording the experience in the 45
workplace, and the other part is the novices training on work-related procedures using said recordings. 46
In this study, we evaluated the following research hypotheses: to find if experts and students are 47
satisfied with the prototype application, to see if the application can increase interest in learning new 48
skills, and to evaluate if the users find the application easy to use. 49
2. State of the art
50
2.1. AR user interaction 51
AR technologies provide a different user experience than that of, for example, mobile phone 52
apps. The user interacts with the surrounding real world, combining inputs from the environment 53
with digital augmentations. Popular examples include PokemonGO and SnapChat. These type 54
of apps certainly brought the term “augmented reality” into the spotlight [8]. With the advent of 55
consumer-grade AR glasses, different types of AR user interactions are becoming necessary. For 56
example, a user who is wearing Microsoft’s HoloLens can communicate diagrams and other types of 57
graphics directly embedded into the environment to a different, remote user (see Figure1). 58
Figure 1.With Microsoft HoloLens, a user connects the wires with remote assist [9].
2.2. AR user satisfaction and questionnaires for evaluating user satisfaction 59
AR Technology has evolved from offline to online, from static devices to mobile devices, and 60
from desktop and mobile to wearable devices [10]. Consequently, with AR development over the 61
past decade or so, special attention has been drawn to the maximization of AR user satisfaction. AR 62
user satisfaction is dependent on both the design of the user interface (UI) and the choice of the 63
AR hardware. Personalization of AR glasses can lead to greater AR user satisfaction [11]. AR apps 64
designed for a good user experience result in a more overall satisfied AR user. This applies to AR 65
navigation apps, AR health apps, AR education apps, and certain AR smart glasses games [12]. 66
There are several concepts and subjective measures for evaluating the user experience of AR 67
services. With regards to the user, satisfaction questionnaires are common tools used to evaluate 68
Figure 2.User Interface of the recording mode. Image from the WEKIT consortium in 2017.
designed to assess users’ subjective satisfaction with specific aspects of the human–computer interface 70
[13]. The results of QUIS facilitate new developments by addressing reliability and validity problems 71
found using its satisfaction measurements. Therefore, the measure is highly reliable across many types 72
of interfaces. 73
QUIS consists of a demographic questionnaire, a six-scale measure of overall system satisfaction, 74
and hierarchically organized measures. The measures include the following specific interface factors 75
[13]: screen factors, terminology and system feedback, learning factors, system capabilities, technical 76
manuals, online tutorials, multimedia, teleconferencing, and software installation. Each area is 77
measured by a 7-point scale according to the user’s overall satisfaction with the interface and the above 78
factors [13]. 79
3. The AR application
80
The AR application consists of two modes: recorder and player.
81
Therecorderis designed for capturing an expert’s workplace experience and combining it with
82
technical documentation associated with a given scenario. The player is used to reenact the scenario to
83
verify the recordings and usually employed to train a novice for the scenario.
84
In order to capture an expert’s experience, a set of transfer mechanisms were defined in [15]. The
85
so-called transfer mechanisms allow us to map the key aspects of an expert’s performance to low
86
level data and subsequent sensors. For more details on the different sensor components and their
87
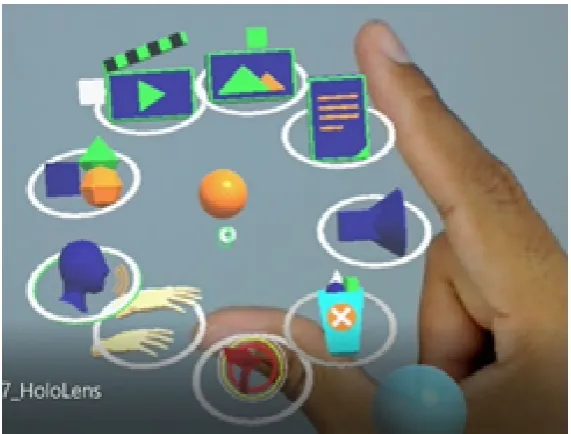
integration please see [16]. The recorder (as shown in Figure2) consists of a radial menu that allows us
88
to select different options for capturing diverse annotations such as: pictures, videos, text annotations
89
(for adding text information to different objects in the environment), audio, ghost hands (to capture
90
the locations and movements of user’s hands) and 3D models (useful for performing the task).
91
Trainers can use a so-called ’ghost track’ to record their own position and indoor movement, 92
while at the same time recording voice explanations. When replaying such recording to the trainees, 93
the holographic ’ghost’ representation of the expert provides more intuitive guidance on where to 94
be, where to focus, and what to do – than merely reading about the task to be learned in a manual 95
using text and illustration. Figure3shows an example of such ghost track recording and replay for an
96
aircraft maintenance task. 97
Theplayeris the mode designed for trainees to learn how to do procedural operations (kind 98
of ’do-torial’ mode). The app executes AR learning experience models (IEEE standard association, 99
(a) (b)
Figure 3.A ghost track in WEKIT Recorder mode: (a) recording a ghost track; (b) ghost track replay. Image from [19].
be transferred from device to device as well as from place to place, using a calibration marker to 101
recalculate the relative positions of all points of interest, while utilising 3D environmental mapping to 102
provide stable projections. 103
The WEKIT player starting screen is shown in Figure4. Once the task starts, the first action step 104
and its associated augmentations are shown on the smart glasses display. From the perspective of the 105
users, this typically means that the visual annotations overlay onto their unimpeded realworld view 106
(optical see-through). Step by step, they guide the user through the learning task at hand. Gesture 107
commands, voice commands, and the hardware clicker are all available when using the app. Figure 108
5shows an example of the WEKIT player in action. When the sensors on the HoloLens detect the 109
particular tangible object, the virtual button is displayed in front of the trainee, while instruction on 110
handling and movement are given at the same time. 111
Figure 5.Example of user interface of WEKIT Player mode. Image from [17].
4. Research Design/Experiment Methodology
112
4.1. Participants 113
In order to evaluate the satisfaction of the user interaction and the smart glasses user experience, 114
the WEKIT application was deployed in three different pilot testing scenarios: aviation, medical 115
imaging, and space. Moreover, in the experiments, the test population was divided into two main 116
groups, experts and students, respectively. A total of 47 experts (8 females; 39 males) with a high 117
level of technological competency in their respective fields were recruited. A total of 95 learners (23 118
females; 72 males) from the three different fields voluntarily participated in the trials. The majority 119
of the participants (68) were in the 18–24 age group, followed by 48 of the participants in the range 120
between 25 and 34. Most of the participants had moderate or better computer knowledge and internet 121
knowledge, expressed on a 5-point Likert scale ranging from very poor, poor, moderate, good, to very 122
good. All participants gave written consent for their participation in the trials. 123
4.2. Material and Apparatus 124
The trial used the Microsoft HoloLens as wearable AR glasses for assessing the user’s satisfaction 125
with AR training. There are two parts in the WEKIT technology platform [18] deployed on HoloLens. 126
One is a recorder for capturing expert experience and the other one is a player for presenting the 127
expert’s experience to the trainees. During the trial, all interactions and manipulations were done by 128
using gesture and voice command only. 129
4.3. Trial design/task 130
The trial used Microsoft HoloLens as wearable AR glasses for assessing the user’s satisfaction 131
with AR training. There are two parts in the WEKIT technology platform [18] deployed on HoloLens. 132
One is a recorder for capturing expert experience and the other one is a player for presenting the 133
expert’s experience to the trainees. During the trial, all interactions and manipulations were done by 134
using gesture and voice command only. 135
4.4. Trial design/task 136
The trial tasks were separated into three different areas, as mentioned in section 4.1. Tasks in the 137
Aeronautics use case were performed at Lufttransport, Norway.The scenario used for the aeronautics 138
use case was a pre-flight inspection consisting of checking and securing different items such as baggage, 139
exits, locks, and checking the status of components such as landing gears, brakes, engine switches, 140
battery, and fuel.The experts comprised of maintenance apprentices, skilled workers (mechanics), and
141
volunteers from UiT The Arctic University of Norway [19]. Figure6shows a novice engaging in the 143
pre-flight inspection task. Experts had been using the different types of annotations to create the 144
required instruction for the training procedure, which then was provided to the trainee in the player 145
mode of the AR app. The novice followed the instructions in order to complete the task in the cockpit. 146
The pre-flight inspection scenario consisted of following steps (see Table1)
147
Table 1.Steps of the pre flight inspection scenario for Beechcraft B200.[19]
No. Cabin/cockpit Action Content
1. Baggage Secure Ensure that the baggage compartment and
net is secured.
2. Emergency Exit Secure and unlocked Emergency exit handle must be in the secured position and the lock must be in the unlocked position.
3. Control locks Remove and stowed The control locks must be removed and stowed.
4. Trim Tabs Exit Set to "0" Including elevator trim tab, aileron trim tab, elevator trim tab.
5. Condition levers Fuel cut-off Must be set to the fuel cut-off position.
6. Landing gear control Down Must be in down position.
7. Parking brake Set If required, ensure that the parking brake is
set on. 8. Ignition and engine
start switches
Ensure off Must be in the off position.
9. Battery Check for minimum 23V Turn on the battery master switch. Check for minimum 23V on the voltmeters by pushing the push-to-test knobs on the voltmeters. 10. Fuel quantity Check Check the fuel quantity in main fuel tanks.
Move and hold the “fuel quantity”-switch to auxiliary position and check the fuel quantity in auxiliary fuel tanks.
Figure 6.Maintenance Engineer in the cockpit of a Beechcraft B200 King Air model. Image: Mikhail Fominykh, WEKIT consortium (2017).
The medical task involved imaging and diagnostic workers and was conducted at EBIT (Esaote’s 148
Healthcare IT Company) in Genoa, Italy [20]. This task was for training medical students and 149
radiologist apprentices on using MyLab8, an ultrasound machine produced by ESAOTE [21].Similar 150
to the trial at Lufttransport, the users executed the steps of the procedure using the player mode 151
examination to analyse a patient’s condition. The patient was a paid actor. During the task, the novice 153
doctors needed to combine data from different sources in order to arrive at the correct diagnosis. As 154
for the holographic training instructiton, the guidance was set up for the player mode again using 155
experts, adding the step by step description needed to guide the trainee through the full scanning 156
and assessment procedure. The novice doctors then wore the HoloLenses and tired to perform the 157
examination. The tasks are shown in the Table2. In Figure7, we can see a novice performing a task by
158
positioning the probe in the target direction and taking measurements using the player application. 159
Table 2.Steps of diagnostic training of radiology students performing an ultrasound examination.[21]
No. Ultrasound equipment
Action Content
1. Probe Choose Choose the proper probe. Point to the linear
probe and listen to the audio annotation explaining which probe to select and why, and how to hold it (with a raised edge). 2. Button Select the mode Point to the “B/M” button to select the correct
mode.
3. Probe Transversal position Position the probe in a transverse direction 4. Probe Longitudinal direction Position the probe in a longitudinal direction. 5. Button Change the mode Change the mode to Color Mode.
6. Button Choose button Position the center line in the middle of the artery.
7. Button Change the mode Change the mode to Doppler Mode. If
required, ensure that the parking brake is set on.
8. Circle button Pointing Point to Circle button highlighted in the following figure.
9. Measure button Measure Choose correct button to start reading. 10. Trackball button Measure Position the cursor over the highest peak in
the curve, then click the left trackball button to set the first data point. Repeat for the lowest point in the graph.
11. Image button Snapshot Take a snapshot with the measure.
Figure 7.A radiologist conducting ultrasound training. Image: WEKIT consortium (2017).
The space task that was conducted at the facilities of ALTEC in Turin and it involved training 160
astronauts on how to install a Temporary Stowage Rack (TSR). The TSR installation is a procedure 161
that astronauts have to perform on the International Space Station (ISS) [22]. Similar to the trials at 162
the other two organizations, experts designed the training scenario, while a larger number of trainees 163
conducted using the recorder mode of the app as well as the player, while the trainees used only the 165
player mode. The steps for this procedure are as follow. First, trainees were asked to scan the working 166
area to create the 3D model of the environment, to then identify the six seat track studs location on the 167
structure, the position of the ball bearing and brackets. Next, they were instructed to fix the six studs 168
in specific locations. Finally, they were asked to extract TSR, deploy it, and fix it to the correct places. 169
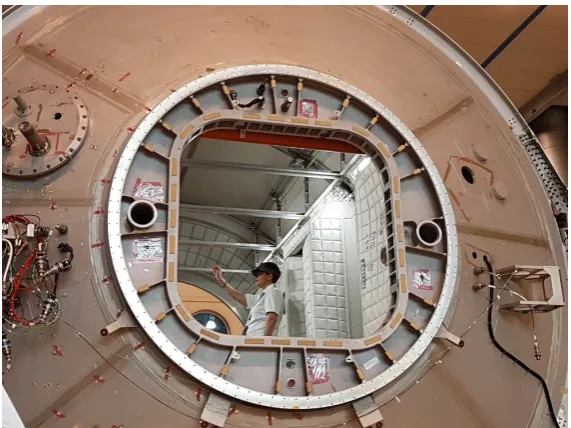
The novices performed the task based on the recorded content. In Figure8, we can see a participant of 170
the trials performing a task in a replica module of the International Space Station. 171
Figure 8. Astronaut trainer in a replica training module of the international space station. Image: WEKIT consortium (2017).
4.5. Smart Glasses User Satisfaction (SGUS) 172
The Smart Glasses User Satisfaction (SGUS) questionnaire was created for the WEKIT trials. It 173
is a tool designed to assess users’ subjective satisfaction with smart glasses. SGUS is a method and 174
measure to scrutinize aspects, such as an enhanced perception of the environment, interaction with the 175
augmented environment, implications of location and object awareness, the user-created AR content, 176
and the new AR features that users typically use [7]. The general objective of the questionnaire is to 177
understand the potential end users’ central expectations of AR services with smart glasses, especially 178
from an experiential point of view [7]. In this study, the smart glasses used for the different use cases 179
were Microsoft HoloLens. SGUS measures subjective satisfaction on the basis of different features 180
associated with user satisfaction, such as the content and interaction with the content. SGUS is based 181
on evaluation criteria for web-based learning [14] and statements evaluating the user experience of 182
mobile augmented reality services [7]. SGUS consists of 11 items (statements) on a 7-point Likert scale 183
(1–7) [19]. The 11 statements include three categories of evaluation criteria, which are general interface 184
usability criteria, AR interaction-specific criteria for an educational AR app, and learner-centered 185
effective learning [14]. 186
4.6. Questionnaire for User Interface Satisfaction (QUIS) 187
The Questionnaire for User Interaction Satisfaction (QUIS) measures subjective satisfaction with 188
specific aspects of the interface and interaction between the user and the AR application [23]. In this 189
study, QUIS was modified for AR glasses, i.e., HoloLens. Hence, a questionnaire with 15 items was 190
used. In order to maintain consistency with the survey in other sections, each item was mapped to a 191
4.7. Procedure 193
As most participants had no experience with AR glasses, at the beginning of the trial, they were 194
asked to familiarize themselves with the AR glasses, i.e., HoloLens. In order to do this, gesture training 195
with HoloLens was done before they started using the application. The application comprised a 196
scenario that the participants had to complete in a particular use case setting. The content of the 197
application was generated by experts in that specific use. After the participants completed all the tasks, 198
they were provided with the QUIS and SGUS questionnaires to complete. 199
5. Results/Findings
200
5.1. Descriptive statistics 201
In this section, we report on descriptive statistics for the smart glasses user interaction and the 202
interaction satisfaction.We organise the findings alongside the investigation of eight hypotheses,with 203
the summary of these shown in Table3.
204
H1: Does gender matter? In Science and Engineering, gender is not balanced and there are fewer women
205
than men[?]. Gender stereotypes can affect use of established technologies. We therefore investigate
206
whether the influence on user satisfaction of these new media will be moderated by gender.
207
H2: Does age matter?Studies imply that younger people embrace new technologies more easily [24]. Since 208
we are using AR glasses and applications for training, we would like to know whether age affects user 209
satisfaction. 210
H3: Are experts more tech savvy? It is likely that experts have more experience with technology applications,
211
as in general they also have more domain-specific knowledge and skills. We assume that they would
212
be more able to grasp the app concept, thus being more satisfied with the interaction. The novices,
213
however, may have less knowledge and skills, hence, may find the app difficult to use.
214
H4: Does education matter? Higher levels of education go hand in hand with higher levels of ICT skills. It
215
is justified to hypothesize that the educational level predicts satisfaction.
216
H5: Does computer knowledge matter? Higher levels of ICT and media skills typically involve transfer
217
skills. The AR smart glasses headset used, Microsoft Hololens, is a stand-alone device. We need basic
218
computer knowledge to use it. Those with better computer knowledge might find it easy to use, and
219
hence, give a higher score in terms of user satisfaction.
220
H6: Does internet knowledge matter? In analogy to computer skills, one can expect Internet skills to
221
influence the user satisfaction levels in a positive manner.
222
H7: Are there differences in satisfaction levels between the participants of the three test-beds? The trials
223
involved three different learning tasks, in three different environments, with three different groups of
224
participants. As all three trials are about training a particular procedure, that there are no differences
225
identified across test-beds.
226
H8: Is there any interaction between the above mentioned factors?
Table 3.Summary of the hypotheses
# Description Expectation
H1 Gender Men are more satisfied with the user
interaction than women.
H2 Age Younger participants give a higher score.
H3 Experts vs. novices Experts have higher satisfaction levels. H4 Education level Higher education users have higher
satisfaction levels.
H5 Computer knowledge level Users with better computer knowledge might be more satisfied.
H6 Internet knowledge level Might have influence. H7 Three different test-beds Might have different results.
H8 above 7 factors There might be interactions between factors.
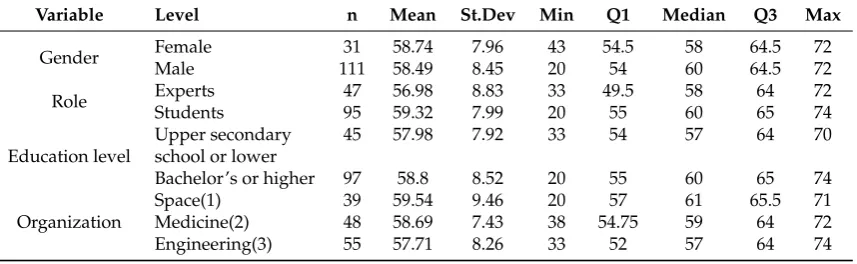
5.1.1. SGUS 228
As mentioned before, SGUS has 11 items. The summation of the score for the 11 items is the 229
SGUS score. As shown in Table4, we provide data such as: n (number of participants), mean, standard 230
deviation, minimum value, Q1 (the first quartile: "middle" value in the first half of the rank-ordered 231
data set), median, Q3 (the third quartile: "middle" value in the second half of the rank-ordered data 232
set), and maximum value for the following variables: gender, education level, roles, and organizations. 233
Based on these results, it is clear that the mean scores are similar across the different levels associated 234
with the variables. 235
Table 4.Descriptive statistics of the Questionnaire for Smart Glasses User Satisfaction (SGUS).
Variable Level n Mean St.Dev Min Q1 Median Q3 Max
Gender Female 31 58.74 7.96 43 54.5 58 64.5 72
Male 111 58.49 8.45 20 54 60 64.5 72
Role Experts 47 56.98 8.83 33 49.5 58 64 72
Students 95 59.32 7.99 20 55 60 65 74
Education level
Upper secondary 45 57.98 7.92 33 54 57 64 70
school or lower
Bachelor’s or higher 97 58.8 8.52 20 55 60 65 74
Organization
Space(1) 39 59.54 9.46 20 57 61 65.5 71
Medicine(2) 48 58.69 7.43 38 54.75 59 64 72
Engineering(3) 55 57.71 8.26 33 52 57 64 74
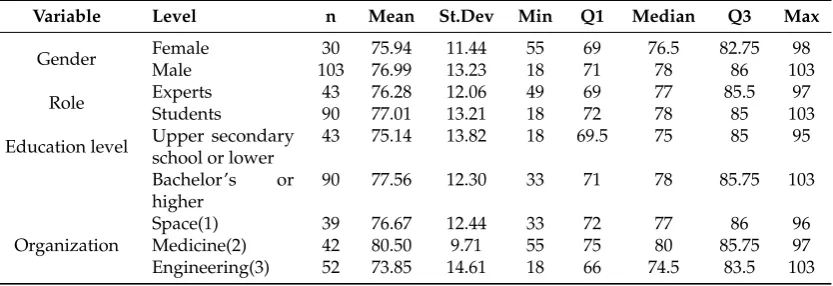
5.1.2. QUIS 236
Similarly, the overall Questionnaire for User Interface Satisfaction (QUIS) score was calculated by 237
summation of the score for the 15 QUIS items. Summary data for all questions in QUIS are presented 238
in Table5. The 15 items were designed independently from each other. These items aim to investigate 239
the satisfaction of users with different aspects of the interface, including usability and user experience 240
Table 5.Descriptive statistic of the Questionnaire for Smart Glasses User Satisfaction (QUIS).
Variable Level n Mean St.Dev Min Q1 Median Q3 Max
Gender Female 30 75.94 11.44 55 69 76.5 82.75 98
Male 103 76.99 13.23 18 71 78 86 103
Role Experts 43 76.28 12.06 49 69 77 85.5 97
Students 90 77.01 13.21 18 72 78 85 103
Education level Upper secondary school or lower
43 75.14 13.82 18 69.5 75 85 95
Bachelor’s or higher
90 77.56 12.30 33 71 78 85.75 103
Organization
Space(1) 39 76.67 12.44 33 72 77 86 96
Medicine(2) 42 80.50 9.71 55 75 80 85.75 97
Engineering(3) 52 73.85 14.61 18 66 74.5 83.5 103
5.2. Correlation 242
In this section, we discuss correlation for SGUS and correlation for QUIS. 243
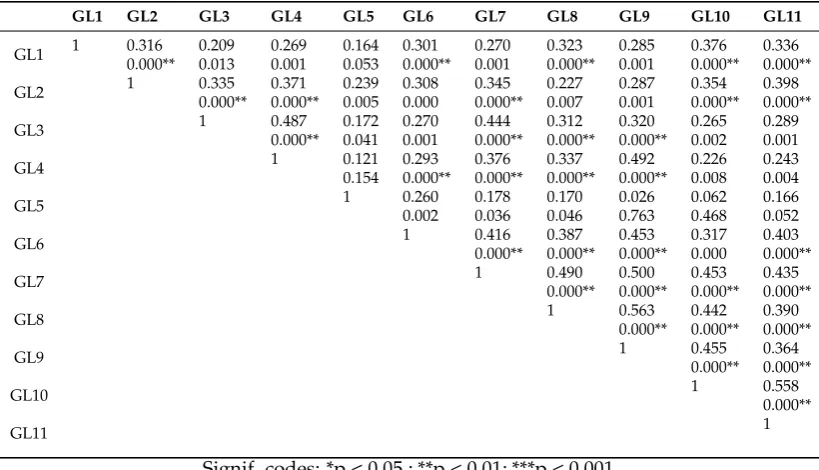
5.2.1. Correlation of SGUS 244
Spearman0s correlation coefficient,ρ, measures the strength and direction of association between 245
two ranked variables in the range [-1, 1]. Based on the 11 items, the results of Spearman0s rank 246
correlation are shown in Table 6: the first value of each row represents Spearman’s correlation 247
coefficient, and the second value of each row represents the p value. It can be seen that almost 248
all items are statistically significant (p<0.05) and have a low positive correlation. This implies that all 249
the items are independent. 250
In the study of SGUS, each of the items investigates a different aspect of the user experience. For 251
the analysis, the overall averages for all items were calculated. Figure9shows the plot of the average 252
score from individual items. The box in the plot depicts the answer of 50% of the participants, with the 253
line in the middle indicating the median. The dotted lines span the 95% confidence interval. Outliers 254
are depicted with black dots. The connected red dots indicate the medians. The results imply that 255
most of the participants had a good conception of what is real and what is augmented when using 256
AR-glasses (GL5). The participants indicated that the system and content helped them to accomplish 257
the task quite well (GL7) and their attention was captivated in a positive way (GL6). The provided 258
content was also seen as contextually meaningful (GL2). However, performing the task with AR 259
glasses was experienced as less natural (GL9, GL4), and following and understanding the task phases 260
Table 6.Spearman’s rank coefficient of correlation for SGUS: the first value of each row represents Spearman’s correlation coefficient, and the second value of each row represents the p value.
GL1 GL2 GL3 GL4 GL5 GL6 GL7 GL8 GL9 GL10 GL11
GL1 1 0.316 0.209 0.269 0.164 0.301 0.270 0.323 0.285 0.376 0.336 0.000** 0.013 0.001 0.053 0.000** 0.001 0.000** 0.001 0.000** 0.000**
GL2 1 0.335 0.371 0.239 0.308 0.345 0.227 0.287 0.354 0.398 0.000** 0.000** 0.005 0.000 0.000** 0.007 0.001 0.000** 0.000**
GL3 1 0.487 0.172 0.270 0.444 0.312 0.320 0.265 0.289 0.000** 0.041 0.001 0.000** 0.000** 0.000** 0.002 0.001
GL4 1 0.121 0.293 0.376 0.337 0.492 0.226 0.243
0.154 0.000** 0.000** 0.000** 0.000** 0.008 0.004
GL5 1 0.260 0.178 0.170 0.026 0.062 0.166
0.002 0.036 0.046 0.763 0.468 0.052
GL6 1 0.416 0.387 0.453 0.317 0.403
0.000** 0.000** 0.000** 0.000 0.000**
GL7 1 0.490 0.500 0.453 0.435
0.000** 0.000** 0.000** 0.000**
GL8 1 0.563 0.442 0.390
0.000** 0.000** 0.000**
GL9 1 0.455 0.364
0.000** 0.000**
GL10 1 0.558
0.000**
GL11 1
Signif. codes: *p < 0.05 ; **p < 0.01; ***p < 0.001
● ● ● ● ● ● ● ● ● ● ● ● ● ● ● ● ● ● ● ● ● ● ● ● ● ● ● ● ● ● ● ● ● ● ● ● ● ● ● ● ● ● ● ● ●●●●● ● ● ● ● ● ● ● ● ● ● ● ● ● ● ● ● ● ● ● ● ● ● ● ● ● ● ● ● ● ● ●
Smart Glasses User Satisfaction (All)
Strongly Disagree Disagree Somewhat Disagree Neither agree or disagree Somewhat agree Agree Strongly Agree
GL1 GL2 GL3 GL4 GL5 GL6 GL7 GL8 GL9 GL10 GL11
● ● ● ● ● ● ● ● ● ● ●
Figure 9.Plot of SGUS score for each item.
5.2.2. Correlation of QUIS 262
The correlation for QUIS is based on 15 items. The results of Spearman’s rank correlation are 263
shown in TableA1(see Appendix). The values in the table have the same meaning as in Table6. The 264
results are similar to those of SGUS; most of the items are statistically significant (p < 0.05) and have a 265
low positive correlation. This implies that most of the items are independent. 266
In the study of QUIS, each of the items investigated different aspects of the user experience. For 267
the analysis, the overall average from all items was calculated. Figure10shows the plot of the average 268
score from individual items, and the description of the plot is the same as that of the SGUS plot. The 269
to be rather easy, and the overall enthusiasm towards the system seemed (QS1, QS5) to be very positive. 271
The characters on the screen were relatively easy to read (QS9). The means of QS3, 4, 6, 7, and 8 272
indicate that the system was experienced as rigid, unreliable, and slow, which may cause frustration 273 [19]. 274 ● ● ● ● ● ● ● ● ● ● ● ● ● ● ● ● ● ● ● ● ● ● ● ● ● ● ● ● ● ● ● ● ● ● ● ● ● ● ● ● ● ● ● ● ● ● ● ● ● ● ● ● ● ● ● ● ● ● ● ● ● ● ● ● ● ● ● ● ● ● ● ● ● ● ● ● ● ● ● User Interaction Satisfaction (All)
1 2 3 4 5 6 7
Terrible Difficult Frustrating Inadequate power
Dull Rigid Unreliable Slow Hard to read Confusing Inconsistent Confusing Difficult Difficult Never Wonderful Easy Satisfying Adequate power Stimulating Flexible Reliable Fast Easy to read Very clear Consistent Very clear Easy Easy Always
Characters on the display
Information organization on the display
Positioning of messages
Messages on screen which prompt user for input:
Learning to operate the glasses
Exploring new features by trial and error
Tasks can be performed in a straightforward manner
● ● ● ● ● ● ● ● ● ● ● ● ● ● ●
Figure 10.Plot of QUIS score for each item.
5.3. Analysis of variance and Interaction plots 275
The participants are described by seven factors: gender, age, role, education skill level, computer 276
knowledge level, internet knowledge level, and organization. Each factor is divided by two levels, 277
except for organizations, which are in three levels. Please note that none of the participants claimed 278
that they have a poor or very poor internet knowledge level. The following section discusses the 279
analysis of variance (ANOVA) of QUIS and of SGUS. In this ANOVA study, SGUS and QUIS scores 280
were investigated for using the application on the AR glasses with six independent variables, i.e., the 281
relationships between: age distribution, gender, roles, highest level of education, organization, and 282
computer knowledge. Therefore, there are 6 main effects and 57 interactions. We are interested in 283
whether there is a relationship between the satisfaction levels (measured by the questionnaire) and 284
these factors. 285
5.3.1. ANOVA of SGUS 286
In this study, we investigated whether the age, gender, roles, computer knowledge level, or 287
different organizations have an effect on the satisfaction of using AR glasses. To determine this, we 288
needed to look at the simple main effects: the main effect of one independent variable (e.g., age) at 289
each level of another independent variable (e.g., for students and for experts). 290
Figure11shows the main effects of the six factors. Participants with different computer knowledge 291
levels have the greatest differences in the SGUS results. This means that the participants with good 292
computer knowledge and poor computer knowledge gave different scores for user satisfaction. The 293
results show that participants with good or very good computer knowledge were, in general, more 294
satisfied with the smart glasses application, and there is a significant effect from computer knowledge 295
levels (F value = 8.87, p = 0.003). The result implies that the SGUS score was affected by the effects of 296
good computer knowledge. 297
Table7shows the summary results of the linear model of the independent variables. The estimate 298
for the model intercept is 54.688 and the coefficient measuring the slope of the relationship with 299
coefficient is significantly different from zero: as the computer skill level increases, so does the 301
satisfaction. The information about the standard errors of these estimates is also provided in the 302
Coefficients table. In the result of the multiple regression model, only 8.8% of the variance in the 303
SGUS scores is explained by each of the factors (Multiple R-squared is 0.088). There is no statistically 304
significant factor that explains the variation in the SGUS scores (overall p value is 0.08). 305
Figure 11.Main effects of SGUS.
Table 7.Results of the linear model of the independent variables.
Source of Variation Estimate Std. Error t value Pr(>|t|)
(Intercept) 54.688 2.652 20.622 <2e-16*** Medicine -1.604 1.835 -0.874 0.384 Engineering -0.996 1.906 -0.523 0.602 Role 2.862 1.624 1.762 0.080 Gender 1.250 1.756 0.712 0.478
Age 0.563 1.634 0.344 0.731
Education level -0.147 1.716 -0.086 0.932 Computer skill 4.324 1.452 2.978 0.003
Signif. codes: *p < 0.05 ; **p < 0.01; ***p < 0.001.
To investigate the interaction, it is interesting to find out whether the SGUS score depends on an 306
interaction between good computer knowledge and the other factors. The two-factor interaction plot 307
is shown in Figure12. The following are the findings from the plot: 308
• Female participants with good computer knowledge have a higher SGUS score than 309
males with good computer knowledge; both females and males with moderate and 310
worse computer knowledge have nearly the same, lower SGUS score (Figure12a). 311
• Participants from medicine with good computer knowledge tended toward a higher 312
SGUS score than participants from engineering, and there is no significant difference 313
between them and the participants with good computer knowledge from astronautics 314
and medicine (Figure12b). 315
• There is no significant interaction between participants with different computer 316
knowledge levels from astronautics and engineering (Figure12b). 317
• There is no significant interaction between students and experts with different computer 318
knowledge levels (Figure12c). 319
• Participants younger than 25 years old with good computer knowledge tended toward 320
than 25 years old with a moderate and worse computer knowledge level tended toward 322
a lower SGUS score (Figure12d). 323
• Participants with secondary school or lower education level and good computer 324
knowledge tended toward a higher SGUS score than participants with a bachelor’s or 325
higher education level and good computer knowledge level. However, participants 326
with secondary school or lower education level and moderate and worse computer 327
knowledge tended toward a lower SGUS score than participants with a bachelor’s or 328
higher education level and moderate and worse computer knowledge level (Figure12e). 329
From the result of the ANOVA table (Table 8), there is insufficient evidence of statistical 330
significance for two-factor interactions, since all p values are higher than 0.05. 331
Table 8.ANOVA results for SGUS with regard to organization, role, and computer knowledge level (reducing factors).
Source of Variation Df Sum Sq Mean Sq F value Pr( >|F| )
Organization 2 77·9 38·95 0·576 0·563
Role 1 184·4 184·39 2·729 0·101
Gender 1 0·2 0·19 0·003 0·958
Age 1 4·2 4·16 0·062 0·805
Education level 1 0·0 0·02 0·000 0·988
Computer knowledge 1 589·3 589·31 8·723 0·004∗ ∗
Education level : Computer knowledge 1 65·0 64·98 0·962 0·329 Gender : Computer skill 1 121·5 121·49 1·798 0·182 Organization : Computer knowledge 2 28·9 14·47 0·214 0·807 Age : Computer knowledge 1 11·6 11·60 0·172 0·679 Roles : Computer knowledge 1 28·6 28·55 0·423 0·517
Residuals 128 8647·7 67·56
Signif. codes: *p < 0.05 ; **p < 0.01; ***p < 0.001.
5.3.2. ANOVA of QUIS 332
In this section, the effect of the six independent variables (age, gender, roles, computer knowledge 333
level, and different organizations) on user interaction satisfaction is reported. Satisfaction includes 334
specific aspects of the interface, usability, and user experience of the AR application. 335
A total of 133 participants were used for this part of the study and completed the questionnaire. 336
The simple main effects are shown in Figure 13. The results obtained by using the ANOVA in 337
Table9indicate that the significance of the two-factor interaction of computer knowledge levels and 338
organizations is not supported since all p values are more than 0.05. Table9also shows that the 339
computer knowledge levels and different organizations have a significant effect on QUIS (p value is 340
(a)
(b)
(c) (d)
(e)
Figure 13.Main effects of QUIS.
Table 9.ANOVA results for QUIS with regard to organization, role, and computer knowledge level (reducing factors).
Source of Variation Df Sum Sq Mean Sq F value Pr( >|F| )
Organization 2 1029·3 514·65 3·279 0·041∗
Role 1 10·4 10·37 0·066 0·798
Gender 1 90·3 90·31 0·575 0·450
Age 1 5·8 5·79 0·037 0·848
Education level 1 32·0 32·02 0·204 0·652
Computer knowledge 1 1138·1 1138·14 7·251 0·008∗ ∗
Education level : Computer knowledge 1 165·5 165·55 1·055 0·307 Gender : Computer skill 1 449·7 449·74 2·865 0·093 Organization : Computer knowledge 2 0·9 0·46 0·003 0·997 Age : Computer knowledge 1 28·2 28·18 0·180 0·673 Roles : Computer knowledge 1 31·8 31·84 0·203 0·653
Residuals 119 18679·1 156·97
Signif. codes: *p < 0.05 ; **p < 0.01; ***p < 0.001.
Figure14shows that in all three organizations, participants with moderate or worse computer 342
levels were given lower scores than participants with good and very good computer levels. There are 343
no significant interactions between them. 344
We selected the factors of organization and computer knowledge level to investigate the 345
interaction between them, and the summary results of the linear model regression (see Table10) 346
shows that the estimate for the model intercept is 73.533, while there is no significant interaction 347
between them. The information about the standard errors of these estimates is also provided in the 348
coefficients table (Table10). From the result of the multiple regression model, 10.6% of the variance in 349
QUIS scores is explained by each of the factors (Multiple R-squared is 0.106). There is a statistically 350
significant factor to explain the variation in the QUIS scores (overall p value is 0.0133). 351
Table 10.Summary results of the linear model of the independent variables for QUIS.
Source of Variation Estimate Std. Error t value Pr( >|t| )
(Intercept) 73.533 3.188 23.063 <2e-16***
Medicine 2.533 4.509 0.562 0.575
Engineering -2.748 3.951 -0.695 0.488
Computer knowledge 5.092 4.064 1.253 0.213 Medicine: Computer knowledge 1.805 5.686 0.317 0.751 Engineering: Computer knowledge 1.539 5.322 0.289 0.773
Signif. codes: *p < 0.05 ; **p < 0.01; ***p < 0.001.
6. Discussion
352
This study established a set of norms to be used for the evaluation of satisfaction of using AR 353
glasses and AR applications. The relationship between each questionnaire item shows weak correlation, 354
both in SGUS and in QUIS. Each questionnaire item is designed for evaluating a specific aspect of 355
satisfaction of the smart glasses and AR applications. From the mean score of both questionnaires, we 356
observe that most of the participants are satisfied with the AR glasses and the AR applications. It was 357
found that the system and content helped the participants to accomplish the task quite well and their 358
attention was captivated in a positive way. In other words, the result shows that the user interface is 359
well designed. The user sees “useful information” displayed next to each part. 360
The main factors age, gender, education level, roles of the participants, and organizations do 361
not have significant effects on the satisfaction of using smart glasses and AR applications. However, 362
computer/internet knowledge level does influence user satisfaction. Participants who have better 363
computer/internet knowledge are more satisfied with the smart glasses and AR applications. There is 364
no significant interaction between all these factors. Since most participants have a moderate level or 365
better than moderate level of knowledge using computers and the internet, it can be predicted that 366
most educated people can easily accept smart glasses and AR applications. 367
Table 11.Summary of findings
Hypothesis number Description Accepted/rejected
H1. Gender matters Rejected
H2. Age matters Rejected
H3. Experts and novices will have different level of user satisfaction
Accepted
H4. Education level matters Rejected H5. Computer knowledge level matters Accepted H6. Internet knowledge level matters N/A H7. Three different test-beds might give different
results
Accepted in QUIS, Rejected in SGUS
H8. There is interaction effects among all these factors
Accepted in SGUS, Rejected in QUIS
Based on the results associated with the seven hypotheses, we outline the following statements:
H1: It is commendable, but surprising that we could not identify any gender differences in 369
satisfaction. One possible explanation for this is that our experiment setup asked for 370
volunteers, so we ended up with only people who were interested in the technology, thus not 371
giving us the option to explore, whether there would be any gender differences in the general 372
population with respect to AR training satisfaction. 373
H2: A possible explanation for not finding any differences in satisfaction levels by age could be 374
that the target group had no prior exposure to AR smart glasses, hence age effects of younger 375
people typically being more open to experimentation of emerging technologies in their home 376
context could not yet affect the picture. 377
H3: It has probably to do with our applications. The recorder is a more complicated application, 378
challenging experts in their interaction. Even if usually, experts would be more technical 379
savvy, in this case, the findings probably reflect more the differences in user friendliness of 380
the applications. 381
H4: Only the space case had people in higher education. Most participants in the aviation test bed 382
come from upper secondary backgrounds. Still, the were no differences found in the impact 383
of education level on user satisfaction. The differences may not be obvious in satisfaction 384
levels, but - judging from observation during trials - there were differences across test-beds 385
with respect to how long it took to explain the applications and their use. The application 386
and the use cases enabled everyone, regardless of whether secondary and tertiary education 387
to use the app. 388
H5: Computer knowledge matters: Better computer knowledge will drive satisfaction with 389
holographic applications. It seems that existing knowledge is still relevant. At the same time, 390
this also clearly indicates that the required support and assistance needs to be provided in 391
order to make the introduction of AR applications on smart glasses a success. Not everyone 392
is a digital native. 393
H6: Internet knowledge matters: All participants in the trial claimed that they have good internet 394
knowledge and very few people claimed that they have poor internet knowledge, so there 395
was no chance to observe any differences. 396
H7: There is no difference between the three test-bedsin SUGS: We did not find significant 397
differences between the three test-beds. This indicates that occupation does not have direct 398
influence on satisfactionof the AR glasses. Procedure oriented trainings seem to be covered 399
well.There are some difference between the three test-bed in QUIS. The medicine test-bed 400
have the highest satisfaction of the AR app, while the engineering test-bed gave the lowest 401
scores. The procedures of the tasks might effect the satisfaction of the AR app. 402
H8: There are no interaction effects for QUIS results but some interaction effects amongst the 403
SGUS results. Young people with good computer knowledge are more satisfied the AR 404
glasses. People with lower education and good computer knowledge are more satisfied with 405
the AR glasses than the others. 406
7. Conclusions
407
This study was started by noting the scarcity of AR applications for hands-on training. As a first 408
step toward incorporating the recorded teaching activities into learning procedures, the AR application 409
was developed on AR glasses. In this work, the Questionnaire for Smart Glasses User Satisfaction 410
(SGUS) and Questionnaire for User Interaction Satisfaction (QUIS) were investigated for augmented 411
reality applications using Microsoft HoloLens. 412
The results of this study show that the approach is feasible. The experts wore the AR glasses to 413
show the process, and the activities were recorded. The AR applications can facilitate the students to 414
learn the process. The results show that the satisfaction of both teaching and learning are acceptable. 415
levels. It also shows that gender, age, education level, and roles of students or experts do not have any 417
effect on user satisfaction. 418
Author Contributions:H.X., P.S., F.W. contributed in the conceptualizing, writing and methodology. H.X. and 419
F.W. performed the analysis. H.X. did validation and visualization. P.S. and F.W. helped in the review. 420
Funding:This study is part of the WEKIT (Wearable Experience for Knowledge Intensive Training) project. It is a 421
European project supported under Horizon 2020 and is aiming to enable smart wearable technology for industrial 422
training. 423
Acknowledgments:We express sincere appreciation to Kaj Helin, Principal Scientist, Project Manager of VTT 424
Technical Research Centre of Finland, and Timo Kuula, Research Scientist of VTT Technical Research Centre of 425
Finland for their modification of questionnaire QUIS and their design of questionnaire SGUS. We thank all the 426
participants and companies for their valuable contributions. 427
Conflicts of Interest:The authors declare no conflict of interest. 428
Abbreviations
429
The following abbreviations are used in this manuscript: 430
431
AR Augmented Reality UI user interface
QUIS Questionnaire for User Interaction Satisfaction SGUS Smart Glasses User Satisfaction
WEKIT Wearable Experience for Knowledge Intensive Training 432
Appendix
21
of
23
Table A1.Spearman’s rank coefficient of correlation of QUIS: the first value of each row represents Spearman’s correlation coefficient, and the second value of each row represents the p value.
QS1 QS2 QS3 QS4 QS5 QS6 QS7 QS8 QS9 QS10 QS11 QS12 QS13 QS14 QS15
QS1 1 0.39 0.53 0.50 0.49 0.34 0.53 0.47 0.17 0.37 0.37 0.28 0.31 0.32 0.44 0.000** 0.000** 0.000** 0.000** 0.000** 0.000** 0.000** 0.05 0.000** 0.000** 0.001 0.000** 0.000** 0.000**
QS2 1 0.53 0.41 0.34 0.30 0.37 0.43 0.16 0.35 0.25 0.33 0.58 0.50 0.52
0.000** 0.000** 0.000** 0.000** 0.000** 0.000** 0.07 0.000** 0.003 0.000** 0.000** 0.000** 0.000**
QS3 1 0.56 0.55 0.39 0.49 0.45 0.16 0.33 0.27 0.22 0.35 0.37 0.40
0.000** 0.000** 0.000** 0.000** 0.000** 0.06 0.000** 0.001 0.009 0.000** 0.000** 0.000**
QS4 1 0.49 0.23 0.42 0.41 0.18 0.35 0.38 0.30 0.27 0.27 0.40
0.000** 0.008 0.000** 0.000** 0.04 0.000** 0.000** 0.000** 0.001 0.001 0.000**
QS5 1 0.22 0.41 0.45 0.14 0.22 0.13 0.14 0.24 0.36 0.34
0.01 0.000** 0.000** 0.11 0.01 0.12 0.10 0.005 0.000** 0.000**
QS6 1 0.36 0.26 0.26 0.18 0.25 0.09 0.28 0.33 0.33
0.000** 0.002 0.001 0.03 0.003 0.28 0.000** 0.000** 0.000*
QS7 1 0.54 0.17 0.38 0.39 0.28 0.24 0.35 0.44
0.000** 0.05 0.000** 0.000** 0.001 0.004 0.000** 0.000**
QS8 1 0.23 0.40 0.26 0.33 0.26 0.40 0.43
0.006 0.000** 0.002 0.000** 0.002 0.000** 0.000**
QS9 1 0.35 0.31 0.31 0.19 0.32 0.24
0.000** 0.000** 0.000 0.024 0.000** 0.005
QS10 1 0.57 0.45 0.27 0.29 0.44
0.000** 0.000** 0.001 0.001 0.000**
QS11 1 0.43 0.25 0.33 0.38
0.000** 0.003 0.000** 0.000**
QS12 1 0.34 0.30 0.42
0.000** 0.000** 0.000**
QS13 1 0.57 0.48
0.000** 0.000**
QS14 1 0.47
0.000**
QS15 1
Signif. codes: *p < 0.05 ; **p < 0.01; ***p < 0.001
doi:10.20944/preprints201810.0594.v2
Peer-reviewed version available at
Computers
2019
,
8
, 9;
References
434
1. Azuma, Ronald T. "A survey of augmented reality." InTeleoperators & Virtual Environments6.4 (1997): 355-385. 435
2. Sherstyuk A, Vincent D, Berg B, Treskunov A. Mixed reality manikins for Medical Education. InHandbook of 436
Augmented reality; Springer: New York, NY, 2011; pp. 479-500, ISBN. 437
3. Ong SK, Shen Y, Zhang J, Nee AYC. Augmented Reality in Assistive Technology and Rehabilitation 438
Engineering. InHandbook of Augmented Reality; Springer: New York, NY, 2011; pp. 603-630, ISBN. 439
4. Nilsson J, Ödblom ACE, Fredriksson J, Zafar A. Using Augmentation Techniques for Performance Evaluation 440
in Automotive Safety. InHandbook of Augmented Reality; Springer: New York, NY, 2011; pp. 631-649, ISBN. 441
5. Ras E, Wild F, Stahl C, Baudet A. Bridging the Skills Gap of Workers in Industry 4.0 by Human Performance 442
Augmentation Tools.Proceedings of the 10th International Conference on PErvasive Technologies Related to Assistive 443
Environments - PETRA ’172017, doi:10.1145/3056540.3076192. 444
6. Perey C, Wild F, Helin K, Janak M, Davies P, Ryan P. Advanced manufacturing with augmented reality.2014 445
IEEE International Symposium on Mixed and Augmented Reality (ISMAR)2014, doi:10.1109/ismar.2014.6948518. 446
7. Olsson T. Concepts and Subjective Measures for Evaluating User Experience of Mobile Augmented Reality 447
Services. InHuman Factors in Augmented Reality Environments; Springer: New York, NY, 2013; pp. 203-232, 448
ISBN. 449
8. Augmented Reality: What Does It Mean for UX? In: Nielsen Norman Group. Available online: https: 450
//www.nngroup.com/articles/augmented-reality-ux/(accessed on 5 Jul 2018). 451
9. Microsoft. Microsoft HoloLens. In: Microsoft HoloLens. Available online: https://www.microsoft.com/en-452
us/hololens/commercial-overview(accessed on 5 Jul 2018). 453
10. Rauschnabel, Philipp A.; Brem, Alexander; Ro, Young K. Augmented Reality Smart Glasses: Definition, 454
Conceptual Insights, and Managerial Importance.Unpublished Working Paper, The University of 455
Michigan-Dearborn, College of Business (2015). Available online:https://www.researchgate.net/profile/ 456
Alexander_Brem/publication/279942768_Augmented_Reality_Smart_Glasses_Definition_Conceptual_ 457
Insights_and_Managerial_Importance/links/5721ec2e08aee857c3b5dd6c/Augmented-Reality-Smart-458
Glasses-Definition-Conceptual-Insights-and-Managerial-Importance.pdf(accessed on 12 Jul 2018) 459
11. Rauschnabel PA, Brem A, Ivens BS. Who will buy smart glasses? Empirical results of two pre-market-entry 460
studies on the role of personality in individual awareness and intended adoption of Google Glass wearables. 461
Computers in Human Behavior2015,49, 635-647,https://doi.org/10.1016/j.chb.2015.03.003 462
12. Wiederhold, Brenda K. "Time to port augmented reality health apps to smart glasses?."Cyberpsychology, 463
Behavior, and Social Networking2013,Volume: 16 Issue 3, 157-158,http://doi.org/10.1089/cyber.2013.1503 464
13. Questionnaire For User Interaction Satisfaction. Available online:http://lap.umd.edu/quis/(accessed on 465
29 Jan 2018). 466
14. Ssemugabi S, de Villiers R. A comparative study of two usability evaluation methods using a web-based 467
e-learning application. Proceedings of the 2007 annual research conference of the South African institute of 468
computer scientists and information technologists on IT research in developing countries - SAICSIT ’072007, 469
doi:10.1145/1292491.1292507. 470
15. Limbu B., Fominykh M., Klemke R., Specht M., Wild F. (2018) Supporting Training of Expertise with Wearable 471
Technologies: The WEKIT Reference Framework. In: Yu S., Ally M., Tsinakos A. (eds) Mobile and Ubiquitous 472
Learning. Perspectives on Rethinking and Reforming Education. Springer, Singapore 473
16. Puneet Sharma, Roland Klemke, Fridolin Wild, Experience Capturing with Wearable Technology in the 474
WEKIT project, SIGWELL 2018 475
17. Fominykh M. D2.4 First Prototype. Available online:http://wekit.eu/d2-4first-prototype/(accessed on 2 476
Sep 2018). 477
18. WEKIT D1.4 Requirements for Scenarios and Prototypes. Available online:http://wekit.studiohangloose.it/ 478
wp-content/uploads/2017/06/WEKIT_D1.4.pdf(accessed on 7 Nov 2017). 479
19. WEKIT D6.4 Implementation of Evaluation Trials in Aeronautics. Available online: http://wekit.eu/wp-480
content/uploads/2017/09/WEKIT_D6.4(accessed on 7 Nov 2017). 481
20. WEKIT D6.2 Annex 1 Training scenario and Evaluation Plan for Engineering. Available online: http: 482
//wekit.studiohangloose.it/wp-content/uploads/2017/06/WEKIT_D6.2.pdf(accessed on 9 Nov 2017). 483
21. WEKIT D6.5 Implementation of Evaluation Trials in Engineering. Available online: http://wekit.eu/wp-484
22. WEKIT D6.6 Implementation of Evaluation Trials in Space. Available online:http://wekit.eu/wp-content/ 486
uploads/2017/09/WEKIT_D6.6(accessed on 5 Jun 2018). 487
23. Chin, John P., Virginia A. Diehl, and Kent L. Norman. InProceedings of the SIGCHI conference on Human factors 488
in computing systems; ACM: New York, USA, 1988; pp. 213-218, ISBN:0-201-14237-6. 489
24. Hall, Douglas T., and Philip H. Mirvis. "The new career contract: Developing the whole person at midlife 490
![Figure 1. With Microsoft HoloLens, a user connects the wires with remote assist [9].](https://thumb-us.123doks.com/thumbv2/123dok_us/8019939.1333820/2.595.156.441.428.587/figure-microsoft-hololens-user-connects-wires-remote-assist.webp)
![Figure 3. A ghost track in WEKIT Recorder mode: (a) recording a ghost track; (b) ghost track replay.Image from [19].](https://thumb-us.123doks.com/thumbv2/123dok_us/8019939.1333820/4.595.79.528.405.630/figure-ghost-track-wekit-recorder-recording-replay-image.webp)
![Figure 5. Example of user interface of WEKIT Player mode. Image from [17].](https://thumb-us.123doks.com/thumbv2/123dok_us/8019939.1333820/5.595.154.439.87.252/figure-example-user-interface-wekit-player-mode-image.webp)

![Table 2. Steps of diagnostic training of radiology students performing an ultrasound examination.[21]](https://thumb-us.123doks.com/thumbv2/123dok_us/8019939.1333820/7.595.99.497.212.490/table-diagnostic-training-radiology-students-performing-ultrasound-examination.webp)