A CALORIM ETRIC STUDY OF THE FORMATION
AND STABILITY OF PH OSPHOLIPID VESICLES
by
Leticia Barriocanal Gil
Thesis submitted for the degree of Doctor of Philosophy
Department of Pharmaceutics School of Pharmacy University of London
ProQuest Number: 10104709
All rights reserved
INFORMATION TO ALL USERS
The quality of this reproduction is dependent upon the quality of the copy submitted.
In the unlikely event that the author did not send a complete manuscript and there are missing pages, these will be noted. Also, if material had to be removed,
a note will indicate the deletion.
uest.
ProQuest 10104709
Published by ProQuest LLC(2016). Copyright of the Dissertation is held by the Author.
All rights reserved.
This work is protected against unauthorized copying under Title 17, United States Code. Microform Edition © ProQuest LLC.
ProQuest LLC
789 East Eisenhower Parkway P.O. Box 1346
ABSTRACT
In this thesis, the application of calorimetric techniques to the investigation of the formation and stability of vesicles, produced via the hydration of a phospholipid film, is described.
The processes of formation of vesicles from natural egg phosphatidylcholine (egg PC) or synthetic dimyristoylphosphatidylcholine (DMPC) films were investigated using solution calorimetry. The formation of phospholipid vesicles in the solution calorimeter comprised hydration o f the phospholipid film and subsequent reorganisation of phospholipid molecules into vesicles. The enthalpy of formation of phospholipid vesicles was exothermic for egg PC, and endothermie for DMPC.
Solution calorimetry was also used to evaluate the effect of cholesterol, non-ionic surfactants, and beclomethasone dipropionate (BDP) on the enthalpy of formation of phospholipid vesicles. The inclusion of 30 or 50 mol % cholesterol in egg PC films significantly increased the enthalpy o f formation of vesicles. The inclusion of increasing amounts of non-ionic surfactants in DMPC films resulted in the solubilisation of the phospholipid bilayer via the lamellar to micelle transition, and consequently, the enthalpies of reaction decreased. The results obtained from films containing cholesterol or non-ionic surfactants indicated that these molecules modified the arrangement of the phospholipids, and had an energetic and molecular effect on the processes of formation o f vesicles. Contrarily, no significant interaction was detected between BDP and egg PC or DMPC.
ACKNOWLEDGEMENTS
I would like to thank my supervisors. Prof. Graham Buckton and Dr. Kevin M. G.
Taylor, for giving me the opportunity to work with them. I will always remember our meetings.
I am very grateful to David McCarthy for all the hours we spent searching for the "worms" and for his beautifiil micrographs. I would also like to thank The School of Pharmacy, University of London, for sponsoring my doctoral project and for financial support.
Last but not least, I thank my parents for their continuous support through school, university, and the "English Doctorado". The education they have provided for me over the years has resulted in the completion of this thesis. I thank them for always believing in me.
Daniel, with who I share a passion for the "beauties and horrors" o f scientific research. I thank him for useful discussions, for being always patient, loving, supporting and understanding, and for helping me so much on every project I
confront.
"It was the best o f times, it was the worst o f times... "
TABLE OF CONTENTS
TITLE 1
ABSTRACT 2
ACKNOWLEDGEMENTS 3
TABLE OF CONTENTS 5
LIST OF ABBREVIATIONS 9
LIST OF TABLES 12
LIST OF FIGURES 13
CHAPTER 1. INTRODUCTION
1.1. Amphiphile molecules 17
1.2. Phospholipids 20
1.2. 1. Chemical structure 20
1. 2. 2. Phospholipid polymorphism 23
1. 2. 3. Transition temperatures of phospholipids 27
1. 2. 4. Phospholipid hydration 28
1. 2. 5. Phospholipid vesicles 29
1. 2. 5. 1. Preparation of phospholipid vesicles 30
1. 2. 5. 2. Characterisation of phospholipid vesicles 31
1.3. Calorimetric techniques 34
1. 3. 1. Calorimetric studies of the fonnation of phospholipid vesicles 35
1. 3. 2. Calorimetric studies of phospholipid vesicles 39
1. 4. Surfactants 40
1.4. 1. Classification of surfactants 40
1. 4. 2. General properties of surfactants 41
1. 4. 3. Micellisation 42
1.5. Interaction of phospholipid vesicles with surfactants 43
CHAPTER 2. MATERIALS
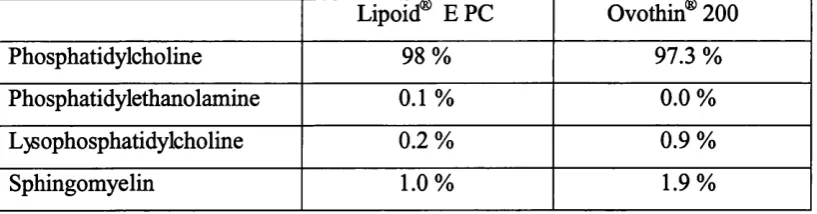
2. 1. Phosphatidylcholines 50
2. 1. 1. Purification of egg phosphatidylcholine 51
2. 1. 1. 1. Materials 51
2. 1. 1.2. Method 52
2. 1. 1.3. Results and discussion 53
2. 2. Surfactants 54
2. 3. Other materials 55
CHAPTER 3. DEVELOPMENT AND VALIDATION OF SOLUTION CALORIMETRY: APPLICATION TO PHOSPHOLIPIDS
3. 1. Introduction 57
3. 2. Calorimetric principles 59
3. 3. Solution calorimetry 60
3. 3. 1. Thermometric 2225 Precision Solution Calorimeter 60
3. 3. 2. General operational considerations 62
3. 4. Programming the experiments 63
3. 5. Sample preparation 64
3. 5. 1. Preparation o f phospholipid films 64
3 .5 .2 . Prehydration of phospholipid films 65
3. 6. Running the experiment 65
3. 6. 1. Temperature equilibration 65
3. 6. 2. Reaction experiment 66
3. 6. 2. 1. Experimental conditions 69
3. 7. Data analysis 70
3. 8. Miscellaneous corrections 71
3. 8. 1. Effects associated with the stirrer rate 71
3. 8. 2. Heat of ampoule breaking 71
3. 9. Standard experiment 72
3. 10. Results and discussion 73
3. 10. 1. Enthalpy o f formation of egg phosphatidylcholine vesicles 73
3. 10. 1. 1. Thermal response o f hydrated egg phosphatidylcholine films 77
3. 10. 1.2. Effect of the sample mass 80
3. 10. 2. Enthalpy of formation of dimyristoylphosphatidylcholine vesicles 84
3. 10. 3. Effect of phospholipid structure on the energetics of formation
of phospholipid vesicles 88
3. 11. Conclusion 91
CHAPTER 4. INTERACTION OF PHOSPHATIDYLCHOLINES AND STEROIDAL MOLECULES: A SOLUTION CALORIMETRY STUDY
4. 1. Introduction 93
4. 2. Method 95
4. 2. 1. Preparation of samples for control experiments 95
4. 2. 2. Preparation of “co-films” 95
4. 2. 3. Solution calorimetry analysis 96
4. 3. Results and discussion 96
4. 3. 1. Response of cholesterol and BDP in the solution calorimeter 96
4. 3. 2. Thermal response of egg PC-cholesterol co-films: effect of
cholesterol 97
4. 3. 3. Thermal response of phospholipid-BDP co-films 100
4. 4. Conclusion 103
CHAPTER 5. CHARACTERISATION OF AQUEOUS DISPERSIONS OF PHOSPHOLIPIDS
5. 1. Introduction 105
5. 2. Transmission electron microscopy 105
5.3. Low Angle Laser Light Scattering 108
5. 4. Isothermal microcalorimetry 109
5.4. 1. Thermometric 2277 Thermal Activity Monitor 110
5. 4. 2. Running the experiments 112
5. 4. 2. 1. The calibration experiment 112
5. 4. 2. 2. The reaction experiment 112
5. 5. Methods 113
5. 5. 1. Preparation of phospholipid dispersions 113
5. 5. 1. 1. Film hydration method 113
5. 5. 1. 2. Calorimetric method 114
dispersions 114
5 .5 .3 . Measurement of dimensions of phospholipid aggregates 115
5 .5 .4 . Laser light scattering analysis of phospholipid dispersions 116
5 .5 .5 . Isothermal microcalorimetry analysis of phospholipid dispersions 117
5. 6. Results and discussion 119
5. 6. 1. Structures observed using transmission electron microscopy 119
5.6. 1. 1. The existence o f “wormlike structures” 119
5. 6. 1.2. Formation of bilayered phospholipid discs 124
5. 6. 1.3. Fate o f bilayered phospholipid discs 128
5. 6. 1.4. The effect of incorporating cholesterol or BDP in
phospholipid films 135
5. 6. 2. Size analysis 137
5. 6. 3. Stability studies 139
5 .6 .3 . 1. Sedimentation, aggregation and fusion 142
5. 6. 3. 2. Bilayer composition 144
5. 7. Conclusion 147
CHAPTER 6. SOLUBILISATION OF PHOSPHOLIPIDS BY NON-IONIC SURFACTANTS AS DETERMINED BY SOLUTION CALORIMETRY
6. 1. Introduction 150
6. 2. Methods 151
6 .2 . 1. Control experiments 151
6. 2. 2. Interaction experiments 152
6 .2 .3 . Transmission electron microscopy analysis 153
6. 3. Results and discussion 153
6 .3. 1. Preparation protocol 153
6 .3 .2 . Enthalpy o f formation of surfactant micelles 154
6 .3 .3 . Enthalpy o f formation of DMPC vesicles 156
6. 3. 4. Enthalpy of bilayer solubilisation 157
6. 4. Conclusion 166
CHAPTER 7. GÉNÉRAL CONCLUSIONS 168
LIST OF ABBREVIATIONS
BDP beclomethasone dipropionate
B.N. batch number
BPF bilayered phospholipid fragment
c concentration
C heat capacity
cmc critical micelle concentration CMT critical micellar temperature DMPC dimyristoylphosphatidylcholine DNA deoxyribonucleic acid
DOPC dioleoylphosphatidylcholine DPPC dipahnitoylphosphatidylcholine DSC differential scanning calorimetry DTA differential thermal analysis
egg PC egg yolk phosphatidylcholine
Eh interaction energy
Eqn. equation
F number o f degrees o f freedom
Fig. figure
G gain of a calorimetric unit GUV giant unilamellar vesicle
H hexagonal
HDL high density lipoprotein HLB hydrophile-lipophile balance
ISO International Organization for Sh ITC isothermal titration calorimetry k heat exchange coefficient K equilibrium partition coefficient
L lamellar
MPS mononuclear phagocyte system
Mw molecular weight
n number
N aggregation number
NIST National Institute o f Standards and Technology NMR nuclear magnetic resonance
maximum number of water molecules per lipid molecule
OG octyl glucoside
P number of coexisting phases
P oblique
PC phosphatidylcholine
PCS photon correlation spectroscopy
PE phosphatidylethanolamine
PEG polyethylene glycol
PS phosphatidylserine
Pr probability
Q cubic
Qc heat input in the calibration experiment
Qp heat change at constant pressure Qr heat evolved by the reaction
R rhombohedral
Re effective ratio
Re" critical effective ratio
R^sat saturating effective ratio R^sol solubilising effective ratio
R f retention factor
R.I. refractive index rpm rotations per minute
Rs resistance of the thermistor
S length of the polar-non polar boundary s.d. standard deviation
SDS sodium dodecyl sulphate
SpM Sphingomyelin
SRM Standard Reference Material
St' total surfactant concentration
SUV small unilamellar vesicle
T temperature
TAM Thermal Activity Monitor
TCDC taurochenodesoxycholate
TEM transmission electron microscopy
TLC thin layer chromatography
Tm main transition temperature
Tp pretransition temperature
Ts subtransition temperature
Too steady-state temperature
VMD volume median diameter
Z number of chemical components
a disordered
P untilted
P‘ tilted
Ô helical
AH^ molar enthalpy of reaction
AH, enthalpy of reaction
AT temperature change
8 calibration constant
y boundary interaction per unit length
0 corrected temperature change
X wavelength
T time constant of the calorimeter
LIST OF TABLES
Table 1.1. Position o f different fatty acids in phosphatidylcholine from various
sources. 22
Table 2.1. Analytical data of the phospholipid composition of egg PC from two
different suppliers 50
Table 2. 2. Chemical and physical data o f the non-ionic surfactants used in Chapter 6. 5 5
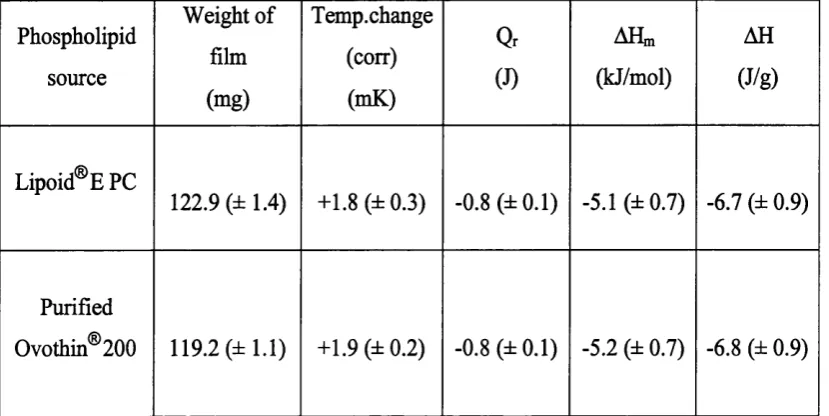
Table 3. 1. Solution calorimetry results for the reaction o f egg PC films in water at
25 °C 7^
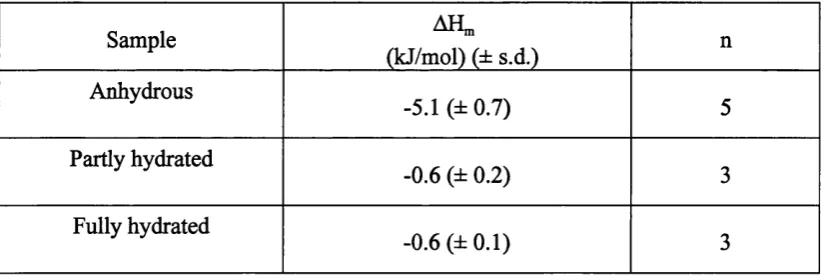
Table. 3. 2. Enthalpies o f reaction of egg PC films (-120 mg) containing differing
amounts o f added water 79
Table 3.3. Solution calorimetry results for the reaction of DMPC films in water at 37 °C
Table 3. 4. Enthalpies of reaction of egg PC and DMPC films in water at 25 and 37
°C respectively 88
Table 4. 1. Enthalpies of reaction of egg PC-cholesterol co-films at various
concentrations in water at 25 °C P7
Table 4. 2. Enthalpies of reaction of egg PC-BDP co-films at various concentrations
in water at 25 °C 101
Table 4. 3. Enthalpies of reaction of DMPC-BDP co-films at various concentrations
in water at 37 °C 101
Table 5.1. Volume median diameter and span o f egg PC dispersions (c = 1.2 mg/ml)
prepared by two different procedures 138
LIST OF FIGURES
Fig. 1.1. Schematic diagram of an amphiphile molecule. 77
Fig. 1.2. Arrangement of single-tailed amphiphiles in aqueous medium. 79
Fig. 1.3. Arrangement of double-tailed amphiphiles in aqueous medium. 79
Fig. 1.4. Chemical structure of (A) glycerol and (B) glycerophospholipids. 21
Fig. 1.5. Some characteristic phospholipid phases in schematic representation. 25
Fig. 1.6. Phase diagrams of egg PC-water and DMPC-water mixtures. 25
Fig. 1.7. Schematic representation of the formation of MLVs upon hydration of a dry
phospholipid film proposed by Lasic (1988). 36
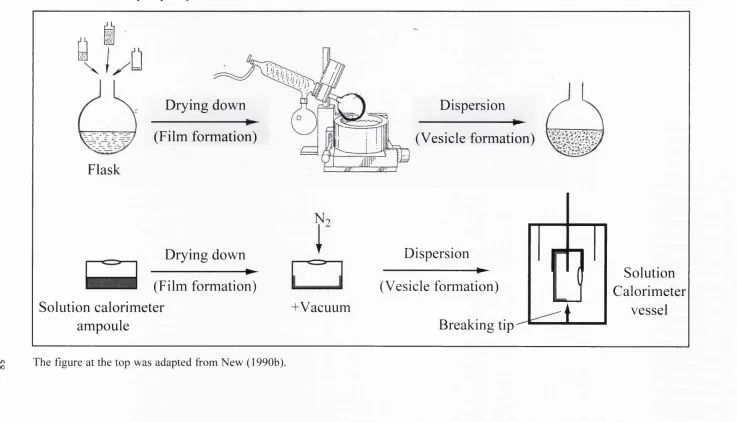
Fig.2.1. General chemical formula of alcohol ethoxylate non-ionic surfactants. 54 Fig.3.1 Schematic representation showing the transfer of the traditional film
hydration procedure from the flask to the solution calorimeter to form
phospholipid vesicles. 58
Fig.3.2. Calorimetric unit of the Thermometric 2225 Precision Solution Calorimeter. 61
Fig.3.3. An example experiment where an egg PC film was dispersed in water at 25
°C showing a plot of temperature versus time. 67
Fig.3.4. Typical thermograph for the reaction of an egg PC film (-120 mg) in water
at 25 °C. 73
Fig.3.5. Typical power-time curve for the reaction of an egg PC film (-120 mg) in
water at 25 °C. 77
Fig.3.6. Power-time curve for the reaction of a film (-120 mg) containing degraded
egg PC in water at 25 °C. 81
Fig.3.7. Enthalpies o f reaction of egg PC films containing various amounts of
chloroform in water at 25 °C. 84
Fig.3.8. Typical thermograph for the reaction of a DMPC film (-120 mg) in water at
37 °C. gd
Fig.3.9. Typical power-time curve for the reaction of a DMPC film (-120 mg) in
water at 37 °C. 87
Fig.3.10. Power-time curves for the reaction of (A) 120 mg egg PC and (B) 120 mg DMPC in water at 25 °C and 37 °C respectively 9 9
Fig.4.2. Power-time curve for the reaction of egg PC-cholesterol co-films in water at
25 °C. 98
Fig.5.1. A transmission electron microscope. 106
Fig.5.2. Representation of electron images of negatively stained specimens. 107
Fig.5.3. Diagram of a conventional laser light scattering instrument. 109
Fig.5.4. Schematic diagram showing the thermopiles located between the measuring cup and the heat sink in a heat conduction calorimeter. 110 Fig.5.5. Components of the TAM and a microcalorimetric u n it. I l l
Fig.5.6. Thermometric Titration Unit with a stainless steel ampoule attached at the
base. 118
Fig.5.7. Transmission electron micrograph of an egg PC (Lipoid® E PC) dispersion prepared by the film hydration method, showing MLVs. 120
Fig.5.8. Transmission electron micrograph of an egg PC (Lipoid® E PC) dispersion prepared by the film hydration method, showing a wormlike structure. 120 Fig.5.9. Transmission electron micrograph of an egg PC (Lipoid® E PC) dispersion
prepared by the calorimetric method, showing a wormlike structure. 121 Fig.5.10. Transmission electron micrograph of a DMPC dispersion prepared by the
film hydration method, showing MLVs. 122
Fig.5.11. Transmission electron micrograph of a DMPC dispersion prepared by the film hydration method, showing wormlike structures. 123
Fig.5.12. Formation of bilayered phospholipid fragments using different vesicle
preparation methods. 124
Fig.5.13.A Transmission electron micrograph o f an egg PC (Lipoid® E PC) dispersion prepared by the film hydration method, before vortexing. 125
Fig.5.13. Transmission electron micrographs of an egg PC (Lipoid® E PC) dispersion (film hydration method) after vortexing for (B) 1 min and (C) 3 min. 126
Fig.5.14. Transmission electron micrograph of an egg PC (Lipoid® E PC) dispersion vortexed for 3 min, showing populations of MLVs and wormlike structures. 127
Fig.5.15. Transmission electron micrograph of an egg surfactant (Lipoid® E PC-Ci2(EO)7) dispersion, showing wormlike structures. 128
Fig.5.16. Diagrammatic representation of a mixed phospholipid-surfactant disc. 129
Fig.5.17. Schematic representation of vesicle formation from small discs of
phospholipid bilayer. 130
prepared by the calorimetric method and stored for 3 days at 4 °C. 131
Fig.5.19. Transmission electron micrograph of an egg PC (Lipoid® E PC) dispersion prepared by the film hydration method, stored for 24 h at 4 °C and vortexed
for 10 min. 131
Fig.5.20. Transmission electron micrograph of bending phospholipid discs. 132
Fig.5.21. Schematic representation of the interleaving of folded lamellar structures as
seen in the micrograph shown in Fig.5.20. 132
Fig. 5.22. Schematic representation of the mechanism proposed for the stabilization of
bilayered phospholipd discs. 133
Fig.5.23. Transmission electron micrograph of an egg PC (purified Ovothin® 200) dispersion prepared by the film hydration method and annealed for 90 min at room temperature showing the aggregation and interconnection of MLVs. 134
Fig.5.24.A. Transmission electron micrograph of an egg PC (Lipoid® E PC)- cholesterol dispersion (30 mol % cholesterol) prepared by the calorimetric
method. 135
Fig.5.24.B. Light microscopy video-picture of an egg PC (Lipoid® E PC)-cholesterol dispersion (30 mol % cholesterol) prepared by the calorimetric method. 136
Fig.5.25. Transmission electron micrograph of an egg PC (Lipoid® E PC) - BDP dispersion (2 mol % BDP) prepared by the calorimetric method. 136
Fig.5.26. Transmission electron micrograph of an egg PC- BDP dispersion (3 mol %
BDP) prepared by the calorimetric method. 137
Fig.5.27. Power-time curve for an egg PC dispersion prepared by the film hydration method and analysed in the TAM at 25 °C for 7 days. 140
Fig.5.28. Power-time curves for three different egg PC dispersions prepared by the film hydration method and analysed in the TAM at 25 °C for 3 days. 141
Fig.5.29. Power-time curve for an extruded (0.1 pm) egg PC dispersion analysed in
the TAM at 25 T . 144
Fig.5.30. Power-time curves for egg PC-cholesterol dispersions prepared by the film hydration method and analysed in the TAM at 25 °C for 3 days: (A) 30 mol
% cholesterol, (B) 50 mol % cholesterol. 145
Fig.5.31. Schematic representation o f the mechanisms o f formation and
destabilisation of phospholipid vesicles. 148
°C. 755 Fig.6.2. Power-time curve for the formation o f DMPC vesicles at 37 °C. 156
Fig.6.3. Schematic diagram o f the different stages o f the solubilisation of 157
phospholipids by surfactants.
Fig.6.4. Enthalpy-concentration curves for co-films containing (A) DMPC-Cio(EO)3 159
(B) DMPC-Cio(EO)5 and (C) DMPC-Ci2(E0)y .
Fig.6.5A. Enthalpy-concentration curve and power-time curves for co-films 160
containing DMPC-Cio(EO)3.
Fig.6.5B. Enthalpy-concentration curve and power-time curves for co-films 163
containing DMPC-Cio(EO)5.
Fig.6.5C. Enthalpy-concentration curve and power-time curves for co-films 164
containing DMPC-Ci2(E0 )y.
Fig.6.6. Transmission electron micrographs o f dispersions containing (A) DMPC, (B) 165
C H A P T E R 1. IN T R O D U C T IO N
1. 1. Amphiphile molecules
The name amphiphile (amphiphilic, or amphiphatic) is derived from the Greek words
“am phi” and “philos” meaning “both” and “loving” respectively. The term relates to
the fact that amphiphile molecules contain one part that has “sym pathy” and an other
that has “antiphaty” for water. The hydrophobic group has very little attraction for
water, whereas the hydrophilic group has strong attraction for water. The hydrophilic
part is referred to as the polar head and the hydrophobic part as the tail (Fig. 1.1.). The
polar head may be ionic (anionic or cationic), non-ionic or zwitterionic (both positive
and negative charge). The hydrophobic part o f the molecule is normally a
hydrocarbon residue (linear, branched or cyclic).
Fig. 1.1. Schematic diagram of an amphiphile molecule.
Hydrophobic tail
Polar head
Amphiphile molecules in aqueous solutions, and at low concentrations, accumulate as
monomers at the air-water surface. Molecules characterised by their tendency to
adsorb at surfaces and interfaces are known as surfactants, an abbreviation o f surface
active agents which means active at a surface. The term interface refers to a boundary
between any two immiscible phases, whereas the term surface indicates that one o f
lower the free energy at the phase boundary and decrease the interfacial tension between two phases (interfacial free energy per unit area of the boundary). The limit to the interfacial lowering effect is reached when the surface is saturated. At the point of saturation, amphiphile molecules begin to self assemble into aggregate structures in the bulk solution forming micelles or bilayers.
The concentration at which amphiphile molecules start to aggregate is called the critical micelle concentration (cmc). The morphology of the aggregates depends on the structure of the amphiphiles, temperature, water content, etc. The term micelle defines aggregates of water-soluble amphiphiles (e.g., single-chain amphiphiles), whereas the term bilayer refers to the self-aggregation of non-water soluble amphiphiles (e.g., phospholipids). As shown in Fig. 1.2. and Fig. 1.3., micelles with the hydrophobic tails pointing inward or bilayers with the hydrophobic tails sandwiched between the polar heads groups are formed in aqueous medium.
Fig.1.2. Arrangem ent of single-tailed amphiphiles in aqueous medium.
a i r
u u
m onom er water
m i c e l l e
Fig.1.3. Arrangem ent of double-tailed amphiphiles in aqueous medium.
water water
water phospholipid
bilayer
water
vesicle
Phospholipid vesicles in which an aqueous compartment(s) is entirely enclosed by
one or more phospholipid bilayers were described in the 1960s (Bangham and Home,
1964). Phospholipid-based vesicles, known as liposomes, have been used as model
membrane systems (Papahadjopoulos and Bangham, 1966; Portis et al., 1979). The
value o f liposomes as model membrane systems derives from the fact that they can
be constm cted o f natural constituents such that the liposome membrane forms a
bilayer structure which is in principle very similar to the lipid portion o f natural cell
occurred in the 1970s when their carrier potential was described. Depending on their chemical properties, substances can be entrapped in the aqueous compartments (water-soluble substances) or accommodated in the lipid phase of liposomes (hydrophobic substances) (Gregoriadis et al., 1971). Amphiphiles interacting with phospholipids embed the hydrophobic part of the molecule in the phospholipid hydrocarbon region. Phospholipid-based vesicles have been extensively used as carriers o f different agents such as amphiphilic, hydrophobic, and water soluble
drugs, proteins and nucleic acids (Gregoriadis and Florence, 1993). Liposomes are used as delivery systems because they can target a substance to the site o f action in the body, act as a slow release depot, protect the enclosed substance from the action of degradative substances (e.g., enzymes) in the body, protect the patient against toxic effects o f the carried substance, and promote the intracellular delivery o f the entrapped molecule (Storm and Crommelin, 1998).
Despite their application in various scientific disciplines, nearly forty years after the description of phospholipid vesicles in aqueous dispersions their mechanism of formation remains unclear (Lasic, 1999). Moreover, the stability of phospholipid dispersions in the long term is still being questioned (Grit and Crommelin, 1992). These topics which are still not well understood, namely formation and stability of phospholipid vesicles, and interaction between phospholipids and other amphiphile molecules such as non-ionic surfactants, were the focus of the investigations described in this thesis.
1. 2. Phospholipids
1. 2 .1 . Chemical structure
In monoacylglycerophospholipids, or lysophospholipids, only one hydroxyl group is substituted. In diacylglycerophospholipids the hydroxyl groups in positions 1 and 2 are esterified to fatty acid chains. In all glycerophospholipids a polar head group is attached to the 3-position o f the glycerol backbone. The polar head of glycerophospholipids is normally a zwitterionic group with both an anionic (e.g., phosphate) and a cationic charge (e.g., quaternary ammonium). Choline covalently bound to phosphoric acid is the polar head found in the naturally occurring diacylglycerophospholipids known as phosphatidylcholines (PCs).
Fig. 1.4. Chemical structure of (A) glycerol and (B) glycerophospholipids.
CHrOH
C H -O H
,1
CHjOH
B
R l — 0 — C H _
2 1
R 2 — 0 — C H
. 1 9
C H ^ O — P — 0 — R 3
O
R1 and R2 are fatty acid chains. R3 is a cationic group. R3 = (CH2)2N+(CH3)3 in phosphatidylcholine.
represented as R2 in Fig. 1.4. is imsaturated, while the chain in position R1 is usually saturated. Table 1.1. shows proportional distributions of saturated and unsaturated acids in positions 1 and 2 of PC from different sources. The fatty acid chains of PCs from plant sources have a high level of polyunsaturation, while those from mammalian sources contain higher proportion of fully saturated chains (New, 1990a).
Table 1. 1. Position of different fatty acids in phosphatidylcholine from various
sources
Abbreviation Common name
Egg yolk PC Soya bean PC Rat liver Position
1
Position
2
Position
1
Position
2
Position
1
Position
2
16:00 palmitic 68.8 1.8 34.4 - 23.3 5.6
18:00 stearic 25.8 1.2 7.6 - 64.9 3.8
18:01 oleic 4.7 48.9 30.2 15.8 7.4 13.3
18:02 linoleic 0.2 11.1 23.8 71.8 1.3 22.5
18:03 linolenic 0.5 - 4.0 13.1 - 1
20:04 arachidonic - 2.1 - - 0.2 39.4
20:05 - - 7.1 - - -
-22:05 - - 2.6 - - -
-22:06 - - 25.2 - - - 7.0
Fatty acid biosynthesis in most organisms involves building up the fatty acid chains in two-carbon units at the carboxyl end from an acetyl-CoA primer. Therefore, fatty acid chains from natural sources have almost exclusively even numbers o f carbons in the hydrocarbon chain. The process o f chain elongation continues uninterrupted until the formation of palmitic acid (Cl 6:0), which is the fatty acid of shortest chain length usually found in mammalian phospholipids. At this stage, the first double bond is
introduced into the 9-position. Further unsaturations are added in such a way that each unsaturation is normally separated by one methylene group (Longmuir, 1993; New,
1990a).
1. 2. 2. Phospholipid polymorphism
Phospholipids at concentrations above the cmc when dispersed in water form aggregates with a certain type of symmetry depending on the nature of the phospholipid and the physicochemical state of the system (temperature, amount of water, presence of salts and other additives, pH). These hydrated lipid aggregates are known as mesomorphic phases. The term mesomorphic (“meso” = intermediate + “morphe” = form) refers to intermediate morphological stages. These structures display the characteristics of phases in the thermodynamical sense, e.g. they follow the Gibb’s phase rule (Eqn. 1.1, Eqn. 1.2.) and exhibit phase transitions:
F = Z - p + 2 Eqn.1.1.
or at constant pressure:
F = Z - p + 1 £ q n .l.2 .
where
F is the number of degrees o f freedom.
The appearance of the mesophases depends on the temperature (thermotropic mesomorphism) and the amount of water (lyotropic mesomorphism). Thermotropic mesomorphism indicates that when phospholipids are heated up to the capillarity melting point they do not pass directly from a solid state to a liquid, but that at intermediate temperatures they exist in the liquid crystalline state. Lyotropic mesomorphism implies that when a limiting concentration of water is reached, further addition of water results in a two-phase system of water and the maximally hydrated lamellar phase.
Mesophases range from crystals, gels, liquid-crystals, to micellar solutions. Crystals exhibit full ordering, liquid crystals exhibit varying degrees o f order between the crystal and the fluid state, and micellar solutions exhibit little or no order. The mesomorphic phases are named with an upper-case Latin letter to characterize the periodicity of the lattice (Luzzati, 1968). The following letters are commonly used:
L = one-dimensional, lamellar H = two-dimensional, hexagonal
P = two-dimensional, oblique or centered (rippled) Q = three dimensional, cubic
R = three dimensional, rhombohedral
A Greek subscript is used to denote the chain conformation of the mesophase, for example:
a = disordered, fluid-like
p = untilted, partially ordered, gel-like P‘ = tilted, partially ordered, gel-like
6 = partially ordered (helical), gel-like
Fig. 1.5. shows some o f the characteristic phospholipid phases. The conditions o f
temperature and concentration over which every type o f mesophase exist may be
indicated by a phase diagram (Fig. 1.6.). Phase diagrams describe the regions o f
existence o f different phases.
Fig.1.5. Some characteristic phospholipid phases in schematic representation.
Phosphatidyl Choline
Phosphatidyl Ethanolam ine
G el P h a s e R ipple P h a s e Liquid C ry stallin e P h a s e
mmrn
mmm
.
mm
mmm
k .
9mm
mmmm
mmm
L,. L.,
From Gennis (1989).
Fig.1.6. Phase diagrams of egg PC-water (left) and DMPC-water (right) mixtures.
1 p h a s e (liquid)
250 2 p h a s e s (2 liquids)
N e a t
200
2 p h a s e s ( liquid an d liq u id -c ry s tal)
150
N e a t (la m e lla r)
100
C ry s ta l and liquid crystal
100 % w a te r
% w a te r
Solid-like crystalline lamellar (L^) phases are formed at low temperatures and/or hydrations by almost all phospholipids (Pascher et al., 1992). These phases exhibit both long- and short- range order in the three dimensions. Three-dimensional lamellar crystals may be anhydrous or may contain a number of water molecules of crystallisation. For instance, DMPC crystallizes from a water-containing solution, with two water molecules of hydration (Pearson and Pascher, 1979).
At low temperatures, and normally in the presence of water, gel phases are formed. In these phases the hydrocarbon chains are still ordered {dX\-trans conformation) but they undergo long-axis rotation. Two-dimensional lamellar crystals consisting of crystalline bilayers, not regularly stacked, exist in water at low temperature forming the so-called sub-gel phases (Blaurock and McIntosh, 1986). Within the two- dimensional solid-like lamellar phases a number of phases exist that are partly disordered, e.g. Pp> and P§. In the Pg, phase ribbon-like strips o f bilayer are packed onto a two dimensional lattice, this phase is found in the anhydrous side of PC phase diagrams (Tardieu and Luzzati, 1973).
al., 1988). The three-dimensional fluid phases can present cubic, rhombohedral, tetragonal and orthorhombic symmetry (Luzzati, 1968). Phospholipid micelles are fluid phases typically formed by phospholipids with 6 or 8 carbon atoms in the alkyl chain and by lysophospholipids at high dilutions in water (Luzzati, 1968).
1. 2. 3. Transition temperatures of phospholipids
As described in previous sections, dry and partly hydrated phospholipids at low temperatures form crystal structures. At the subtransition temperature (TJ, two dimensional lipid crystals transform into a more expanded gel phase of the P or P’ type with untilted or tilted chains respectively (Chen et al., 1980).
At the Tqj, the phase transition from gel to liquid-crystal results from a change in the conformation of the lipid hydrocarbon chains. In the gel state the lipid hydrocarbon chains exist predominately in a rigid, extended, d\\-trans conformation while in the liquid-crystalline state the hydrocarbon chains exist in a flexible, folded conformation containing a number of gauche conformations (Jacobson and Papahadjopoulos,
1975).
The gel to liquid crystalline phase transition temperature depends primarily on the length and chemical structure of the hydrocarbon chain, and is secondarily dependent on the structure of the phospholipid polar head group (Cevc, 1987). In general, increasing the chain length of the phospholipid hydrocarbon chains increases Tp and T^. Chain unsaturation and branching mimic the consequences o f chain shortening (decrease the transition temperatures). The effect of chain unsaturation on the chain melting phase transition depends on the position rather than on the number of unsaturations (Cevc, 1991b; Lynch and Steponkus, 1989). Phospholipids with double bonds halfway between the glycerol backbone and the end o f the hydrocarbon chain have the lowest T^ for a given chain length. The conformation of the double bond determines the effect of the unsaturation, the effect of double bonds in a trans
configuration being significantly weaker than cis double bonds in the same position (Cevc, 1991b). Membranes made from egg PC (mixed saturated and unsaturated chains) have a T^ equivalent to -10 ± 5 °C, compared with 23.5 °C for synthetic DMPC (14:0) (Cevc, 1993c).
1. 2. 4. Phospholipid hydration
The interaction between water and phospholipid bilayers is affected by the structure of the lipid. Parameters such as electrical charge of the head group and length and unsaturation level of the phospholipid hydrocarbon chains determine the hydration properties of the phospholipids (Jendrasiak and Smith, 2000).
hydration are located in the fluid space between adjacent bilayers (Small, 1967; Pearson and Pascher, 1979; McIntosh et al., 1987). The bound water (“hydration shell”) gives rise to a repulsive force towards other hydrated surfaces playing an important role in bilayer stability. This so-called hydration force prohibits the spontaneous attachment and fusion of membranes (Rand and Parsegian, 1989; Hauser, 1993).
1. 2. 5. Phospholipid vesicles
At concentrations above the cmc and temperatures above the T^, phospholipids aggregate in water, forming liquid crystalline phases. The principle governing the aggregation of phospholipids is minimization of the free energy (see section 1.1.).
1. 2. 5 .1 . Preparation of phospholipid vesicles
In the 1960s it was observed that dispersions of phospholipids in water contained vesicles consisting of one or several phospholipid bilayers in the liquid crystalline state separated by the aqueous solvent (Bangham and Home, 1964). Since this observation, many procedures have been developed to produce vesicles of different lamellarity and size. MLVs are spherical vesicles comprising concentrically arranged, equally spaced bilayers that are separated by layers o f aqueous solvent. Unilamellar vesicles are spherical with one phospholipid bilayer separating the internal and external solvent (Hauser, 1993).
MLVs are usually prepared according to the traditional method developed by Bangham et al. (1965). In this method the phospholipid is dissolved in chloroform or other organic solvent, and the solvent is evaporated under vacuum until a thin phospholipid film is formed on the inner walls of a round flask. Addition of water to the phospholipid film and agitation follow. The flask is agitated for about 1 hour to free the film from the wall, forming a phospholipid dispersion. The dispersion is then allowed to equilibrate at room temperature or used directly. The addition of the aqueous solvent and the dispersion of the phospholipid are carried out at temperatures above the T^. The resulting MLVs are heterogeneous in size varying from 1 to 10 pm.
The methods available for the preparation of unilamellar vesicles are based on one of three basic procedures:
i) Mechanical disruption of MLVs (e.g., sonication or extrusion). As a result of energy input the bilayers undergo repeating dismption-resealing cycles producing unilamellar and oligolamellar vesicles (Barenholz et al., 1979).
iii) Dilution by water of a solution o f phospholipid in an organic water-soluble solvent (e.g, solvent injection and reverse phase evaporation). Phospholipids dissolved in organic solvents preferably form inverted micelles that are capable o f taking up and solubilising large quantities of water (Walde et al., 1990). The inverted micelles with their associated water form a water-in-oil microemulsion which is the starting phase of this procedure. The inverted micelles are destabilised by removing the organic solvent and the phospholipids rearrange into small unilamellar vesicles (SUVs) or LUVs.
1. 2. 5. 2. Characterisation of phospholipid vesicles
Liposome behaviour in vitro and in vivo depends on physical properties o f the vesicles such as morphology, lamellarity, size, size distribution, bilayer composition, and surface properties (surface charge density, surface polarity, surface potential).
Unilamellar vesicles are divided according to their size into SUVs with diameters under 100 nm, LUVs with diameters larger than 100 nm and giant unilamellar vesicles (GUVs) with diameters larger than 1 pm (Hauser, 1993). The size of MLVs can vary from 1 to 20 pm but a homogeneous size distribution can be obtained if the vesicles are produced under vigorous agitation. Sonication and extrusion also provide a means o f homogenising the particle size.
approximation which assumes that the particle is much larger than the wavelength of the light employed, all sizes of particles scatter with equal efficiencies and the particles are opaque and transmit no light. In practice particles larger than the wavelength of the light employed are defined as the particle size being greater than 40 times the wavelength of the light employed (ISO 13320). For example, 25 |im when a He-Ne laser is used.
Modem instruments use the Mie theory which assumes the volume of the particle as opposed to Fraunhofer which is a projected area prediction. Mie theory assumes spherical particles which produce the same scattering intensity as the particles being measured. Mie theory applies to spherical, isotropic (equal scattering intensities in all directions) particles with known refractive index (R.I.). Mie theory does not apply to multiple scattering, therefore particles must be widely separated in the liposomal dispersion so that the instrument measures the scattering from individual particles. Usually modem instmments are provided with a means to detect that the correct amount of sample is being used.
Low Angle Static Laser Light Scattering (SLS), known as static, elastic or classical light scattering, allows the measurement of particles in the range from 0.1 to 200 jim. For small particles (1 nm-1 jim) photon correlation spectroscopy (PCS), also known as dynamic or quasi-elastic light scattering, is used. PCS instmments measure the Brownian motion and relate this to the size of the particles. In PCS the intensity fluctuations of scattered light arising from small particles are measured. Small particles are much smaller than the wavelength of incident light, e.g. particles smaller than about one twentieth of the wavelength, that is, smaller than 20-30 nm, when using aHe-Ne laser with X = 633 nm. A PCS instmment usually consists of a He-Ne laser used as the light source, the sample area, a detector with a photomultiplier, a correlator where the intensities of the scatterd light are converted into electrical pulses and a data analyser.
water. Optical microscopy, transmission electron microscopy (TEM), freeze-jfracture electron microscopy, cryoelectron microscopy and atomic force microscopy have been used to investigate phospholipid dispersions (Cevc, 1993b). Originally MLVs were visualised in egg PC dispersions using negative staining TEM (Bangham and Home, 1964), and TEM was also used to show egg PC-cholate bilayered discs (Fromherz and Rüppel, 1985) and stacks of discoid micelles of phosphatidylinositol bisphosphate with divalent cations (Flanagan et al., 1997). Imaging presents directly
the structure of vesicles. However, artefactual images may be observed. When using scattering or microscopy data, care must be taken not to interpret a limited number of measurements or images as being truly representative of the bulk sample. The optimum strategy for characterisation studies is to combine imaging, scattering and other physical and chemical characterisation techniques.
1. 2. 5. 3. Stability of phospholipid vesicles
The shelf-life of liposomal preparations is limited by the chemical and physical instability of the phospholipids. The chemical instability of phospholipids concerns the hydrolysis of the ester bonds and the oxidation of the unsaturated acyl chains, if present. Hydrolysis reactions in aqueous liposomal dispersions are pH and temperature dependent (Grit et al., 1993).
advantageous to include sufficient cholesterol in the membrane, particularly if the is in a temperature range close to that at which the liposomes will be stored or handle (New, 1990b). The addition of cholesterol to phospholipid suspensions in water restricts the motion of the CH2 groups of the hydrocarbon chains of the phospholipids, decreases the surface area per phospholipid molecule and increases the thickness of the lipid bilayer. In contrast to these effects observed with phospholipids above their Tjn, cholesterol tends to liquify phospholipid membranes which are normally below their gel to liquid-crystalline transition temperature (Papahadjopoulos et al., 1972). It thus appears that the addition of cholesterol to phospholipids modifies their molecular packing, and the mixed membranes are more condensed when compared to the pure phospholipids below their T^.
Aggregation (and sedimentation) of neutral liposomes is brought about by van der Waals interactions, and tends to be more pronounced in large vesicles where the increased planarity of the membranes allows greater areas of membrane to come into contact with each other. Factors such as residual solvent and trace elements can enhance the process.
The physical stability of liposomes is also determined by phase transitions which in liposomal preparations can be of two types: chain melting transitions and fluid phase transitions. Phase transitions can be induced by changes in temperature, but they may also be induced isothermally by changes in water content, pH, salt concentration, etc. Phospholipid phase transitions have been widely studied by differential scanning calorimetry (DSC) (see section 1.3.2.). This technique and other calorimetric methods are discussed in the following sections.
1. 3. Calorimetric techniques
thermally insulated container where a chemical or physical process can take place and the heat exchange between the reaction system and its environment can be measured.
In the past 50 years, the evolution of calorimetry has shifted from low-temperature calorimetry and combustion calorimetry towards solution calorimetry, isothermal microcalorimetry for stability studies and titration calorimetry for interaction studies (Domalski et al., 1996; Kemp and Lamprecht 2000). Binding reactions in phospholipid systems have been investigated by isothermal titration calorimetry
(ITC) where the change of heat is measured as a function of the amount of titrant added (Lehrmann and Seelig, 1994; Trandum et al., 1999). However, the
thermodynamic instability o f phospholipids vesicles and their intermediate stages has limited the application of calorimetric techniques to phospholipid systems. On the other hand, the non-specific nature of heat measurements often makes it difficult to interpret calorimetric results. Nevertheless, calorimetric data is necessary for understanding the hydration of lipids and the formation and stability o f phospholipid vesicles. The project described in this thesis investigated the application of solution calorimetry (discussed more fully in Chapter 3) and isothermal microcalorimetry (discussed more fully in Chapter 5) to phospholipid systems in excess water.
1. 3 .1 . Calorimetric studies of the formation of phospholipid vesicles
It is known that phospholipids in the absence and presence of water form ordered, usually lamellar, bilayer structures (Hauser et al., 1981). However, the mechanism of formation of MLVs is still not well understood (Lasic, 1999). Based on the growth of myelin figures from hydrated phospholipids seen in the phase contrast light microscope (Harbich and Helfiich, 1984), Lasic proposed a geometrical mechanism o f formation (Lasic, 1988). Lasic’s model of vesicle formation is schematically
is a compromise between the repulsive and attractive forees. Upon agitation these
tubes detach and immediately seal off their exposed edges and form MLVs. They are
not necessarily spherical but rather oval in shape because o f the nature o f their
formation.
Fig.1.7. Schematic representation of the formation of MLVs upon hydration of a dry phospholipid film proposed by Lasic (1988).
X
• HjO777777777777777777777777777777 •7777777777777777777777777777777 / )> mu f ) tn f.V}/
ttttttttttttttttttttttttttt
fH,0 + M,0
vntinnn/mnijifnn
Attempts have been made to explain the above geometrical model from an energetic
view point. Lasic sum m arized his geom etrical model o f form ation and the
destabilisation o f MLVs as shown in Eqn.1.3. (Lasic, 1990; Lasic, 1999):
dry lipid fdrn (smectic) + excess water myelin figures M L V s ^ ^
The top line in Eqn.1.3. sumarizes how MLVs are formed. Smectic designates a state o f a liquid-crystal in which the molecules are oriented in parallel and arranged in well defined planes. According to Lasic (1988) dry phospholipid films swell in water forming myelin figures. The growth o f myelin figures is the result of a curvature imposed in the system due both to an increase of the area of polar heads with hydration, and to the slow penetration of water through the bilayers. The stability of these intermediates depends on opposing interfacial forces. The attractive force is given by the interfacial free energy per unit area (interfacial tension). The repulsive forces include steric repulsion between lipid hydrocarbon chains, and steric and electrostatic forces between head groups. The input of energy (e.g., agitation) causes the tubules to detach and immediately seal off the exposed edges to form MLVs. The basis of the sealing of the exposed edges is to shield the exposed hydrocarbon core from the polar environment. By bending and closing upon themselves the unfavorable exposure at the edge is eliminated. The bottom line in Eqn. 1.3. shows that after MLVs are formed, they transform into planar, fully hydrated lamellae in excess water. Positive energy on the right side of the equation indicates an exothermic reaction. The time scale for the disapearance of curved MLVs depends on the composition of the liposomes. In most of the liposomal systems, this changes are rather fast. However, liposomes made from certain components (eg., lipid extracts from viral membranes) may be stable for years (Lasic, 1982).
Above, a theoretical model of the energetics o f phospholipid vesicle formation has been described however, experimental calorimetric data o f the process is still lacking. It has been proposed (Lasic, 1990) that for understanding the thermodynamic stability o f MLVs two main questions must be answered:
i) What is the mechanism of MLV formation?
ii) What is the equilibrium state o f phospholipids in water?
Lasic summarized the current answers to these questions as follows:
ii) MLVs are not the minimum free energy state a phospholipid system can
achieve. With passing of time most liposome dispersions transform into planar, flat, fully hydrated equidistant lamellae in excess water.
For the interpretation of the process of MLVs formation, it may be divided in two main stages: hydration of the phospholipid film and transformation of the intermediate structures into vesicles. Calorimetric data on the hydration of
phospholipid bilayers has been obtained by sorption microcalorimetry (Markova et al., 2000), humidity titration calorimetry (Binder et al., 1999), DSC (Ulrich et al., 1994; Bach and Miller, 1998) and differential thermal analysis (DTA) (Lundberg et al., 1978; Bach and Miller, 1998). However, the thermodynamic instability of the intermediate (hydrated) states makes it difficult to obtain reproducible calorimetric data on the overall formation process. Up to date, no systematic study on the energetics of phospholipid vesicle formation has been carried out, though solution calorimetry has provided some experimental information on the enthalpy of formation of DMPC vesicles via the hydration of a phospholipid film (Taylor et al., 1990).
In solution calorimetry, a reaction takes place in a liquid (solvent or dispersant) and the temperature change of the process is related to the heat evolved by the reaction. Solution calorimeters are semi-adiabatic instruments where there is a small heat exchange between the vessel and the surroundings. The amount of heat absorbed or released during the reaction in an ideal adiabatic calorimeter is calculated using the following equation:
Qj. = C ' AT Eqn.1.4.
where
Qj. is the amount of heat absorbed or released by the reaction (in J). C is the heat capacity of the calorimeter, that is the amount of heat energy
required to rise the temperature of the calorimeter by 1 K (in J/K). Sometimes the heat capacity is determined for the calorimeter and its contents. It is experimentally determined for each calorimeter.
Because solution calorimeters are semi-adiabatic instruments it is necessary to conduct a calibration experiment to determine the value o f the practical heat capacity named calibration constant. This concept is further explained in section 3.7.
In solution calorimetry, when the reaction releases heat (exothermic process) the temperature o f the contents of the calorimeter increases. When the reaction absorbs
heat (endothermie process) the temperature of contents of the calorimeter will fall.
A basic solution calorimeter comprises a thermally insulated water tank where the reagent is dissolved or dispersed. A temperature probe is used to measure the change in the temperature o f the water when the reaction takes place. A mechanical stirrer is used to ensure mixing of the sample with the water. Detailed descriptions of a modem solution calorimeter and operational procedures for solution calorimetry experiments can be found in Chapter 3. The usefulness of this technique to study the energetics of formation of phospholipid vesicles was investigated throughout the project described in this thesis. The advantage of solution calorimetry over other calorimetric techniques relies on the fact that the vesiculisation process can be carried out from the beginning to the end within the calorimeter providing information on the overall process.
1. 3. 2. Calorimetric studies of phospholipid vesicles
absorbed or released by the sample can be measured. In DTA, the temperature difference between the sample and an inert reference material is measured as both are heated or cooled at the programmed rate. A plot o f AT as a function of temperature is thus obtained. Over the years, DTA and particularly DSC have been widely used in the field of phospholipid research. DSC has been used to identify transition temperatures, transition enthalpies and differences in the thermal behavior of dry phospholipids, phospholipid-water binary mixtures, and phospholipid-drug-water ternary systems (Bach, 1984).
With DSC, the reactions are investigated under a temperature gradient. The thermotropic properties of phospholipids impede the extrapolation o f DSC data obtained at high temperatures to normal storage temperatures. If one wants to obtain information about chemical or physical changes occurring in the liposomal sample at storage temperature, isothermal microcalorimetry is, in principle, a suitable technique. Isothermal microcalorimetry is based on the heat conduction principle, that is, it measures the heat flow (in W) versus time. A detail description of this technique and its application to phospholipid systems can be found in Chapter 5. Isothermal microcalorimeters enable information to be obtained over hours or days. In liposomal dispersions structural changes are expected in the short term due to the metastability of phospholipid vesicles while in the long term sedimentation and chemical degradation have been reported (Cevc, 1993a).
1. 4. Surfactants
1. 4 .1 . Classification of surfactants
hydrocarbon chain. In a micelle formed by ionic surfactants there is a repulsion
between the similarly charged polar groups. Therefore, the size of the micelle is determined by the combined effect of hydrophobic attraction of the hydrocarbon chains and the repulsive forces of the ionic groups.
Non-ionic surfactants have uncharged, hydrophilic head groups that consist of either
polyoxyethylene moieties (e.g. Biodac® 39, Triton®) or glycosidic groups (e.g. octyl glucoside, OG). Surfactants with polyoxyethylene head groups, may contain alkylpolyethylene ethers with the general formula CnH2n+i-(OCH2CH2)m-OH, or a phenyl ring between the alkyl chain and the ether group (e.g. Triton® X-100). Surfactants with shorter polyoxyethylene chains form aggregates and viscous solutions in water at room temperature, whereas those with longer chains do not aggregate. Non-ionic surfactants are suited for breaking lipid-lipid and lipid-protein interactions. Hence, they are considered non-denaturant and are widely used in the isolation of membrane proteins in their biological active form.
Zwitterionic surfactants are unique in that they offer the combined properties of anionic and non-ionic surfactants. Like non-ionic surfactants, the zwitterionic surfactants do not posses a net charge however, like ionic surfactants they are efficient at breaking protein-protein interactions.
1. 4. 2. General properties of surfactants
The terms defining the properties of surfactants are: cmc, critical micellar temperature (CMT), Kraft point, cloud point, aggregation number (N), and hydrophile-lipophile balance (HLB) (Bhairi, 2002).
increase with increasing surfactant concentration. The point of inflection on a graph obtained by plotting any of these two parameters against the surfactant concentration corresponds to the cmc of the surfactant. The cmc value decreases with the length of the alkyl chain and increases with the introduction of double bonds and other branched points.
The CMT is the minimum temperature at which a surfactant will form micelles. At very low temperatures, surfactants remain mainly in an insoluble crystalline state and are in equilibrium with small amounts of dissolved monomer. At the CMT, the surfactant exists predominately in the micellar form. The temperature at which all three phases- crystalline, monomeric and micellar- exist in equilibrium is called the Kraft point. For most surfactants, the Kraft point is identical to the CMT.
At particular temperatures above the CMT, non-ionic surfactants become cloudy and undergo phase separation to yield a surfactant-rich layer and an aqueous layer. This temperature is called the cloud point. Phase separation presumably occurs due to a decrease in hydration of the head group.
The aggregation number is the average number of monomers in one micelle. It can be obtained by dividing the micellar molecular weight by the monomeric molecular weight. The molecular weight of the micelle can be obtained by gel filtration, light scattering, sedimentation equilibrium, and small-angle-X-ray scattering.
The HLB is a measure of the hydrophilic character of the surfactant: the larger the HLB, the more hydrophilic is the surfactant. There appears to be some correlation between the HLB value of a surfactant and its ability to solubilise membrane proteins. Surfactants with a HLB of 12 to 20 are preferred for non-denaturing solubilisation of membrane proteins.
1. 4. 3. Micellisation
shape o f the amphiphile molecule. Inverted cone-like molecules (polar head bigger than hydrophobic tail) such as soaps, surfactants and lysophospholipids tend to pack
into micelles. Cone-like molecules such as PE and phosphatidic acid form reverse micelles. Cylindrical molecules such as PC, PS and phosphatidylinositol organise into bilayers (Lasic, 1998).
The primary reason for the self-aggregation o f amphiphiles in water is the
hydrophobic effect (section 1.1.). Amphiphiles distort the structure of water and there is a driving force for expelling the hydrophobic moieties from the aqueous environment. This may be achived by concentrating at the surface positioning the hydrophobic group away from the water (Fig. 1.2.). An other way o f “hiding” the non
polar groups is by the arrangement o f the amphiphile into aggregates (micelles or bilayers) with their hydrophilic groups oriented toward the water and their hydrophobic groups oriented away from the water.
There are two main models commonly used to explain the behaviour of surfactants in solution (Rosen, 1989; Hiemenz and Rajagopalan, 1997):
i) Mass action model. This model considers micellisation as a dynamic equilibrium where surfactant molecules are continually entering and leaving the micelle.
ii) Phase separation model. This model treats micellisation as a phase separation o f surfactant in an associated form. Below the cmc there are only monomers. For a concentration above the cmc, the concentration of surfactant in the micelle is equal to the difference between the total surfactant concentration and the cmc o f the surfactant.
1. 5. Interaction of phospholipid vesicles with surfactants
1. 5 .1 . Adsorption of surfactants to phospholipids
Liposomes can be used as a depot formulation at the site o f administration or as a delivery system to target drugs to the cells. However, liposomes are rapidly removed from the blood stream when they are recognized by the mononuclear phagocyte system (MPS). Liposomes may interact with opsonins which, by adsorbing onto the
surface of the vesicles, mediate their endocytosis by the fixed macrophages o f the MPS and circulating monocytes. Liposomes can also be recognized by high density lipoproteins (HDL) which remove phospholipid molecules from the vesicle bilayer, leading to varying degrees of vesicle disintegration and release of encapsulated solutes at rates dependent on the extent o f bilayer damage. Destabilised liposomes and solutes still entrapped are removed by the MPS, presumably following opsonisation (Allen, 1981). Because liposomes are taken up by the MPS they can be used to deliver drugs to the liver and spleen which are the main organs o f the immune system. Antibacterial drugs encapsulated in liposomes have been successfully used to treat infections of the liver and spleen (Schiffelers et al., 2001). Conventional liposomes have also been used to deliver therapeutic agents outside the cells of the MPS. However, due to the fast uptake of liposomes by the MPS low levels of drug are observed in the organs outside the liver and spleen.
effect of the drug they enclose. The circulation time of liposomes has been prolonged by grafting polymers such as polyethylene glycol (PEG), gangliosides and similar polymers into lipid vesicles (Srinath and Diwan, 1994). At low concentration the anchoring of surfactants to the lipid bilayer prevents uptake by the MPS. Surface hydrophobicity is belived to be related to phagocytosis therefore, surface hydrophilicity may prevent opsonisation. However, high concentrations of surfactant induce phase separation, decrease in the mean particle size of the phospholipid vesicles and formation of mixed phospholipid-surfactant micelles leading to solubilisation of the lipid bilayer (Allen et al., 1989; Castile et al., 2001).
1. 5. 2. Solubilisation of phospholipid vesicles by surfactants
Non polar molecules and amphiphiles, having a hydrophobic chain, can be dissolved in the hydrocarbon-like interior of a surfactant micelle. This mechanism, called solubilisation, corresponds to the formation of “swollen” micelles (Mallikaijun and Dadybuijor, 1981). Swollen micelle systems can be considered as oil-in-water microemulsions, since the swollen micelles are physically stable.
are determined by R^. For mixed bilayers, is a function o f the lipid and surfactant concentration and of the distribution of the surfactant between the bilayers and the aqueous phase (equilibrium partition coefficient, K) (Lichtenberg, 1985). Similarly, Rg and the distribution of the surfactant between the micelle and the aqueous medium also determine the size of mixed micelles. In practical terms, the concentration of surfactant in the mixed micelles is equal to the difference between the total surfactant concentration and the cmc of the surfactant. Therefore, R^ is equal to this difference divided by the lipid concentration as shown in Eqn. 1.5. taken jfrom Lichtenberg et al. (1983):
[surfactant] - [surfactant monomers] Eqn, 1.5.
Re —
[phospholipid]
Theoretical approaches have been proposed to determine the critical surfactant to lipid molar ratio at which mixed bilayers first transform into mixed micelles. This ratio is called the critical effective ratio (R^^y These approaches are based on the linear dependence of the critical surfactant concentration at which phase transformation occurs, on the lipid concentration. The equilibrium partition model assumes an equilibrium partition o f surfactant between the bilayers and the aqueous medium (Schurtenberger et al., 1985) whereas, another approach assumes that when the bilayers are transformed into mixed micelles the surfactant concentration in the aqueous medium is about equal to the cmc (Lichtenberg, 1985). Comparison of the theoretical approaches with experimental data led to the conclusion that the Rg^ at which mixed bilayers first transform into mixed micelles is approximately equal to the product o f the cmc and K (Eqn. 1.6.) (Lichtenberg, 1985). Hydrophobic surfactants (low HLB) can be expected to have low cmc but high K values. A high K value means a high affinity of the surfactant for the membrane; the higher K, the more surfactant can be accommodated in the membrane before solubilisation occurs.
R f = cmc • K Eqn.1.6.
described by Eqn.l.7.(Lichtenberg, 1985).
S f = cmc + R f • L Eqn.1.7.
where
S f is the total surfactant concentration when solubilisation occurs and L is the total lipid concentration.
The solubilisation of phospholipid vesicles by surfactants has been evaluated experimentally by ITC. The principle of titration experiments is the stepwise addition of one reagent to an other one, where both components are usually liquids. For ITC solubilisation studies, typically the following titration protocols are used:
i) A surfactant solution is titrated with phospholipid vesicle dispersions (Heerklotz and Seelig, 2000).
ii) Phospholipid vesicles are titrated with surfactant (Keller et al., 1997).
iii) Surfactant/phospholipid mixtures are titrated with phospholipid vesicles or with surfactant (Opatowski et al., 1997).
ITC has been extensively used to determine parameters such as: membrane/water partition coefficient of surfactants, enthalpy of transition of surfactant molecules from the aqueous phase to the membrane, enthalpy of transition of phospholipid vesicles to mixed micelles, effective surfactant to lipid ratios at saturation and at complete solubilisation, enthalpy of transition of surfactant molecules from mixed micelles to vesicles, enthalpy of demicellisation, and effect o f temperature on the lamellar to micelle transition (Microcal, 2002). However, ITC is not a suitable technique when one of the components is in a solid-like state. A technique such as solution calorimetry would enable investigation of the energetics associated with either of the following reactions:


![Figures are percentages of total fatty acid in given position [(1) or (2)] on the glycerol backbone](https://thumb-us.123doks.com/thumbv2/123dok_us/8254816.1375030/23.595.50.463.281.696/figures-percentages-total-fatty-given-position-glycerol-backbone.webp)