Schizophrenia phenomenology comprises a bifactorial general severity and a single-group factor, which are differently associated with neurotoxic immune and immune-regulatory pathways
(1,2,3) Michael Maes, (4,5,6) Aristo Vojdani, (7,8) Michel Geffard, (9) Estefania G. Moreira, (9) Decio S. Barbosa, (9) Ana Paula Michelin, (9) Laura de Oliveira Semeão, (10) Sunee Sirivichayakul, (1) Buranee Kanchanatawan.
1. Department of Psychiatry, Faculty of Medicine, Chulalongkorn University, Bangkok, Thailand. 2. Department of Psychiatry, Medical University of Plovdiv, Plovdiv, Bulgaria.
3. IMPACT Strategic Research Center, Deakin University, Geelong, Australia. 4. Immunosciences Lab., Inc, Los Angeles, CA, USA.
5. Cyrex Labs, LLC, Phoenix, AZ, USA.
6.Department of Preventive Medicine, Loma Linda University, Loma Linda, CA, USA. 7. IDRPHT, Research Department, Talence, France.
8. GEMAC, Lieu-Dit Berganton, Saint Jean d'Illac, France.
9. Health Sciences Graduate Program, Health Sciences Center, State University of Londrina, Londrina, PR, Brazil
10. Faculty of Medicine, Chulalongkorn University, Bangkok, Thailand.
Corresponding author:
Prof. Dr. Michael Maes, M.D., Ph.D. Department of Psychiatry
Faculty of Medicine
Chulalongkorn University Bangkok
Thailand
https//:scholar.google.co.th/citations?user=1wzMZ7UAAAAJ&hl=th&oi=ao
Michael Maes: [email protected] Aristo Vojdani: [email protected]
Michel Geffard: [email protected]
Abstract
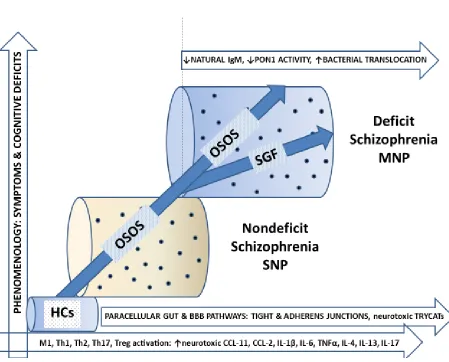
In schizophrenia, a single latent trait underlies psychosis, hostility, excitation, mannerism, negative (PHEMN) symptoms, formal thought disorders (FTD) and psychomotor retardation (PMR). Schizophrenia is accompanied by a breakdown of gut and blood-brain-barrier (BBB) pathways, increased tryptophan catabolite (TRYCAT) levels, bacterial translocation, and lowered natural IgM and paraoxonase (PON)1 activity.
The aim of this study was to examine the factor structure of schizophrenia symptom domains and the biomarker correlates of these factors.
We recruited 80 patients with schizophrenia and 40 healthy subjects and assessed the IgA/IgM responses to paracellular/transcellular (PARA/TRANS) ratios, IgA responses to TRYCATs, natural IgM to malondialdehyde and Gram-negative bacteria, and PON1 enzymatic activity.
Direct Hierarchical Exploratory Factor Analysis showed a bifactorial oblique model with a) a general factor which loaded highly on all symptom domains, named overall severity of schizophrenia (“OSOS”); and b) a single-group factor (SGF) loading on negative symptoms and PMR. We found that 40% of the variance in the OSOS score was explained by IgA/IgM to PARA/TRANS ratio, male sex and education while 36.9% of the variance in SGF score was explained by IgA to PARA/TRANS, IgM to Gram-negative bacteria, female sex (positively associated) and IgM to MDA, and PON1 activity (negatively associated).
Introduction
Classically, it is considered that schizophrenia consists of various symptoms domains including positive symptoms (such as hallucination, delusions, hostility, excitation, and disorganized thinking), negative symptoms (such as flattening of affect, alogia, avolition, and anhedonia), and neurocognitive deficits (such as impairments in episodic and semantic memory as well as in executive functions) [1-5]. Based on the presence of positive and negative symptoms, the phenomenology of schizophrenia is considered to be bi-dimensional with two subtypes namely, type I and II schizophrenia whereby type I is characterized by positive symptoms and type II by negative symptoms coupled with more profound neurocognitive deficits [4-6]. Deficit schizophrenia is classically defined by the presence of negative symptoms during the inter-episodic, more stable and acute phases of illness [6]. In fact, the bidimensional model of schizophrenia was already formulated in the 19th century by Eugene Bleuler who coined the term
schizophrenia and considered two symptom clusters, a first accompanied by negative symptoms such as social withdrawal and loosening of associations and a second cluster with accessory symptoms comprising positive symptoms [7,8]. Anno 2019, the NINH and NHS still classify patients with schizophrenia based on positive and negative symptoms [9,10].
not viable concepts as these constructs lack discriminatory power in partial least squares analysis and that positive symptoms should be dissected in more relevant symptom domains, namely psychosis (hallucinations, delusions), hostility, excitation and mannerism [11,12]. Furthermore, in deficit schizophrenia and the combined group of controls and deficit schizophrenia, this latent vector underpinning negative symptoms, PHEM symptoms, FTD and PMR showed a very adequate internal consistency reliability, predictive relevance, and concurrent, and convergent validity while Confirmatory Tedrad Analysis showed that the latent vector fitted a reflective model [12]. As such, the score of this reflective latent construct is a reliable and replicable index of overall severity of schizophrenia (OSOS), which modulates the various symptom manifestations of OSOS [12]. Nevertheless, these findings await confirmation in other populations while no research has examined whether this latent trait also exists in subjects with deficit and non-deficit schizophrenia combined.
Already in the 1990s, it was conceptualized that schizophrenia is a neuro-immune disorder, characterized by a mild chronic inflammatory state, T cell activation and T helper (Th)-1 activation [(Th)-13]. However, recently it became evident that schizophrenia is accompanied by activated M1 macrophage, T helper (Th)-1, Th-2, Th-17, and T regulatory (T cell) activation indicating activation of the immune-inflammatory response system (IRS) as well as the compensatory immune-regulatory system (CIRS) [14].
of a single OSOS index which causes all manifestations. Moreover, no research has examined whether this OSOS index is mediated by neuro-immune biomarkers which to a large extent are associated with PHEM and negative symptoms.
Hence, this study was conducted to examine whether a) the key symptom domains of stable-phase schizophrenia belong to one single trait, namely an OSOS index, or whether multiple or bifactorial models better fit the data; and b) those factors are mediated by neuro-immune pathways including IgA/IgM responses to PARA/TRANS pathways, IgA responses to PA, XA and 3HK, increased bacterial translocation, natural IgM to MDA, and PON1 activity.
Subjects and Methods Participants
The present study recruited 80 patients with schizophrenia and 40 healthy controls who were recruited from the same catchment area, namely Bangkok, Thailand. Patients attended the Department of Psychiatry, King Chulalongkorn Memorial Hospital, Bangkok, Thailand, while healthy controls were recruited by word of mouth among staff members or their family members or friends. Only patients with DSM-IV-TR diagnostic criteria for schizophrenia were recruited when they were in a stabilized phase of the illness for at least one year. The diagnosis of deficit schizophrenia was made using the Schedule for the Deficit Syndrome (SDS) [6] and schizophrenia patients not fulfilling these criteria were classified as non-deficit schizophrenia.
positive family history of psychosis, and b) a lifetime or current diagnosis of axis I DSM-IV-TR disorders. Exclusion criteria for controls and schizophrenia patients were: a) immune and auto-immune disease including psoriasis, inflammatory bowel disease, rheumatoid arthritis, chronic obstructive pulmonary disease, scleroderma, systemic lupus erythematosus, and diabetes mellitus (type 1); b) neuroinflammatory and neurodegenerative disease including multiple sclerosis, Parkinson’s disease, stroke and Alzheimer’s disease; c) a lifetime history of treatment with immunomodulatory drugs including glucocorticoids, methotrexate, and immunosuppressants; and d) current use of therapeutic dosages of antioxidants or ω3-polyunsaturated fatty acids.
The study was conducted according to International and Thai ethics and privacy laws. Approval for the study (298/57) was obtained from the Institutional Review Board of the Faculty of Medicine, Chulalongkorn University, Bangkok, Thailand, which is in compliance with the International Guidelines for Human Research protection as required by the Declaration of Helsinki, The Belmont Report, CIOMS Guideline and International Conference on Harmonization on Good Clinical Practice. Controls and patients, as well as the guardians of patients or parents or close family members gave written informed consent prior to participation in our study.
Clinical assessments
score the severity of negative symptoms, namely the Scale for the Assessment of Negative Symptoms (SANS) [27], and the negative subscale of the Positive and Negative Syndrome Scale (PANNS) [28]. PHEM symptoms, FTD and PMR were computed as z unit-weighted composite scores as explained previously [17,19] and towards this end we also measured the Brief Psychiatric Rating Scale (BPRS) [29] and the Hamilton Depression (HAM-D) Rating Scale score [30]. The diagnosis of nicotine dependence was made using DSM-IV-TR criteria and body mass index (BMI) was assessed as body weight (kg) / length (m2).
Assays.
activity against 4-(chloromethyl) phenylacetate (CMPA, Sigma, USA). CMPAase activity is affected by the PON1 Q192R polymorphism with the Q allozyme presenting low efficacy to metabolize CMPA (or paraoxon) and lowered CMPAase activity in schizophrenia reflects in part increased QQ genotype in deficit schizophrenia as well as lowered CMPAase activity independent from the genotype [36,37]. IgM responses to Hafnia alvei, Klebsiella pneumoniae, Morganella morganii, Pseudomonas aeruginosa, and Pseudomonas putida were assayed as described previously [20,38] and consequently we computed a z-unit weighted composite score reflecting overall LPS load in the serum, that is z(sum of z scores on all 5 Gram-negative bacteria).
Statistics
We employed one-way analysis of variance to check differences in continuous variables between diagnostic and analysis of contingency tables (χ2 tests) to check associations between sets
of nominal variables. Associations between two sets of scale variables were assessed using partial correlation coefficients with adjustment for relevant extraneous variables. Multivariate GLM analysis followed by tests for between-subject effects is used to assess the effects of diagnostic categories on a set of biomarkers while adjusting for relevant background variables. Multiple tests were always checked for false discovery rate (FDR) using the Benjamini-Hochberg procedure [39]. In order to assess the associations between symptom factor scores and biomarkers we conducted multiple regression analysis using an automatic stepwise method with a p-to-entry of 0.05 and p-to-remove of 0.06 while evaluating the change in R2. All analyses were checked for
multicollinearity using tolerance and the variance inflation factor (VIF).
tested different models, namely EFA models either one or two-factor models, Schmid-Leiman orthogonalization and a pure Exploratory Bifactor Model with Promin rotation [40,41]. FACTOR, windows version 10.5.03 was used to extract factors with the robust unweighted least squares (RULS) method with bias-corrected and accelerated (BCa) bootstraps (500 samples). We used the Kaiser-Meyer-Olkin (KMO) test and Bartlett’s test of sphericity to assess sample and matrix’ factorization adequacy. The number of factors was determined using the Hull test and Parallel Analysis (Optimal Implementation). UNICO (unidimensional congruence), ECV (explained common variance) and MIREAL (mean of item residual absolute loadings) were employed to estimate closeness to unidimensionality whereby UNICO >0.95, ECV >0.85 and MIREAL<0.300 suggest unidimensionality. Goodness-of-fit levels were assessed using root mean squared error of approximation (RMSEA), comparative fit index (CFI), Schwarz’s Bayesian Information Criterion (BIC), goodness-of-fit index (GFI) and the adjusted goodness-of-fit index (AGFI). The distribution of residuals was assessed using weighted root mean square of residuals (RMSR) with Kelley’s criterion (the expected RMSR for an acceptable model) and weighted root mean square residual (WRMR). The quality of the factor scores was estimated using the factor determinacy index (FDI) (>0.80 indicating adequate quality). The H index was used to assess stability across studies and construct replicability with values ≥0.80 indicating good replicability.
approach [44], we examined the contribution of two symptom dimensions (PHEM plus FTS and negative symptoms plus PMR) to the LV extracted from the 8 key symptoms.
The biomarkers were entered as single indicator input variables while the LV extracted from the 8 symptom indicators was the output variable. Complete and consistent PLS path analysis was performed when the inner and outer model constructs complied with specific quality criteria, namely all indicators of the outer model should have factor loadings > 0.6 at p < 0.01; the model standardized root mean residual (SRMR) < 0.08; adequate discriminant validity as indicated by the Fornell-Larcker criterion and a Heterotrait–Monotrait (HTMT) ratio <0.9; and adequate construct and convergent validity as indicated by average variance extracted (AVE) > 0.500; Cronbach alpha > 0.750; rho_A >0.800 and composite reliability > 0.800. Using consistent PLS bootstrapping with 5000 bootstrap samples we then computed path coefficients with exact p-values (inner model) and t-values for the factor scores in the outer model. Blindfolding was employed to access the predictive validity using Q2 statistic of construct cross-validated redundancy or
communality with Q2 > 0 indicating predictive relevance. Confirmatory Tedrad Analysis (CTA)
was conducted to ascertain that our reflective model was not misspecified.
Results.
Demographic and clinical data
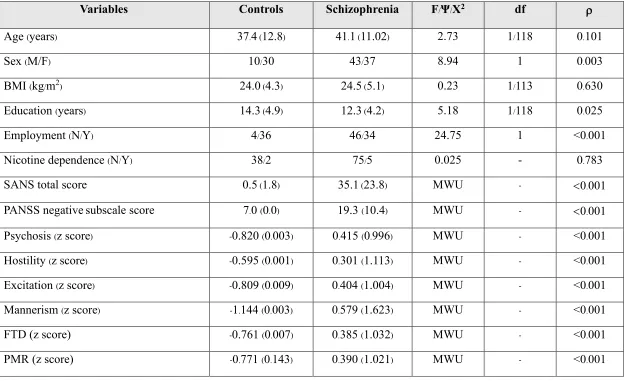
Table 1 displays the demographic and clinical data of the schizophrenia patients and
scales and the composite scores were significantly increased in schizophrenia as compared with healthy controls. After FDR p-correction for multiple testing, we could not find any associations between age and the 8 symptoms domains. The latter, however, were significantly and inversely associated with years of education (all p<0.01 after FDR p correction). Mann-Whitney U tests showed significantly higher scores on all 8 symptom domains except (PMR) in men as compared with women (all at p<0.01 after FDR p-correction). Mann-Whitney U tests did not show any significant differences in the 8 symptom domain scores between smokers and non-smokers.
Table 1 shows also the measurements of the 6 biomarkers used in this study, namely the model-generated estimated marginal means (in z scores) after multivariate GLM analysis with age, sex, TUD and BMI as covariates. We found a significant association between schizophrenia and the 6 biomarkers (F=7.62, df=6/101, p<0.001; effect size=0.312) with increased IgA (effect size=0.179) and IgM (effect size=0.148) PARA/TRANS rations, IgA to sum noxious TRYCATs (effect size=0.087), CMPAase (effect size=0.067), but no significant differences in IgM responses to MDA and Gram-negative bacteria between patients and controls. These differences remained significant after p-correction. There were no significant effects of TUD (F=0.78, df=6/101, p=0.590), but a significant inverse effect of age on IgM to Gram-negative bacteria (12.27, df=1/106, p=0.001). Parameter estimates showed a significant effect of BMI on the IgA PARA/TRANS ratio (t=-3.21, p=0.002; effect size=0.089). We also examined the effects of the drug state on the 6 biomarkers, but could not find effects of the use of risperidone (n=33), haloperidol (n=8), perphenazine (n=20), clozapine (n=9), antidepressants (n=25), mood stabilizers (n=12) and anxiolytics/hypnotics (n=26).
Table 2 displays the partial correlations between both total SANS and PANSS negative subscale scores and PHEM, FTD and PMR (after adjusting for age, sex, and education). In both the total study group and the schizophrenia group we found significant partial correlations between negative symptoms domains and all other symptom dimensions. There were also no effects of the drug state of the patients on those partial correlations.
Exploratory factor analysis (EFA)
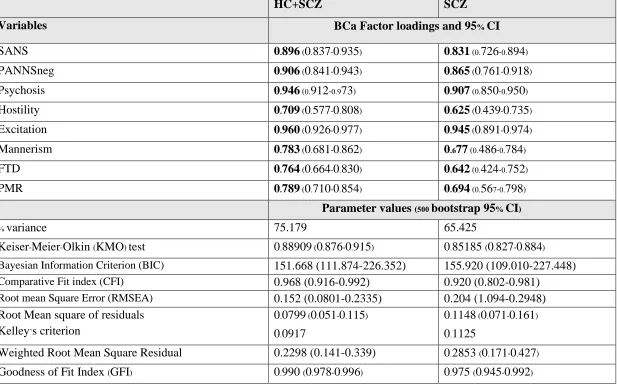
Table 3 displays the results of exploratory factor analysis which was carried out in the total
Table 3 also shows the results of exploratory factor analysis performed in schizophrenia subjects. The KMO test and Bartlett's test (ꭓ2=594.4, df=28, p<0.00001) indicated that the factorability of the correlation matrix is adequate. Parallel Analysis and the Hull test indicated that one factor may be sufficient. The values of UNICO suggest that the data set should be considered to be unidimensional, whereas ECV and MIREAL values showed that the same data set is probably not unidimensional. The goodness of fit indices and the generalized H index and Factor Determinacy index were adequate, but the RMSR and RMSEA values did not perform well. As such, these models may not be the most adequate and, therefore, we have examined the single-group bifactor model with Pure EFA as well as a two-factor solution.
Table 4 shows the best models fitting the 8 symptom domains in the total study group and
schizophrenia patients as well, namely a bidimensional oblique model with a general factor (GF) named overall severity of schizophrenia (OSOS GF) and a single-group factor (SGF), which loaded highly on both negative symptom domains and PMR. The construct replicability H index of both the first (SGF) and second (OSOS GF) order factors were adequate. The effectiveness of both factors as evaluated using the Factor Determinacy index, ORION marginal reliability and Expected percentage of true differences were all adequate. Moreover, RMRS and RMSEA values showed that the model fit of both models was more than acceptable. We have also examined whether a two-factor model could fit the data, but the model fit data were again less adequate, for example, the RMSEA for the combined group analysis was 0.116. All in all, a bifactorial solution fits the data well while the general factor is well defined by all domains and the SGF is defined by negative symptoms and PMR.
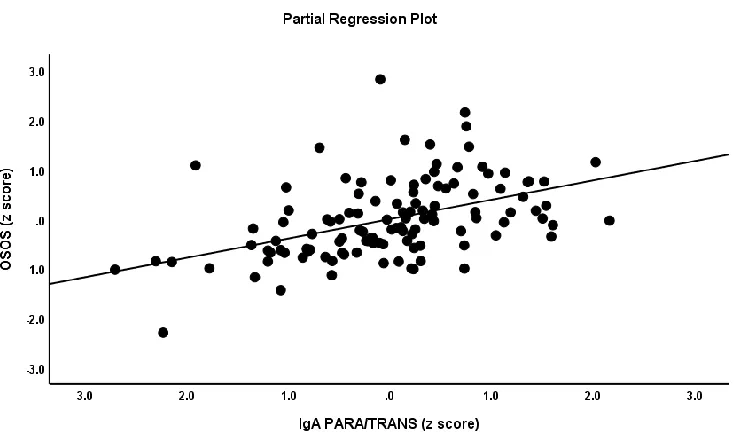
In order to further explore the associations between OSOS, OSOS GF and SGF and the biomarkers included here we have conducted multiple regression analyses with the factor scores as dependent variables and the 6 biomarkers, age, sex, BMI and TUD as explanatory variables (automatic step-up). The first regression in Table 5 shows that 51.3% of the variance in OSOS was explained by the regression on IgA/IgM PARA/TRANS, sum noxious TRYCATs (all positively), male sex and education (inversely). Figure 1 shows the partial regression plot of OSOS index on IgA to PARA/TRANS. The second multiple regression analysis conducted in all subjects showed that 40.4% of the variance in OSOS GF was explained by the regression on IgA/IgM PARA/TRANS (positively), male sex and education (negatively). The third multiple regression again preformed in all subjects shows that 36.9% of the variance in the SGF was explained by the regression on IgA PARA/TRANS and IgM to Gram-negative bacteria (all positively), IgM to MDA and PON1 (CMPAase) activity (negatively) and female sex. Regression #4 shows that 29.2% of the variance in the bifactorial OSOS GF was explained by the regression on IgA/IgM to PARA/TRANS and education. Regression #5 shows that 38.6% of the variance in SGF in schizophrenia was explained by IgA to PARA/TRANS and IgM to Gram-negative bacteria (positively), and PON1 (CMPAase) activity and IgM to MDA (inversely).
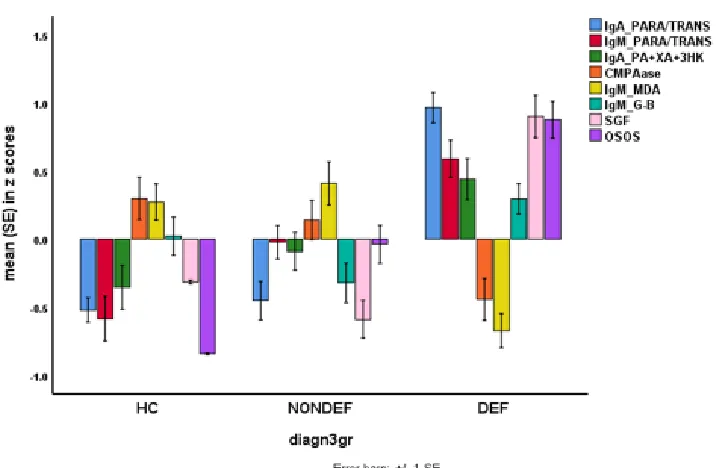
Figure 2 shows that the mean (SE) values of the biomarkers, OSOS and SGF (all in z
different between deficit schizophrenia and controls and non-deficit schizophrenia, while IgM to Gram-negative bacteria was higher in deficit as compared with non-deficit schizophrenia.
Results of PLS analysis
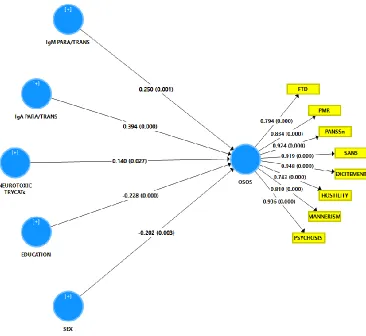
Figure 3 shows the outcome of a first PLS analysis conducted in the total study group with
a latent vector (LV) extracted from the eight symptom domains as an output variable and the biomarkers, age, sex and education as input variables. The model quality data were adequate with SRMR=0.025 and excellent reliability data as shown in Table 6. All symptoms domains loaded highly on this LV (all loadings > 0.707 and all at p<0.0001). The construct cross-validated redundancy for OSOS LV was adequate (0.345) while the results of confirmatory Tetrad Analysis showed that the OSOS fitted a reflective model. We found that 50.3% of the variance in the LV extracted from the 8 symptom indicators was explained by IgA and IgM PARA/TRANS ratios and the sum of noxious TRYCATs (all positively), and education (negatively) and sex.
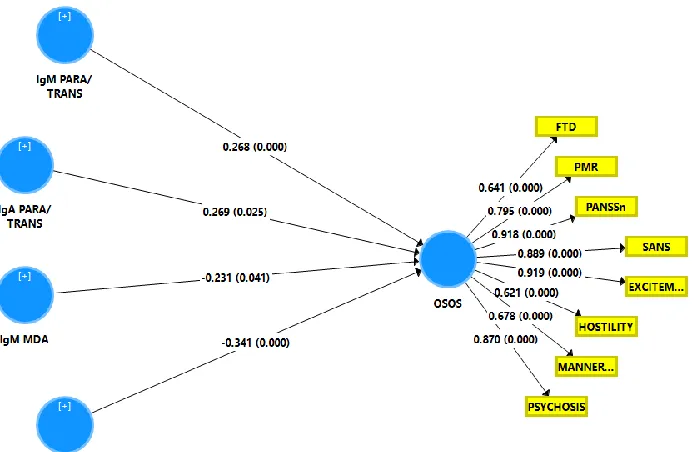
Figure 4 shows the results of a second PLS analysis with the same output and input
Discussion
The first major finding of this study is that the 8 key domains of schizophrenia phenomenology (SANS and PANSS negative, PHEM symptoms, FTD and PMR) are most appropriately modeled using a bi-dimensional oblique solution with a general factor (GF) that reflects overall severity of illness (OSOS GF) and a single-group factor (SGF) reflecting negative symptoms and PMR. The current findings that a general factor (OSOS or OSOS GF) reflect the data is in agreement with a previous study performed on Iraq patients reporting that a single latent trait, which is essentially unidimensional, underpins the key domains of schizophrenia [12]. Importantly, when we performed the same bifactorial analysis on the restricted study group of schizophrenia patients a similar bifactorial exploratory solution with OSOS GF and SGF were found. Also, the Iraq study [12] reported that in the restricted study group of patients with deficit schizophrenia a similar general OSOS could be detected. These results show that the same OSOS factor exists in Thai and Iraq study groups and in restricted study samples as well. It should be stressed that restricted sample variability attenuates the actual relationships between the variables as well as the factor generalizability and that those correlation coefficients computed in such restricted samples should be corrected for range restriction [12,45,46]. As such, future research should validate the OSOS construct in unrestricted study samples (controls and patients including deficit and nondeficit schizophrenia) in other continents.
very discrepant factor analysis results ranging from solutions with 2-9 factors versus a unidimensional solution [41]. Nevertheless, using the Pure Bifactorial EFA method, which we also used in the current study, the developers of this method observed that a single-group bifactorial model was the most appropriate solution, which comprised a general factor running through all locus of control items and an SGF reflecting previously identified items, that is a political factor [41]. In fact, the current study revealed a similar solution indicating that schizophrenia phenomenology consists of an OSOS GF and a subgroup of items that previously was conceptualized as a separate dimension, namely the negative symptom items.
Nevertheless, a significant difference between the current study and that of Almulla et al. [12] is that the latter established a unidimensional solution and could not retrieve the SGF. This difference may be explained by differences in schizophrenia phenomenology between Thai and Iraq patient samples and most importantly by differences in clinical symptoms and inclusion/exclusion criteria. Thus, here we included patients with non-deficit and deficit schizophrenia, whereas Almulla et al. [12] included only patients with deficit schizophrenia who were, in addition, more severely ill. Moreover, in the current study, we excluded subjects with signs of major depression, whereas Almulla et al. [12] included those with secondary (but not primary) major depression.
regarded as the cause of its eight manifestations (SANS and PANSS negative, PHEM symptoms, FTD and PMR), which are to a large extent mediated by OSOS.
Our findings that the phenomenology of schizophrenia is most appropriately modeled by a bifactorial model contrasts the current theory that a two-dimensional concept consisting of positive and negative symptoms is most appropriate [4,47]. Nevertheless, the concept “positive symptoms” has no validity as it cannot be discriminated from the negative symptom domain and because it should be dissected into its relevant domains including psychosis, hostility and excitation [12]. The current findings also help to interpret our previous results that deficit schizophrenia is a qualitatively distinct nosological entity modelled by negative and PHEM symptoms (qualitative theory) whereas the severity of these symptom domains (OSOS) increases along a continuum from non-deficit to deficit schizophrenia (quantitative theory) indicating simultaneous qualitative and quantitative differences between both diagnostic groups [48,49]. Thus, the current results show that as OSOS increases along a continuum from “normal” to non-deficit and then to deficit schizophrenia, the SGF items (negative symptoms and PMR) appear and become more prominent to group together and coupled with increasing severity of PHEM symptoms and FTD shape a distinct nosological entity [48,49].
[17,19,50]. Increased IgA responses to PA, XA, and 3HK suggest increased production of those TRYCATs, which all three together may cause excitotoxic and neurotoxic effects thereby playing a role in the neuroprogressive pathophysiology of schizophrenia [16]. Moreover, it is possible that IgA responses to those TRYCATs may exert adverse effects in their own right. Natural IgM is a key factor of the innate immune system and has strong antioxidant and immune-regulatory effects and functions as a first-line defense against Gram-negative bacteria [24,51,52]. By inference, lowered natural IgM may be accompanied by a greater inflammatory potential and greater impact of gut commensal Gram-negative bacteria once they are translocated from the gut lumen through loosened gut barriers [20]. PON1 is an enzyme with strong antioxidant and anti-inflammatory properties [25] and lowered levels in schizophrenia are accompanied by increased immune responses [53,44]. Moreover, PON1 has quorum quenching properties thereby attenuating quorum sensing of Gram-negative bacteria (including P. aeruginosa) through the enzymatic impact on N-acyl homoserine lactones [55,56]. As such, PON1 may be considered to be part of the innate immune system protecting against Gram-negative bacteria and, therefore, lowered levels of PON1 activity may be accompanied by aggravated immune responses and increased translocation of Gram-negative bacteria.
some neurotoxic products in schizophrenia (including CCL-11 and neurotoxic TRYCATs) may be associated with damage to the tight junctions of the BBB [17] thereby allowing the entrance of greater amounts of neurotoxic substances into the brain [17].
Acknowledgements
The study was supported by the Asahi Glass Foundation, Chulalongkorn University Centenary Academic Development Project and Ratchadapiseksompotch Funds, Faculty of Medicine, Chulalongkorn University, grant numbers RA60/042 (to BK) and RA61/050 (to MM).
Conflict of interest
The authors have no conflict of interest with any commercial or other association in connection with the submitted article.
Author’s contributions
All the contributing authors have participated in the manuscript. BK and MM designed the study. BK recruited patients and completed diagnostic interviews and rating scale measurements. MM carried out the statistical analyses. All authors (BK, MM, SS, AV, MG, EGM, DSB, APM, LOS) contributed to interpretation of the data and writing of the manuscript. All authors approved the final version of the manuscript.
References
2. Mellor CS. Methodological Problems in Identifying and Measuring First-Rank Symptoms of Schizophrenia. In: Marneros A., Andreasen N.C., Tsuang M.T. (eds) Negative Versus Positive Schizophrenia. Springer, Berlin, Heidelberg; 1991.
3. Burton N. Living with Schizophrenia, (2ndEdn) Oxford :Acheron Press, p3; 2012.
4. Crow TJ. The Two-Syndrome Concept: Origins and Current Status. Origins 1985;11:471–88.
5. Peralta V, Cuesta MJ. Negative symptoms in schizophrenia: A confirmatory factor analysis of competing models. Am J Psychiatry 1995;152(10):1450-7.
6. Kirkpatrick B, Buchanan RW, McKenney PD, Alphs LD, Carpenter WT Jr. The Schedule for the Deficit syndrome: an instrument for research in schizophrenia. Psychiatry Res. 1989,30:119-23.
7. Bleuler, E Dementia Praecox, or the Group of Schizophrenias. (1911) Translated by J. Zinkin. New York: International Universities Press; 1950.
8. Jablensky A. The diagnostic concept of schizophrenia: its history, evolution, and future prospects. Dialogues Clin Neurosci. 2010;12:271–87.
9. NHS. 2019. As assessed June 14, 2019.
10. NIHM. Schizophrenia. As assessed June 14, 2019.
https://www.nimh.nih.gov/health/topics/schizophrenia/index.shtml
11. Maes M, Sirivichayakul S, Kanchanatawan B, Carvalho AF. In Schizophrenia, Psychomotor Retardation is Associated with Executive and Memory Impairments, Negative and Psychotic Symptoms, Neurotoxic Immune Products and Lower Natural IgM to Malondialdehyde. Preprints 2019, 2019010108 (doi: 10.20944/preprints201901.0108.v1).
12. Almulla A, Al-Hakeim H, Maes M. Schizophrenia Phenomenology Revisited: Positive and Negative Symptoms are Strongly Related Reflective Manifestations of an Underlying Single Trait Indicating Overall Severity of Schizophrenia. Preprints 2019, 2019070147 (doi: 10.20944/preprints201907.0147.v1).
13. Smith RS, Maes M. The macrophage-T-lymphocyte theory of schizophrenia: additional evidence. Med Hypotheses. 1995;45(2):135-41.
15. Kanchanatawan B, Sirivichayakul S, Ruxrungtham K, Carvalho AF, Geffard M, Anderson G, Maes M. Deficit Schizophrenia Is Characterized by Defects in IgM-Mediated Responses to Tryptophan Catabolites (TRYCATs): a Paradigm Shift Towards Defects in Natural Self-Regulatory Immune Responses Coupled with Mucosa-Derived TRYCAT Pathway Activation. Mol Neurobiol 2018;55(3):2214-26.
16. Kanchanatawan B, Sirivichayakul S, Ruxrungtham K, Carvalho AF, Geffard M, Ormstad H, Anderson G, Maes M. Deficit, but Not Nondeficit, Schizophrenia Is Characterized by Mucosa-Associated Activation of the Tryptophan Catabolite (TRYCAT) Pathway with Highly Specific Increases in IgA Responses Directed to Picolinic, Xanthurenic, and Quinolinic Acid. Mol Neurobiol. 2018;55(2):1524-36.
17. Maes M, Sirivichayakul S, Kanchanatawan B, Vodjani A. Breakdown of the paracellular tight and adherens junctions in the gut and blood brain barrier and damage to the vascular barrier in patients with deficit schizophrenia. Neurotox Res. 2019;doi: 10.1007/s12640-019-00054-6.
18. Maes M, Kanchanatawan B, Sirivichayakul S, Carvalho AF. In Schizophrenia, Deficits in Natural IgM Isotype Antibodies Including those Directed to Malondialdehyde and Azelaic Acid Strongly Predict Negative Symptoms, Neurocognitive Impairments, and the Deficit Syndrome. Mol Neurobiol. 2018; Nov 27. doi: 10.1007/s12035-018-1437-6.
Mol Neurobiol. 2019;Apr 10. doi: 10.1007/s12035-019-1578-2. [Epub ahead of print] PubMed PMID: 30972627.
20. Maes M, Kanchanatawan B, Sirivichayakul S, Carvalho AF. In Schizophrenia, Increased Plasma IgM/IgA Responses to Gut Commensal Bacteria Are Associated with Negative Symptoms, Neurocognitive Impairments, and the Deficit Phenotype. Neurotox Res. 2019;35(3):684-698.
21. Thiagarajan D, Frostegård AG, Singh S, Rahman M, Liu A, Vikström M, Leander K, Gigante B, Hellenius ML, Zhang B, Zubarev RA, de Faire U, Lundström SL, Frostegård J. Human IgM Antibodies to Malondialdehyde Conjugated With Albumin Are Negatively Associated With Cardiovascular Disease Among 60-Year-Olds. J Am Heart Assoc. 2016;20;5(12).
22. McMahon M, Skaggs B. Autoimmunity: Do IgM antibodies protect against atherosclerosis in SLE? Nat Rev Rheumatol. 2016;12(8):442-4.
23. Aziz M, Holodick NE, Rothstein TL, Wang P. The role of B-1 cells in inflammation. Immunol Res. 2015;63:153-66.
25. Moreira EG, Boll KM, Correia DG, Soares JF, Rigobello C, Maes M. Why Should Psychiatrists and Neuroscientists Worry about Paraoxonase 1? Curr Neuropharmacol. 2018; Dec 27. doi: 10.2174/1570159X17666181227164947. [Epub ahead of print] PubMed PMID: 30592255.
26. Kittirathanapaiboon P, Khamwongpin M. The Validity of the Mini International Neuropsychiatric Interview (M.I.N.I.) Thai Version. J Mental Health of Thailand. 2005;13(3):125-35.
27. Andreasen NC. The scale for the assessment of negative symptoms (SANS): conceptual and theoretical foundations. Brit J Psychiatry suppl. 1989;7:49-58.
28. Kay SR, Fiszbein A, Opler LA. The positive and negative syndrome scale (PANSS) for schizophrenia. Schizophr Bull. 1987;13:261-76.
29. Overall JE, Gorham DR. The brief psychiatric rating scale. Psycholog Rep. 1962;10:799-812.
30. Hamilton M. A rating scale for depression. J Neurol Neurosurg Psychiatry. 1960;23:56-62.
32. Faiderbe S, Chagnaud JL, Geffard M. Anti-phosphoinositide auto-antibodies in sera of cancer patients: isotypic and immunochemical characterization. Cancer Lett 1992;66(1):35-41.
33. Geffard M, Bodet D, Martinet Y, Dabadie MP. Detection of the specific IgM and IgA circulating in sera of multiple sclerosis patients: interest and perspectives. Immuno-Analyse & Biology Specification. 2002;17:302-310.
34. Duleu S, Mangas A, Sevin F, Veyret B, Bessede A, Geffard M. Circulating Antibodies to IDO/THO Pathway Metabolites in Alzheimer's Disease. Int J Alzheimers Dis. 2010;15;2010. pii: 501541.
35. Roomruangwong C, Kanchanatawan B, Sirivichayakul S, Anderson G, Carvalho AF, Duleu S, Geffard M, Maes M. IgA / IgM responses to Gram-negative bacteria are not associated with prenatal depression, but with physio-somatic symptoms and activation of the tryptophan catabolite pathway at the end of term and postnatal anxiety. CNS Neurol Disord Drug Targets. 2017;April 7. [Epub ahead of print].
36. Furlong, Clement E, Nina Holland, Rebecca J Richter, Asa Bradman, Alan Ho, and Brenda Eskenazi. “PON1 Status of Farmworker Mothers and Children as a Predictor of Organophosphate Sensitivity.” Pharmacogenetics and Genomics 2006;16(3):183–90.
38. Geffard M, Bodet D, Martinet Y, Dabadie M-P. Intérêt de l’évaluation d’IgM et d’IgA spécifiques circulant dans le serum de malades atteints de sclérose en plaques (SEP). Immuno-analyse Biol Spécialisée. 2002;17:302–310. doi: 10.1016/S0923-2532(02)01214-0
39. Benjamini Y, Hochberg Y. Controlling the false discovery rate: a practical and powerful approach to multiple testing. J Royal Statistics Soc Series b (Methodological) 1995;57:289-300.
40. Ferrando PJ, Lorenzo-Seva U. Program FACTOR at 10: Origins, development and future directions. Psicothema. 2017;29:236–240.
41. Lorenzo-Seva U, Ferrando PJ. A General Approach for Fitting Pure Exploratory Bifactor Models. Multivariate Behav Res. 2019;54(1):15-30.
42. Ringle CM, Wende S, Becker J-M. SmartPLS 3. Bönningstedt: SmartPLS; 2015. Retrieved from http://www.smartpls.com.
43. Cepeda-Carrion G, Cegarra-Navarro J-G, Cillo V. Tips to use partial least squares structural equation modelling (PLS-SEM) in knowledge management. J Knowledge Management. 2018; https://doi.org/10.1108/JKM-05-2018-0322
State University; 2016. Ebook. http://www.statisticalassociates.com/pls-sem_p.pdf As assessed June 5, 2019.
45. Wiberg M, Sundstrom A. A comparison of two approaches to correction of restriction of range in correlation analysis. Practic Assessm Res Evaluat. 2009;14(5):1-9.
46. Lakes KD. Restricted sample variance reduces generalizability. Psychol Assess. 2013;25(2):643-50.
47. Roy MA, DeVriendt X. Positive and negative symptoms in schizophrenia: a current overview. Can J Psychiatry. 1994;39(7):407-14.
48. Kanchanatawan B, Sriswasdi S, Thika S, Sirivichayakul S, Carvalho AF, Geffard M, Kubera M, Maes M. Deficit schizophrenia is a discrete diagnostic category defined by neuro-immune and neurocognitive features: results of supervised machine learning. Metab Brain Dis. 2018;33(4):1053-67.
49. Kanchanatawan B, Sriswasdi S, Thika S, Stoyanov D, Sirivichayakul S, Carvalho AF, et al. Towards a new classification of stable phase schizophrenia into major and simple neuro-cognitive psychosis: Results of unsupervised machine learning analysis. J Eval Clin Pract. 2018;24:879-91.
51. Binder CJ. Naturally occurring IgM antibodies to oxidation-specific epitopes. Adv Exp Med Biol. 2012;750:2-13.
52. Díaz-Zaragoza M, Hernández-Ávila R, Viedma-Rodríguez R, Arenas-Aranda D, Ostoa-Saloma P. Natural and adaptive IgM antibodies in the recognition of tumor-associated antigens of breast cancer (Review). Oncol Rep 2015;34:1106-1114.
53. Brinholi FF, Noto C, Maes M, Bonifácio KL, Brietzke E, Ota VK, Gadelha A, Cordeiro Q, Belangero SI, Bressan RA, Vargas HO, Higachi L, de Farias CC, Moreira EG, Barbosa DS. Lowered paraoxonase 1 (PON1) activity is associated with increased cytokine levels in drug naïve first episode psychosis. Schizophr Res. 2015;166(1-3):225-30.
54. Noto C, Ota VK, Gadelha A, Noto MN, Barbosa DS, Bonifácio KL, Nunes SO, Cordeiro Q, Belangero SI, Bressan RA, Maes M, Brietzke E. Oxidative stress in drug naïve first episode psychosis and antioxidant effects of risperidone. J Psychiatr Res. 2015;68:210-6.
55. Bar-Rogovsky H, Hugenmatter A, Tawfik DS. The evolutionary origins of detoxifying enzymes: the mammalian serum paraoxonases (PONs) relate to bacterial homoserine lactonases. J Biol Chem. 2013;288(33):23914-27.
Figure 2. Mean (SE) values of all biomarkers, the OSOS (overall severity of schizophrenia) general factor (GF) score, and the single-group factor (SGF) score.
Figure 3. Results of Partial Least Squares (PLS) analysis. This analysis is performed in the total study group with a latent vector extracted from the eight symptom domains as an output variable (named: overall severity of schizophrenia or OSOS) and the biomarkers, sex and education as input variables.
Figure 4. Results of Partial Least Squares (PLS) analysis. This analysis is performed in the schizophrenia study group with a latent vector extracted from the eight symptom domains as an output variable (named: overall severity of schizophrenia or OSOS) and the biomarkers, and education as input variables.
SANS: Scale for the Assessment of Negative Symptoms; PANSS: the Positive and Negative Syndrome Scale; FTD: formal thought disorders; PMR: psychomotor retardation (see table 1 for computation). IgA/IgM PARA/TRANS: IgA/IgM directed to paracellular / transcellular proteins; IgM MDA: IgM values directed to malondialdehyde;
Figure 5. The bifactorial factor model, deficit and nondeficit schizophrenia.
Table 1. Demographic and clinical data in normal controls and schizophrenia patients
Variables Controls Schizophrenia F/Ψ/X2 df
Age (years) 37.4 (12.8) 41.1 (11.02) 2.73 1/118 0.101
Sex (M/F) 10/30 43/37 8.94 1 0.003
BMI (kg/m2) 24.0 (4.3) 24.5 (5.1) 0.23 1/113 0.630
Education (years) 14.3 (4.9) 12.3 (4.2) 5.18 1/118 0.025
Employment (N/Y) 4/36 46/34 24.75 1 <0.001
Nicotine dependence (N/Y) 38/2 75/5 0.025 - 0.783
SANS total score 0.5 (1.8) 35.1 (23.8) MWU - 0.001
PANSS negative subscale score 7.0 (0.0) 19.3 (10.4) MWU - 0.001
Psychosis (z score) -0.820 (0.003) 0.415 (0.996) MWU - <0.001
Hostility (z score) -0.595 (0.001) 0.301 (1.113) MWU - <0.001
Excitation (z score) -0.809 (0.009) 0.404 (1.004) MWU - <0.001
Mannerism (z score) -1.144 (0.003) 0.579 (1.623) MWU - <0.001
FTD (z score) -0.761 (0.007) 0.385 (1.032) MWU - <0.001
IgA PARA/TRANS (z score) -0.851 0.208 0.008 0.177 23.10 1/106 <0.001
IgM PARA/TRANS (z score) -0.544 0.226 0.209 0.193 18.42 1/106 <0.001
IgM MDA (z score) 0.066 0.201 -0.162 0.201 1.26 1/106 0.264
Sum noxious TRYCATs (z score) -1.325 0.617 0.362 0.525 10.13 1/106 0.002
PON1 activity (U/mL) 43.87 (2.01) 37.08 (1.36) 7.67 1/106 0.007
IgM Gram-negative bacteria (z score) -0.033 (0.161) 0.017 (0.110) 0.06 1/106 0.801
All results are shown as mean (SD)
A,B,C: pairwise comparisons among group means
MWU: Results of Mann-Whitney U test; BMI: body mass index
SANS: Scale for the Assessment of Negative Symptoms; PANSS: the Positive and Negative Syndrome Scale; FTD: formal thought disorders; PMR: psychomotor retardation (see table 1 for computation).
Table 2. Partial Correlation coefficients between negative symptoms as measured with the SANS (Scale for the Assessment of
Negative Symptoms) and the negative subscale of the PANSS (the Positive and Negative Syndrome Scale) and other key symptoms of schizophrenia (SCZ)
In controls and SCZ combined In SCZ only
Domains SANS PANSSnegative SANS PANSSnegative
Psychosis 0.714 0.761 0.570 0.661
Hostility 0.518 0.475 0.403 0.358*
Excitation 0.812 0.852 0.723 0.791
Mannerism 0.617 0.581 0.474 0.445
FTD 0.563 0.591 0.373* 0.443
PMR 0.827 0.862 0.749 0.814
The correlation coefficients were adjusted for age, sex, education. All significant at p<0.0001; except *: significant at p<0.005
FTD: formal thought disorders; PMR: psychomotor retardation (see table 1 for computation).
Table 3. Results of Exploratory Factor Analysis (EFA) performed on the eight key symptom dimensions of schizophrenia
HC+SCZ SCZ
Variables BCa Factor loadings and 95% CI
SANS 0.896 (0.837-0.935) 0.831 (0.726-0.894)
PANNSneg 0.906 (0.841-0.943) 0.865 (0.761-0.918)
Psychosis 0.946 (0.912-0.973) 0.907 (0.850-0.950)
Hostility 0.709 (0.577-0.808) 0.625 (0.439-0.735)
Excitation 0.960 (0.926-0.977) 0.945 (0.891-0.974)
Mannerism 0.783 (0.681-0.862) 0.677 (0.486-0.784)
FTD 0.764 (0.664-0.830) 0.642 (0.424-0.752)
PMR 0.789 (0.710-0.854) 0.694 (0.567-0.798)
Parameter values (500 bootstrap 95% CI)
% variance 75.179 65.425
Keiser-Meier-Olkin (KMO) test 0.88909 (0.876-0.915) 0.85185 (0.827-0.884)
Bayesian Information Criterion (BIC) 151.668 (111.874-226.352) 155.920 (109.010-227.448)
Comparative Fit index (CFI) 0.968 (0.916-0.992) 0.920 (0.802-0.981)
Root mean Square Error (RMSEA) 0.152 (0.0801-0.2335) 0.204 (1.094-0.2948)
Root Mean square of residuals Kelley’s criterion
0.0799 (0.051-0.115) 0.0917
0.1148 (0.071-0.161) 0.1125
Weighted Root Mean Square Residual 0.2298 (0.141-0.339) 0.2853 (0.171-0.427)
Adjusted GFI (AGFI) 0.987 (0.969-0.995) 0.965 (0.923-0.988) Unidimensional Congruence (UNICO) 0.987 (0.973-0.996) 0.968 (0.929-0.991) Explained Common Variance (ECV) 0.895 (0.851-0.936) 0.838 (0.776-0.899) Mean of Item Residual Absolute Loadings (MIREAL) 0.268 (0.207-0.330) 0.322 (0.245-0.387)
Generalized H index 0.981 0.964
Factor Determinacy index 0.986 0.977
We performed two EFAs one on controls and patients combined (HC+SCZ) and a second in schizophrenia (SCZ) patients only Significant loadings (>0.6) are shown in bold; CI: confidence intervals
Table 4. Results of Pure Exploratory Bifactor analysis, bias-corrected and accelerated (BCa) bootstrap with 95% confidence intervals
BCa Factor loadings and 95% CI
Samples All subjects combined (HC+SCZ) SCZ only
Factors Single-Group Factor General Factor Single-Group Factor General Factor
SANS 0.500 (0.364 / 0.618) 0.782 (0.720 / 0.855) 0.645 (0.346 / 1.010) 0.693 (0.520 / 0.888)
PANNSneg 0.591 (0.493 / 0.715) 0.774 (0.734 / 0.822) 0.681 (0.389/ 0.964) 0.696 (0.595 / 0.813)
Psychosis 0.096 (-0.017 / 0.179) 0.964 (0.931 / 0.994) -0.043 (-0.257 / 0.135) 0.999 (0.990 / 1.023)
Hostility -0.137 (-0.269/ 0.084) 0.807 (0.711 / 0.874) -0.011 (-0.167 / 0.439) 0.719 (0.458 / 0.898)
Excitation 0.311 (0.234 / 0.397) 0.897 (0.855 / 0.937) 0.174 (-0.141 / 0.330) 0.974 (0.854 / 1.060)
Mannerism -0.049 (-0.172 / 0.111) 0.850 (0.763 / 0.903) 0.056 (-0.037 / 0.316) 0.743 (0.474 / 0.897)
FTD 0.076 (-0.107 / 0.277) 0.777 (0.660 / 0.855) -0.224 (-0.875 / -0.051) 0.717 (0.522 / 0.879)
PMR 0.647 (0.552 / 0.750) 0.642 (0.558 / 0.682) 0.737 (0.586 / 1.045) 0.487 (0.115 / 0.633)
Parameter values (500 bootstrap 95% CI)
Variance 1.150 5.337 1.508 4.731
Bayesian Information Criterion (BIC) 134.44 (115.822-162.751) 116.426 (106.536-139.196)
Comparative Fit index (CFI) 0.996 (0.977-1.006) 1.00 (0.940-1.090)
Root mean Square Error (RMSEA) 0.065 (0.0050-0.1500) 0.001 (0.00-0.1518)
Root Mean square of residuals Kelley’s criterion
0.0246 (0.014-0.035)
0.0917
0.0443 (0.001-0.084)
Weighted Root Mean Square Residual 0.0610 (0.034-0.101) 0.0243 (0.00-0.042)
ORION marginal reliability 0.847 0.958 0.950 0.999
Expected % of true differences (EPTD) 90.3% 95.9% 95.3% 100%
Factor Determinacy index 0.920 0.979 0.975 0.999
Generalized H index 0.858 (0.671-0.914) 0.966 (0.946-0.995) 0.950 (0.812-1.0) 0.999 (0.953-1.062)
We performed two bifactorial EFAs one on controls and patients combined (HC+SCZ) and a second in schizophrenia (SCZ) patients only Loadings (>0.6) are shown in bold; CI: confidence intervals
Table 5. Results of multiple regression analyses with the (bifactorial) general factor (GF) OSOS (overall severity of schizophrenia) and the single group factor (SGF) as dependent variables and the biomarkers as explanatory variables.
Dependent variables
Explanatory variables
β t p F model Df p R2
#1. GF OSOS in all subjects
Model 23.67 5/111 <0.001 0.513
IgA PARA/TRANS 0.397 5.60 <0.001
IgM PARA/TRANS 0.283 3.92 <0.001
Male sex 0.188 2.81 0.006
Education -0.188 -2.74 0.007
Sum noxious TRYCATs 0.156 2.31 0.023
#2. Bifactorial GF OSOS in all subjects
Model 18.98 4/112 <0.001 0.404
IgM PARA/TRANS 0.266 3.35 0.001
IgA PARA/TRANS 0.327 4.25 <0.001
Male sex 0.245 3.34 0.001
Education -0.201 -2.66 0.009
#3. Bifactorial SGF in all subjects
Model 12.97 5/111 <0.001 0.369
IgA PARA/TRANS 0.285 3.47 0.001
CMPAase -0.263 -3.42 0.001
IgM MDA -0.381 -4.077 <0.001
IgM Gram-negative B 0.201 2.27 0.025
Female sex 0.166 2.10 0.038
#4. Bifactorial GF OSOS in SCZ only
Model 10.32 3/75 <0.001 0.292
IgM PARA/TRANS 0.232 2.23 0.029
Education -0.298 -3.03 0.003
IgA PARA/TRANS 0.289 2.81 0.006
IgA/IgM: IgA to paracellular / transcellular ratio; MDA: malondialdehyde; CMPAase: paraoxonase 1 activity; TRYCATs: tryptophan catabolites including picolinic acid + xanthurenic acid + 3-OH-kynurenine)
#5. SGF in SCZ only
IgA PARA/TRANS 0.287 2.91 0.005
CMPAase -0.263 -2.84 0.006
IgM MDA -0.408 -3.53 0.001
Table 6. Results of Partial Least Squares analysis
Reliability data ALL PARTICIPANTS SCZ only
Mean (5000 bootstraps) (SD)
SANS 0.919 (0.015) 0.889 (0.018)
PANNSneg 0.924 (0.015) 0.918 (0.015)
Psychosis 0.936 (0.015) 0.870(0.041)
Hostility 0.743 (0.053) 0.621 (0.087)
Excitation 0.948 (0.010) 0.919 (0.019)
Mannerism 0.810 (0.046) 0.678 (0.080)
FTD 0.794 (0.040) 0.641 (0.081)
PMR 0.834 (0.029) 0.795 (0.040)
Reliability data ALL PARTICIPANTS SCZ only
Model SRMR 0.035 0.060
Rho_A 0.963 (0.006) 0.958 (0.011)
Composite reliability 0.960 (0.006) 0.935 (0.013)
Cronbach alpha 0.952 ((0.007) 0.920 (0.014)
We performed two PLS analyses: one in all subjects combined and a second in schizophrenia (SCZ) patients only