IJEDR1302001 INTERNATIONAL JOURNAL OF ENGINEERING DEVELOPMENT AND RESEARCH | IJEDR Website: www.ijedr.org | Email ID: [email protected]
1
Parametric optimization of WEDM for
HastelloyC276, using GRA method
Md.karim Baig
,M.tech, Mechanical Engineering, NIT Warangal,Warangal,
Andhra Pradesh, India.
Dr.N.venkaiah,
Asst.professor,Dept.of Mechanical Engineering, NIT Warangal, Warangal, Andhra Pradesh, India.
Abstract: Wire EDM (WEDM) is a versatile
non-traditional machining process used to cut materials of high hardness and to produce very complex and intricate shapes on the wide variety of materials. Hardness of the material is not a constraint for WEDM. This advantage makes the WEDM to cut very hardened materials with ease. Parameters that affect the Material Removal Rate(MRR) and surface roughness mainly consists of pulse on time, pulse off time, discharge current, servo voltage, tension of wire, flushing pressure etc. so, it is very essential to set the parameters that control the outputs in an optimized condition so as get the maximum output. Work has been carried out to find the optimal parameter settings for maximum MRR and minimum kerf (width of cut) for a nickel based alloy, HastelloyC276, a very high temperature, corrosion resistant alloy, using both Taguchi methods and Grey Relational Analysis (GRA).
Index: WEDM, Kerf, Taguchi methods, GRA.
I. INTRODUCTION
The history of electro discharge machining (EDM) dates back to the days of World Wars I and II when B. R. Lazarenko and N. I. Lazarenko invented the relaxation circuit (RC). Using a simple servo controller they maintained the gap width between the tool and the work piece, reduced arcing, and made EDM more profitable. Since 1940, die sinking by EDM has been refined using pulse generators, planetary and orbital motion techniques, computer numerical control (CNC), and the adaptive control systems. During the 1960s the extensive research led the progress of EDM when numerous problems related to mathematical modeling were tackled. The evolution of wire EDM in the 1970s was due to the powerful generators, new wire tool electrodes, improved machine intelligence, and better flushing. Recently, the machining speed has gone up by 20 times, which has decreased machining costs by at least 30 percent and improved the surface finish by a factor of 15. EDM has the following advantages:
1. Cavities with thin walls and fine features can be produced. 2. Difficult geometry is possible.
3. The use of EDM is not affected by the hardness of the work material.
4. The process is burr-free.
1.1.
Mechanism of material removal in EDMIn EDM, the removal of material is based upon the Electro Discharge Erosion (EDE) effect of electric sparks occurring between two electrodes that are separated by a dielectric liquid as metal removal takes place as a result of the generation of extremely high temperatures generated by the high-intensity discharges that melt and evaporate the two electrodes. A series of voltage pulses of magnitude about 20 to 120 V and frequency on the order of 5 kHz is applied between the two electrodes, which are separated by a small gap, typically 0.01 to 0.5 mm. When using RC generators, the voltage pulses, are responsible for material removal.
The types of EDM includes, Die-sinking EDM, Wire EDM (WEDM), Dry EDM, powder mixed EDM etc. WEDM was first introduced to the manufacturing industry in the late 1960s. In WEDM, material is eroded from the work material by a series of discrete sparks occurring between the work piece and the wire separated by a stream of dielectric fluid, which is continuously fed to the machining zone .The WEDM process makes use of electrical energy generating a channel of plasma between the cathode and anode, and turns it into thermal energy at a temperature in the range of 8000– 12,000ºC. When the pulsating direct current Power supply occurring between 20,000 and 30,000 Hz is turned off, the plasma channel breaks down. This causes a sudden reduction in the temperature allowing the circulating dielectric fluid to implore the plasma channel and flush the molten particles from the pole surfaces in the form of microscopic debris. WEDM has typically parts shown in the figure 1.1.
IJEDR1302001 INTERNATIONAL JOURNAL OF ENGINEERING DEVELOPMENT AND RESEARCH | IJEDR Website: www.ijedr.org | Email ID: [email protected]
2
1.2.
Taguchi methodsTaguchi techniques are statistical methods developed by Genichi Taguchi to improve the Quality of manufacturing goods. Basically, classical experimental design methods are to complex and not easy to use. A large number of experiments have to be carried out when the number of the process parameter increases. To solve this problem, the Taguchi method uses a special design of orthogonal arrays to study the entire parameter space with only a small number of experiments. Taguchi’s standard arrays consists of arrays like, L9, L27, L81 etc. of which a suitable array can be selected for a particular design.
The steps in Taguchi’s method of finding optimal parameters settings are:
1 Identification of the quality characteristics and selection of design parameters to be evaluated.
2 Determination of the number of levels for the design parameters and possible interactions between the design parameters.
3 Selection of the appropriate orthogonal array and assignment of design parameters to the orthogonal array. 4 Conducting of the experiments based on the arrangement
of the orthogonal array.
5 Analysis of the experimental results using the S/N ratio and ANOVA analyses.
6 Selection of the optimal levels of design parameters.
1.3.
Grey Relational Analysis (GRA)In the year of 1980, grey systems theory was brought forward by Professor Deng Ju-long from China Grey analysis uses a specific concept of information. It defines situations with no information as black, and those with perfect information as white. However, neither of these idealized situations ever occurs in real world problems. In fact, situations between these extremes are described as being grey, hazy or fuzzy. Therefore, a grey system means that a system in which part of information is known and part of information is unknown.
1.4.
Generation of Grey RelationThe use of Taguchi method with grey relational analysis to optimize the face milling operations with multiple performance characteristics includes the following steps: 1. Identify the performance characteristics and cutting
parameters to be evaluated.
2. Determine the number of levels for the process parameters.
3. Select the appropriate orthogonal array and assign the cutting parameters to the orthogonal array.
4. Conduct the experiments based on the arrangement of the orthogonal array.
5. Normalize the experiment results of cutting force, tool life and surface roughness.
6. Perform the grey relational generating and calculate the grey relational coefficient.
7. Calculate the grey relational grade by averaging the grey relational coefficient.
8.
Analyze the experimental results using the greyrelational grade and
statistical ANOVA.II. LITERATURE REVIEW
Mahapatra and Amar [11] have reported optimization of WEDM process parameters using Taguchi method and Genetic algorithm for the responses as Material Removal Rate (MRR), Surface roughness and Kerf. They reported the levels of factors for maximization of MRR and Minimization of Kerf, Surface Roughness respectively using Taguchi method, and then a Regression equation is formed for three of responses and is used as prediction equation for Genetic Algorithm to find out the global optimum parameters. Factors like discharge current, pulse duration, dielectric flow rate and their interactions have been found to play a significant role in rough cutting operations for maximizations of MRR, minimization of surface roughness and minimization of cutting width.
Mohan et. al. [7] reported a synergy of Response Surface Methodology, Grey Relational Analysis (GRA) coupled with Energy measurement method has been applied that maximizes Material Removal Rate (MRR) and simultaneously minimizes Tool Wear Rate (TWR) and Radial Overcut or Gap during Electrical Discharge Machining (EDM) of AISI D Tool steel. A face centered Central Composite Design (CCD) has been
adopted for conducting experiments. The designed
experimental results were used in GRA, and the weights of the quality characteristics were decided by utilizing the entropy measurement method. The significant parameters are obtained by accomplishing Analysis Of Variance (ANOVA). Based on the RSM results, it is found that the GRA grades are considerably influenced by the machining parameters and some of their interactions. Discharge current found to be the most influencing parameter.
Manna and Bhattacharya [12] reported the optimization of WEDM parameters viz; pulse on time, off time, open circuit voltage, discharge current and wire tension , wire feed and servo voltage on Material Removal Rate (MRR), Surface Roughness and Wire Gap during machining of Al/ SiC-MMC. They have reported the significant factors that are affecting the MRR by conducting ANOVA. Moreover, a dual approach has been carried out by combining Taguchi method with Gauss Elimination method to find out the optimal parameters for the response. Results reported that Voltage and Pulse on time are significant for MRR, Wire tension and Wire Feed are significant for surface roughness, Wire tension and Voltage are significant for Spark gap.
Shajan and Shunmugam [9] have carried out multi- objective optimization of wire electric discharge machining by non- dominated sorting genetic algorithm. Regression Analysis was done to relate the output responses namely Cutting velocity and Surface roughness with the parameters Voltage, current, pulse on time, off time, servo mean voltage, wire tension, injection pressure. That equation is used as objective function to find the pareto optimal solutions for the output responses using Non- dominated sorting genetic algorithm.
Objectives of the present work
IJEDR1302001 INTERNATIONAL JOURNAL OF ENGINEERING DEVELOPMENT AND RESEARCH | IJEDR Website: www.ijedr.org | Email ID: [email protected]
3
2. To study the combined effect of process parameters(Pulse on time, off time, peak current, discharge voltage) on MRR and Kerf.
3. To find the relation between the output responses and input parameters using regression analysis.
4. Optimize the process parameters in order to improve Kerf by using DOE and Taguchi technique.
5. Optimization of process parameters with multiple performance characteristics using Grey relational Analysis.
III. EXPERIMENTAL SET UP
All Experiments were carried out on ELECTRONICA Wire EDM machine, with the work piece as HastelloyC276. The wire used was Bras wire of diameter 0.3mm. The Brass wire was coated with zinc and is known as “stratified Brass wire”. Dielectric fluid used is Ionized water. The present work is focused to study the effect of Pulse on time, pulse off time, discharge time and servo voltage on Material removal rate and Kerf (width of cut) using design of experiments, Taguchi method and ANOVA analysis is carried out for finding the individual effect of parameters and Grey analysis has been performed for analyzing the combined effect of parameters on the responses stated above.
The work material used in the present work is HastealloyC276, a super alloy and high temperature resistant material is super alloy of Nickel. The dimensions of the work material are of 84×84×23mm after forging. The material was grinded before carrying out experiments on WEDM, to ensure that there are no irregularities on the sheet. After grinding, the dimensions measured are 84×84×21.68mm.The Composition of HastelloyC276 is given below. The other commercial grades of Hastelloy available in the market are C24, and C22. HASTELLOY C-276 is a wrought corrosion-resistant alloy. A prime advantage of this alloy is that it generally does not require solution heat treatment after welding. Hastelloy resists the formation of grain boundary precipitates that would degrade corrosion resistance.
IV. METHODOLOGY
Design Layout
For the three levels of four factors namely Pulse on time(TON), pulse off time(TOFF), peak current(IP) and discharge voltage(SV), an L27 orthogonal array is selected with three interactions namely TON*TOFF, TON*IP, TON*SV. The design layout of the orthogonal array is given below.
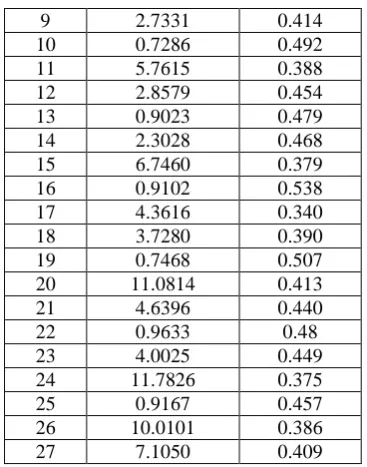
Table 4.1 Responses measured during experimentation.
EXP
NO MRR(mm³/min) KERF(mm)
1 0.6453 0.463
2 3.4759 0.388
3 2.2260 0.460
4 0.8756 0.503
5 1.9783 0.484
6 3.2115 0.373
7 1.0157 0.558
8 2.5576 0.361
9 2.7331 0.414
10 0.7286 0.492
11 5.7615 0.388
12 2.8579 0.454
13 0.9023 0.479
14 2.3028 0.468
15 6.7460 0.379
16 0.9102 0.538
17 4.3616 0.340
18 3.7280 0.390
19 0.7468 0.507
20 11.0814 0.413
21 4.6396 0.440
22 0.9633 0.48
23 4.0025 0.449
24 11.7826 0.375
25 0.9167 0.457
26 10.0101 0.386
27 7.1050 0.409
Table 4.2 shows the levels of each parameter considered during the experimentation and table 4.1 shows the results obtained during experimentation.
Table 4.2. levels of parameters
Parameter Level 1 Level 2 Level 3
Pulse on time(TON)
(µs)
100 105 110
Pulse off time
(TOFF)(µs) 50 55 60
Discharge
current(IP) (A) 10 11 12
Servo
voltage(SV)(V) 10 50 90
The material removal rate and kerf obtained during every run is tabulated in table 4.1. The material removal rate has been calculated by using the formula as shown below.
………..Eqn.(1)
Where, L= length of slot(mm), B= width of slot(mm), H= depth of slot(mm), T= time taken to cut the slot.(min).
A common length of 5mm is taken for every slot and thickness of slot is equal to the thickness of the work material as the slot has been taken over the whole thickness of the work piece i.e; 21.68mm. Time for each cut, i.e; for each experiment has been noted using a stop watch.
IJEDR1302001 INTERNATIONAL JOURNAL OF ENGINEERING DEVELOPMENT AND RESEARCH | IJEDR Website: www.ijedr.org | Email ID: [email protected]
4
Figure 4.1. showing the width of cut (kerf)
V. RESULTS AND DISCUSIONS
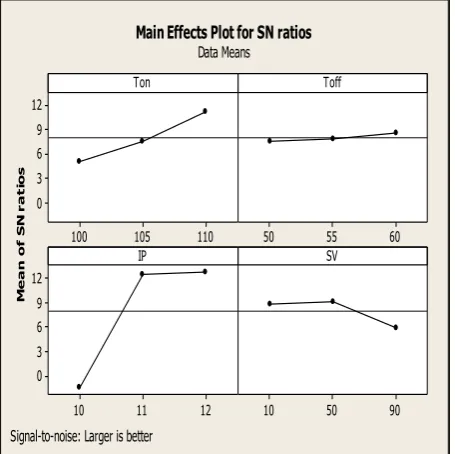
The S/N ratios, ANOVA for MRR, Kerf, Regression Analysis are carried out using the software MINITAB 16.0. The optimal parameters for MRR and kerf using Taguchi methods are calculated using the ANOVA analysis. The level with higher delta value(higher S/N- lower S/N) is treated as optimal compared with the other two. In the present analysis, optimal parameters have been obtained prior to only one output, but not combined. 110 105 100 12 9 6 3 0 60 55 50 12 11 10 12 9 6 3 0 90 50 10 Ton M e a n o f S N r a t io s Toff IP SV
Main Effects Plot for SN ratios Data Means
Signal-to-noise: Larger is better
Figure 5.1. Main effect plot for MRR.
From the above ANOVA table 5.1, the most significant factors that affect the MRR are in ascending order are IP, TON, TON*IP, SV, TON*SV, TOFF, TON*TOFF respectively based on the percentage of contribution they are providing for the response MRR. From the graph, the optimal parameters for MRR are being 105, 60,11,50 respectively for TON, TOFF, IP, SV, and 105,60,11,10 for kerf using Taguchi’s S/N ratio method.
From the above graphs and from ANOVA table 5.2, it has been clear that the factors contribute for Kerf are in the order IP, SV, TON*SV, TOFF, TON*TOFF, TON*IP, Ton.
Grey Relational Analysis
In GRA method, the optimal parameters that affect the both the responses combinedly are found out using multi objective methods.
Table 5.1. ANOVA analysis for MRR.
Symbol D. O.F SS(sum of squares) MS(Mea n Squares)
F Contribut ion (%)
TON 2 171.71 85.85 5.41 10.61
TOFF 2 5.07 2.53 0.16 0.31
IP 2 1191.45 595.73 37.52 73.9
SV 2 56.99 28.49 1.79 3.53
TON*TOF F
4 0.85 0.21 0.01 0.05
TON*IP 4 75.63 18.91 1.19 4.7
TON*SV 4 15.00 3.75 0.24 0.93
Error 6 95.27 15.88 5.91
Total 26 1611.97 100
S = 3.98471 R-Sq = 94.09%
110 105 100 8.0 7.5 7.0 6.5 6.0 60 55 50 12 11 10 8.0 7.5 7.0 6.5 6.0 90 50 10 TON M e a n o f S N r a t io s TOFF IP SV
Main Effects Plot for SN ratios
Data Means
Signal-to-noise: Smaller is better
Figure.5.2.main effect plot for kerf.
Table 5.2 ANOVA for kerf.
symbol D.O.F SS MS F %
TON 2 0.15 0.07 0.27 0.45
TOFF 2 0.91 0.45 1.62 2.76
IP 2 17.63 8.81 31.15 53.55
SV 2 9.60 4.80 16.97 29.16
TON*TOFF 4 0.55 0.13 0.49 1.67
TON*IP 4 0.53 0.45 0.47 1.60
TON*SV 4 1.83 0.28 1.62 5.55
ERROR 6 1.69 5.13
TOTAL 26 32.92 100
S = 0.532055 R-Sq = 94.84%
IJEDR1302001 INTERNATIONAL JOURNAL OF ENGINEERING DEVELOPMENT AND RESEARCH | IJEDR Website: www.ijedr.org | Email ID: [email protected]
5
From the table 5.5, the experimental run which has themaximum Relational grade and rank is the best experimental run and the parameter levels for that run are considered as the best for both the criterion that is for higher MRR and lower Kerf. So, from the above table, experiment no. 24 is the best one and the parameter levels are as follows
TON= 110µs TOFF=55µs IP=12A SV=10V
Data preprocessing is carried out using the formulae
( )
( )( ) ( )( )
( )( ) ( )( ) ( )
The original reference sequence and pre-processed data (comparability sequence) are represented by ( )( ) and
( )
( ) , i =1,2,….,m; k =1,2,...,n respectively, where m is the number of experiments and n is the total number of observations of data.
( )
( )( ) ( )( )
( )( ) ( )( )( )
Table 5.3 Data preprocessing results
RUN NO MRR(HB) KERF(LB)
IDEAL VALUE 1 1
1 0 0.435
2 0.2514 0.779
3 0.149 0.449
4 0.0206 0.252
5 0.119 0.339
6 0.2304 0.848
7 0.033 0
8 0.171 0.903
9 0.1874 0.66
10 0.0074 0.302
11 0.4593 0.779
12 0.1986 0.477
13 0.023 0.362
14 0.1488 0.412
15 0.5477 0.821
16 0.023 0.091
17 0.334 1
18 0.276 0.77
19 0.0091 0.233
20 0.937 0.665
21 0.358 0.541
22 0.0285 0.357
23 0.301 0.5
24 1 0.839
25 0.024 0.463
26 0.8408 0.788
27 0.58 0.683
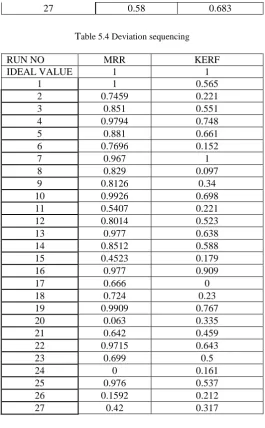
Table 5.4 Deviation sequencing
RUN NO MRR KERF
IDEAL VALUE 1 1
1 1 0.565
2 0.7459 0.221
3 0.851 0.551
4 0.9794 0.748
5 0.881 0.661
6 0.7696 0.152
7 0.967 1
8 0.829 0.097
9 0.8126 0.34
10 0.9926 0.698
11 0.5407 0.221
12 0.8014 0.523
13 0.977 0.638
14 0.8512 0.588
15 0.4523 0.179
16 0.977 0.909
17 0.666 0
18 0.724 0.23
19 0.9909 0.767
20 0.063 0.335
21 0.642 0.459
22 0.9715 0.643
23 0.699 0.5
24 0 0.161
25 0.976 0.537
26 0.1592 0.212
27 0.42 0.317
The grey relational grade is calculated using the formula shown below. The run with relational grade is considered to be the best experimental run among the 27 runs and the parameters of the run are considered to be the optimal for both the
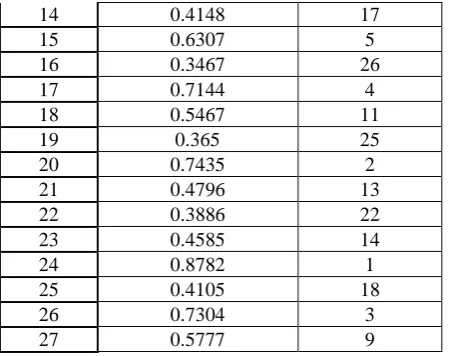
Table 5.5. Grey Relational Grade and Ranks.
RUN NO
GREY RELATIONALGRA
DE
GREY RANK
1 0.4014 19
2 0.5474 10
3 0.4229 16
4 0.3693 24
5 0.3964 20
6 0.5803 8
7 0.3371 27
8 0.6069 6
9 0.4881 12
10 0.3762 23
11 0.587 7
12 0.4365 15
IJEDR1302001 INTERNATIONAL JOURNAL OF ENGINEERING DEVELOPMENT AND RESEARCH | IJEDR Website: www.ijedr.org | Email ID: [email protected]
6
14 0.4148 17
15 0.6307 5
16 0.3467 26
17 0.7144 4
18 0.5467 11
19 0.365 25
20 0.7435 2
21 0.4796 13
22 0.3886 22
23 0.4585 14
24 0.8782 1
25 0.4105 18
26 0.7304 3
27 0.5777 9
Responses at once.so, for maximum MRR and minimum kerf, the optimal parameters will be of the run of highest relational grade. From the above table 5.5, the 24 th run is the best run. So, the parameter levels for the run will be considered the optimal levels for higher MRR and lower kerf
and they are as flows. TON= 110µs
,TOFF=55µs,IP=12A,SV=10V.
In the end, Taguchi based GRA, has been developed to find out the most affecting parameter for both MRR and kerf taken at once that is as multi-objective optimization problem. The following table 5.6 shows the results of Taguchi based GRA, which shows the most affecting parameters for MRR, kerf taking the relational grade in to account.
Table 5.6. ANOVA for relational grade.
symbol D.O.F SS MS F %
TON 2 0.0448 0.0224 1.58 8.5
TOFF 2 0.0090 0.0045 0.32 1.7
IP 2 0.2247 0.1123 7.91 42.63
SV 2 0.1403 0.0701 4.94 26.62
TON*TOFF 4 0.0045 0.0011 0.08 0.85
TON*IP 4 0.0152 0.0038 0.27 2.88
TON*SV 4 0.0032 0.0008 0.06 0.60
ERROR 6 0.0852 0.0142 16.16
TOTAL 26 0.527 100
VI. CONCLUSION
The present work has been carried out on a new material HastelloyC276, a nickel alloy and is a High Temperature Resistant and high strength to weight ratio alloy. It is a very hard alloy and most of the composition consists of nickel. It’s applications and advantages favours this material usage in defense and aerospace applications. Moreover, it is very difficult and even impossible to machine this alloy using traditional machining methods, and if any intricate shape is to be made on this alloy, it is impossible by traditional methods and Non- traditional machining is the only solution. Wire EDM, a common and very efficient Non-traditional machining method is employed in the present work to carry out the machining on this material and to study the main process parameters that affect the Material Removal Rate (MRR) and Kerf and to optimize the parameters over these responses
mentioned.While studying the parameters affecting MRR and Kerf, a sufficient experimental data was collected through extensive experimentation. Through analysis, the most significant factor found to be affecting the responses, MRR and Kerf is found to be Discharge current (IP). Further, the level of IP, 12A is found to be optimal for both higher MRR and lower Kerf. The next parameters that are found to be effective are Servo voltage (SV), Pulse on time (TON), Pulse off time (TOFF) in that order.
Using the Taguchi design, the optimal parameters found for higher MRR are TON(3), TOFF(3), IP(3), SV(2) and the MRR optimal found to be 7.1050 mm³/min and for Kerf, the optimal parameters found to be are TON(2), TOFF (3), IP(2), SV(1), and the optimal kerf was found to be 0.34 mm. A multi-objective approach, Grey Relational Analysis (GRA), for finding the optimal parameters affecting both MRR and Kerf are found to be TON = 110 µs, TOFF=60 µs, IP=12A, SV=10 V, for both higher MRR value of 11.78 mm³/min and lower Kerf a value of 0.375 mm.
REFERENCES
[1] Anand pandey and Shankar singh, “Current research trends in variants of Electric Discharge Machining – a review”, International Journal of Engineering Science and Technology, Vol. 2(6), 2010, 2172-2191.
[2] 2.Prasad D.V.S.S.S.V., Gopala Krishna A “ Empirical modeling and optimization of wire Electric Discharge Machining”, International Journal of Advanced Manufacturing Technology,2009.
[3] Kanagarajan D, .Karthikeyan, Palanikumar, Paulo davim.” Optimization of electrical discharge machining characteristics of WC/Co composites using Non-dominated sorting genetic algorithm.
[4] Gokler, M.I.; Ozanozgu, A.M. : “Experimental investigation of effects of cutting parameters on surface roughness in the WEDM process”, International Journal of Machine Tools and Manufacture, 40, pp. 1831-1848, 2000.
[5] Hargovind Soni, M.K.Pardhan,” Multi reponse optimization of EDM using Grey- PCA Approach,” ICEMT 2013.
[6] Kamal Jangra, Sandeep Grover,Aman Agarwal,” Optimization of multi machining characteristics in WEDM of WC-5.3% Co composite using integrated approach of Taguchi GRA and entropy method.” Front.Mech. Eng 2012.
[7] 7.Mohan Pradhan, “Process Simulation,modeling and estimation of temperature and residual stresses in EDM”, ISCI, 2012.
[8] 8. Mahdavinejad. R.A,” Optimisation of electro discharge machining parameters”, Journal of Achievements in materials and Manufacturing Engineering, 2008.
[9] Shajan Kuriakose, M.S.Shunmugam, “ Multi-objective optimization of Wire-electro discharge machining process by Non-Dominated Genetic Algorithm.”, Journal of Materials Processing Technology., 2005.
IJEDR1302001 INTERNATIONAL JOURNAL OF ENGINEERING DEVELOPMENT AND RESEARCH | IJEDR Website: www.ijedr.org | Email ID: [email protected]
7
[11]11. Mahapatra S.S and Amar Patnaik “ Optimization of process parameters in WEDM using Taguchi methods”, International journal of advanced manufacturing technology,2007.