Volume 3, No. 1, Jan-Feb 2012
International Journal of Advanced Research in Computer Science
RESEARCH PAPER
Available Online at www.ijarcs.info
ISSN No. 0976-5697
Automatic Contrast Enhancement of Low Contrast Images using MATLAB
Neetu Mittal
Apeejay Institue of Technology Greater Noida, INDIA
savini09@gmail.com
Abstract: Image enhancement is one of the basic contents of image processing which is being used worldwide as a technique to manipulate images in a way to make them worthy for a particular use. The idea behind enhancement techniques is to bring out detail that is obscured, or simply to highlight certain features of interest in an image. Many of the fields like Medical, atmospheric sciences, law enforcement, microbiology, biomedicine, bacteriology, climatology, meteorology, textile, GIS etc are being fully benefited b y the use of such techniques. Image enhancement alters an image to makes its meaning clearer to human observers .In this paper, various image enhancement techniques have been implemented in MATLAB environment. The results obtained from MATLAB simulations validate the effectiveness of the proposed Techniques.
Key Words: Image processing, Image enhancement, Contrast enhancement, Histogram equalization, Visual quality.
I. INTRODUCTION
An image is a single picture which represents something. It may be a picture of a person, of people or animals, or of an outdoor scene, or a microphotograph of an electronic component or the result of medical imaging. Image enhancement is the process by which we try to improve an image so that it looks subjectively better [1]. The approach largely depends on what we wish to achieve. Out of the five senses –vision, hear, touch, smell and taste – which humans use to perceive their environment, vision is the most powerful. In fact, more than 99% of the activity of the human brain is involved in processing images from the visual cortex. A visual image is rich in information. “A picture is worth a thousand words.”
The main objective of image enhancement is to process the image so that the result is more suitable than the original image for a specific application. Image enhancement is a field that is being used in various areas and disciplines. Advances in computers, microcontrollers and DSP boards have opened new horizons to digital image processing, [2] and have opened many avenues to the design and implementation of new innovative techniques. Image enhancement [3-4] is a method of improving the definition of a video picture by a computer program, which reduces the lowest grey values to black and the highest to white: used for pictures from microscopes, surveillance cameras and scanners. It is often used to improve the image quantity by emphasizing some information and weakening some unnecessary information of an image according to users' need [5]. In this paper, some techniques of the Image enhancement with the simulation results using MATLAB/SIMULINK. This paper is organized as follows. I; Image enhancement techniques are explained. Next section II shows the simulation studies and the effectiveness of techniques has been validated on original image, the conclusion is given in section III. This paper emphasize on the importance of simulation techniques in the field of digital Image enhancement. Simulations are carried out for implementation of various basic image enhancement [6] techniques in MATLAB.
II. IMAGE ENHANCEMENT TECHNIQUES
A. Histogram Equalization Technique:
Histogram equalization reassigns the brightness values of pixels based on the image histogram. The histogram of an image is a discrete function [7 -9] that is formed by counting the number of pixels in the image that have a certain grey value. Histogram Equalization Techniques enhances the contrast of images by transforming the values in an intensity image, or the values in the color map of an indexed image, so that the histogram of the output image approximately [10-13] matches a specified histogram. Histogram equalization of regions within an image can dramatically improve the local visibility of details
(a)
(b)
Figure 1. (a) Original Image (b) Histogram of original image 0
5000 10000 15000
[image:1.595.344.531.486.764.2]a. Simulation Studies:
The images shown in figure are studied through the computer simulation using the MATLAB/Simulink in MATLAB environment. The effectiveness of the proposed Techniques shown by using two different cases; with and without Histogram Equalization Techniques. In this paper it has been tried to conclude that the simulation of the complex techniques much more comfortable to visualize various simulation results.
(a)
(b)
Figure.2.Histogram Equalization Technique implementation (a) Enhanced Image (b) Histogram
b. Original Image (without Histogram Equalization Technique):
Fig.2 (a) shows the original image has low contrast, with most of the intensity range values in the left. Histogram of the output images in fig.2 (b) shown mostly histogram are present in the left, very little in right and almost nil in between.
c. Image with Histogram Equalization Technique: The histeq (histogram equalization) function is used to adjust the intensity values automatically. Histeq transforms the intensity values so that the histogram of the output image approximately matches a specified histogram of the image. In fig. 3 (a), fig 3(b) we use histeq to adjust a grayscale image. The simulation studies suggest that original image has low contrast, with most values in the left of the intensity range but histeq produces an output image having values evenly distributed throughout the range.
B. Adaptive Histogram Equalization Technique: Adaptive Histogram Equalization techniques enhance the contrast of the grayscale image by transforming the values using contrast-limited adaptive histogram equalization (CLAHE). ADAPTHISTEQ can use Uniform, Rayleigh, or Exponential distribution [14-16] as the basis for creating the contrast transform function. The distribution that should be used depends on the type of the input image. Adaptive Histogram Equalization techniques operate on small data regions (tiles) rather than the entire image. Contrast of each tile is enhanced so that the histogram of each output region approximately matches the specified histogram.
a. Simulation Studies:
To show the effectiveness of the proposed Techniques, two different cases are presented; with and without Adaptive histogram Equalization Techniques.
b. Original Image (without Adaptive Histogram Equalization Technique):
Fig.4 (a) shows the original image. The contrast of the image was low and histogram of the output images in fig.4 (b) shown mostly histogram are present in the left, very little in right and almost nil in between.
(a)
(b)
Figure.3. (a) Original Image (b) Histogram of original Image
0 1000 2000 3000 4000 5000 6000
histeq
0 50 100 150 200 250
0 500 1000 1500 2000 2500 3000 3500
original
c. Image with Adaptive Histogram Equalization Technique:
In fig. 5 (a), fig 5(b) we use adapthisteq to adjust a grayscale image. The simulation studies suggest that adapthisteq produces an output image having evenly distributed values. The Adapthisteq (Adaptive histogram equalization) function is used to adjust the intensity values. adapthisteq transforms the intensity values so that the histogram of the output image approximately matches a specified histogram of the image.
(a)
[image:3.595.351.534.55.455.2]
(b)
Figure. 4. Adaptive histogram Equalization Technique implementation (a) Enhanced Image (b) Histogram
C. Intensity Adjustment Technique:
Image enhancement techniques are used to improve an image. [17]Intensity adjustment is an image enhancement technique that maps an values adjustment in an image can be done by using the imadjust function, [18]where the range of intensity values in the output image can specify.
a. Simulation Studies:
Fig.6 (a) shows a low-contrast original image with its histogram. The values of the histogram of the images shown in Fig 6 (b) that the histogram gathered unevenly in the range.
(a)
(b)
Figure.5 (a) Original Image (b) Histogram of original image
Fig.7 shows, the contrast in low-contrast grayscale image increases by remapping the data values to fill the entire intensity range [0,255].Fig 7 (a,b) displays the Intensity adjustment Technique implemented image and its histogram . the histogram now fills the entire range.
Imadjust function calculates the Simulation studies shows the contrast is increased in the image, and histogram of the image and determines the adjustment limits automatically.
(a) adapthisteq
0 500 1000 1500 2000 2500 3000
adapthiseq
0 50 100 150 200 250
0
5000
10000
15000
[image:3.595.65.258.184.562.2] [image:3.595.345.537.577.759.2](b)
Figure 6. Intensity adjustment Technique implementation (a) Enhanced Image (b) Histogram
D. Contrast Enhancement Technique:
Contrast enhancement technique help to increase or decrease the contrast of an image accordingly. Three functions are particularly used for contrast enhancement:imadjust, histeq, and adapthisteq. In Contrast enhancement technique [19]algorithms first of all thegrayscale image has to be read through imread
i=imread ('matlab.jpg');
Then the Grayscale orColor Image is to be Enhanced .Contrast enhancement technique of the gray scale image is different from the color images.
a. Contrast Enhancement of Grayscale Images:
Contrast enhancement of Grayscale Image can be done by using default settings & compare the effectiveness of the three techniques:
Imadjust Fig 8(a) increases the contrast of the image by mapping the values of the input intensity image to new values such that, by default, 1% of the data is saturated at low and high intensities of the input data.
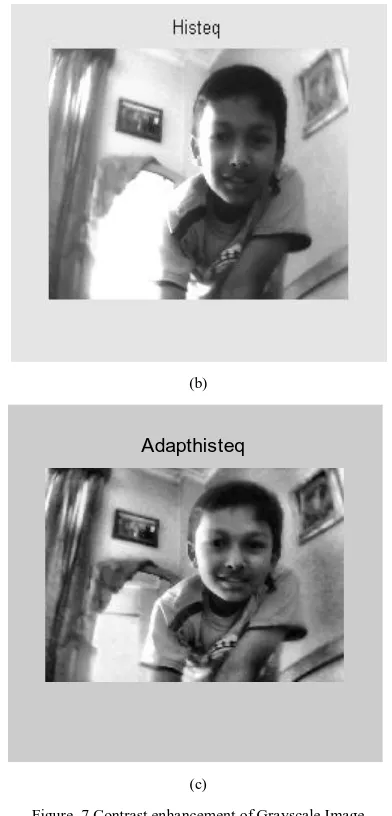
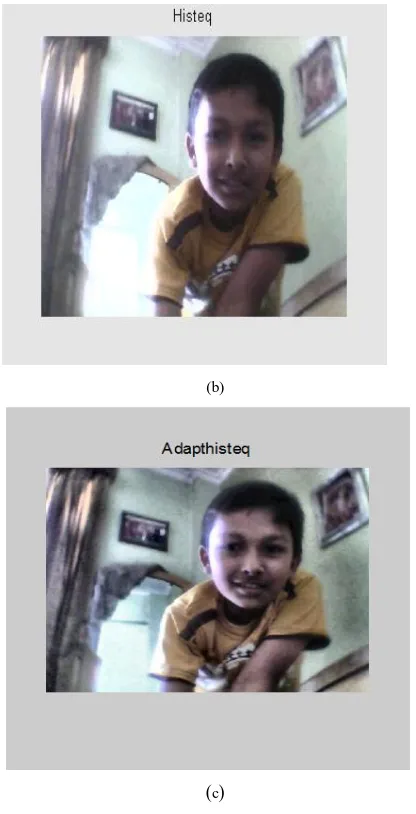
Histeq Fig 8(b) performs histogram equalization. It enhances the contrast of images by transforming the values in an intensity image so that the histogram of the output imageapproximately matches a specified histogram (uniform distribution by default).
adapthisteq Fig 8(c) performs contrast-limited adaptive histogram equalization. Unlike histeq, it operates on small data regions (tiles) rather than the entire image.
(a)
(b)
(c)
Figure 7.Contrast enhancement of Grayscale Image (a) using imadjusttechniques (b) using Histeq techniques(c) using
adapthiseq techniques
b. Contrast Enhancement of Color Images:
Contrast enhancement of color images is done by transforming an image to a color space that has image [20] intensity as one of its components. One such color space is L*a*b*. Color transform function is use to convert the image from RGB to L*a*b* color space, and then work on the luminosity layer 'L*' of the image. When preserving the original colors ,the intensity of the pixels affected by Manipulating the luminosity .
(a)
Adapthisteq
[image:4.595.52.255.56.230.2](b)
[image:5.595.50.258.52.459.2](c)
Figure 8. Contrast enhancement of coloured Image (a) using imadjusttechniques(b) using Histeq techniques (c) using adapthiseq
techniques
III. CONCLUSION
The computer simulation using the MATLAB/Simulink in MATLAB environment in the paper provides a means to improve the interpretability or perception of information in images for human viewers and to provide „better‟ input .The simulation results show the Image enhancement processes consist of a collection of techniques that seek to improve the visual appearance of an image and to convert the image into a better form suited for analysis by a human or a machine. It has been observed from the Fig.1 (a) (b) and Fig.3 (a)-(b) that the original images has low contrast, with most values in the left of the intensity range, but Fig2 (a) (b) the histogram equalization technique and Fig. 4 (a) (b )Adaptive Histogram Equalization techniques produces an output image having values evenly distributed throughout the range. Fig 6 shows, the contrast in low-contrast grayscale image increases by remapping the data values .In Fig.7 increases the contrast of the image, by default, 1% of the data is saturated at low and high intensities of the input data. Fig.8 shows the enhancement of contrast of the coloured image .The histogram of the “original” image is very narrow, while the histogram of the image after implementation of Technique is more spread. It is evident from the results further; the learner can easily visualize the
effects of various techniques and also can analyze the effects on the images by changing various parameters.
IV. REFERENCES
[1]. L. Zadeh, “Fuzzy sets and enhancement,” Information and Control ,vol. 8, no.3, pp. 338– 353, 1965.
[2]. Yeong- Taeg Kim, “Contrast enhancement using brightness preserving bi-histogram equalization,” IEEE Trans. Consumer Electronics, vol. 43, no. 1, pp. 1-8, 1997
[3]. K. Wongsritong, K. Kittayaruasiriwat, F. Cheevasuvit, K. Dejhan, A. Somboonkaew, “Contrast enhancement using multipeak histogram equalization with brightness preserving”, Circuit and System, 1998, IEEE APCCAS 1998. The 1998 IEEE Asia-Pacific Conference on 24-27 Nov. 1998, pp. 455-458, 1998.
[4]. Tizhoosh, H.R., Michaelis, B. (1998): “Improvement of Image Quality Based on Subjective Evaluation and Fuzzy Aggregation techniques”. EUFIT'98, vol. 2, 1998, pp. 1325- 1329.
[5]. S. Ogrenci K. Bazargan NI. Sarrafzadeh, “Image analysis and partitioning for FPGA implementation of image restoration, Image Processing,” IEEE Transaction, 2000, pp.
346-355.
[6]. Sohi, D.S.; Devgan, S.S. “Application to enhance the teaching and understanding of basic image processing techniques”, Proceedings of the IEEE Southeastcon 2000. 7-9 April 2000Page(s): 413– 416.
[7]. A. Rizzi, C. Gatta, and D. Marini, “A new algorithm for unsupervised global and local color correction,” Pattern Recognition Letters, vol. 24,pp. 1663–1677, 2003.
[8]. Y. Wang, Q. Chen, B. Zhang, Soong-Der Chen, and Abd. Rahman Ramli, “Minimum mean brightness error bihistogram equalization in contrast enhancement”, IEEE Transactions Consumer Electron. vol. 49, no. 4, pp. 1310-1319, Nov. 2003.
[9]. Rafael C. Gonzalez, Digital Image Processing Second Ed., Pearson Education, 2004.
[10]. R. T. Tan, K. Nishino, and K. Ikeuchi, “Color constancy through Inverse intensity chromaticity space,” J. Optical Society of America A, vol. 21, no. 3, pp. 321–334, 2004.
[11]. Zhiu Chen, senior member, IEEE, Besma R Abididi, Senior Member IEEE, David L, Page, Member, IEEE, and Mongi A. Abdi, Member, IEEE, Gray-Level Grouping (GLG): An Automatic method for Optimized Image Contrast Enhancement-Part I: The Basic Method, IEEE Transactions on Image Processing Vol.15, No.8, Auguest 2006.
[12]. WANG Zhiming, TAO Jianhua, “A Fast Implementation of Adaptive Histogram Equalization”, IEEE .
[13]. S. Schulte, V. D.Witte, M. Nachtegael, D. V. der Weken, and E. E. Kerre, “Histogram-based fuzzy colour filter for image restoration,” Image and Vision Computing,vol.25,no. 9,pp. 1377–1390, Sep. 2007.
International Conference on Convergence Information Technology, IEEE 2007.
[15]. Atul, Rochak, Saini"Simulation of Image Enhancement Techniques using MATLAB," Proceedings of the First Asia International Conference on Modelling & Simulation,pp. 2007Page(s): 296- 301.
[16]. R. Fattal, “Single image dehazing,” ACM Trans. Graphics, vol. 27, no. 3,Aug. 2008.
[17]. Rekha Lakshmanan, Madhu. S. Nair, M.Wilscy RaoTatavarti, “Automatic Contrast Enhancement for Low Contrast Images: A Comparison of Resent Histogram based Techniques”, Proceedings of the international conference on computer Science and Information Technology-ICCSIT
2008, IEEE- Computer Society press,Singapure,pp.269-276,Aug-Sept,2008.
[18]. M. Abdullah-Al-Wadud, Md. Hasanul Kabir, M. Ali Akber Dewan, Oksam Chae, “A dynamic histogram equalization for image contrast enhancement”, IEEE Transactions. Consumer Electron, vol. 53, no. 2, pp. 593- 600, May2007. [19]. Stephen M. Pizer, R. Eugene Johnston, James P. Ericksen,
Bonnie C. Yankaskas, Keith E. Muller, “Contrast-Limited Adaptive Histogram Equalization Speed and Effectiveness”, IEEE Int. Conf. Neural Networks & Signal Processing, Nanjing, China, December 14-17, 2003.