!
"
#"#
$ % %#
&
''' (
Stock Prediction Model with Business Intelligence using Temporal Data
Mining
Sailesh Iyer*
Senior Lecturer SKPIMCS-MCA,
Gandhinagar [email protected]
Dr. P.V. Virparia
Reader
Department of Computer Science & Technology, Sardar Patel, University
Dr N.N. Jani
Director
SKPIMCS-MCA, Gandhinagar [email protected]
Abstract— The stock market domain is a dynamic and unpredictable environment. Traditional techniques, such as fundamental and technical analysis can provide investors with some tools for managing their stocks and predicting their prices. However, these techniques cannot discover all the possible relations between stocks and thus there is a need for a different approach that will provide a deeper kind of analysis. Data mining can be used extensively in the financial markets and help in stock-price forecasting. We are proposing in this paper a portfolio management solution with business intelligence characteristics. This prototype will serve as a basis for Stock Market Prediction & Portfolio Analysis by Data Mining using Business Intelligence which can benefit users to take informed decisions.
Keywords:Data Mining, Business Intelligence, Portfolio Analysis, Prototype, Prediction, Forecasting. Temporal Data Mining.
I. INTRODUCTION
Stock Markets consist of two types: Primary & Secondary Market. Primary Markets are those markets in which Companies directly approach the Investor through Initial Public Offer or FPO (Follow-on-Public Offer). Secondary Markets give the Investor & traders alike a platform to deal with Equity Shares of various companies from Investment or trading perspective. Stocks are grouped into industry groups according to their primary business focus (e.g. IT, Banks, Manufacturing). A transaction is the willing of an investor to sell some stocks and the request of another to buy them. Stock Markets are experiencing a lot of volatility & the common man often becomes the direct victim of this volatility. Stock market prediction is regarded as a challenging task because of high fluctuation and irregularity.
The work in this area can be classified into three broad strands:
[a] Those dealing with functioning of securities markets and financial institutions operating in these markets, [b] Those pertaining to the investment decision making
process of individuals, and
[c] Empirical work on Indian stock markets.
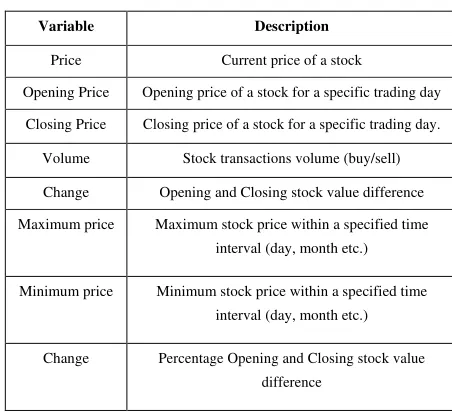
Each stock is not only characterized by its price but also by many others variables. There is an interaction among all these variables and only a deep study could show the behaviour of a stock over time. The main variables are shown in the table below.
Table 1. Stock Variables
Variable Description
Price Current price of a stock
Opening Price Opening price of a stock for a specific trading day
Closing Price Closing price of a stock for a specific trading day.
Volume Stock transactions volume (buy/sell)
Change Opening and Closing stock value difference
Maximum price Maximum stock price within a specified time interval (day, month etc.)
Minimum price Minimum stock price within a specified time interval (day, month etc.)
Change Percentage Opening and Closing stock value
difference
Table 2. Major Stock influencing factors.
Influence Factor Description
P/E factor Price per annual earnings
Volume How many dealings are taking place
Business Sector The sector in which a stock belongs Historical
Behavior
Fluctuation of a stock over time
Rumors The Rule says: “buy on rumors sell on
news” so that may cause some unpredictable behavior
Book (Net Asset) Value
The accounting value of a company
Stock Earnings Percentage difference of the stock price value over period of time
Financial position of a company
The financial status of a company
Uncertainty Are there any unpredictable factors?
A tool is required that collects stock data and after possible stock market trading transactions, when strong evidence of possible profit from these transactions is available. It should also take into consideration the different types of users and their characteristics with respect to the trading strategy that a certain user possesses. The design of the tool consists of monitoring and predicting stock market. In the monitoring part, the user is able to define stock portfolios, to view stock price values over time of companies with similar characteristics (e.g. same business sector, price range, P/E etc.). Other functionalities include access to market and company news, ability of the user to define alerts, which would be triggered on the basis of specific events happening or not.
In the prediction part, the tool helps users to decide on their stock trades. A sequence mining algorithm is used in order to identify frequently occurring sequences of stock fluctuations and thus recommend some good trading opportunities, based on the extracted frequent patterns. However, the algorithm itself does not know what a good opportunity is. Therefore, we need to define interesting measures that will allow the proposed system to discover such opportunities, based always on parameters that represent the user’s trading strategy. The development of such a decision support tool introduces several challenging research issues which are listed as below:
A. The incorporation of user-defined parameters into the
system (preferences, orders) .
B. The pre-processing tasks that must be executed
(definition of temporal hierarchies, generalization).
C. The range of event types that will be used by the
algorithm.
D. The store of the patterns produced by the temporal data
mining algorithm.
E. The evaluation of these patterns (the weight of each
variable) and how the results and the user defined parameters could affect the pre-processing tasks
(optimization, generalization using different
hierarchies).
II. TEMPORAL DATA MINING:
Temporal Data Mining is a research field of growing interest in which techniques & algorithms are applied to data
collected over time. Identifying temporal patterns from the
fluctuation of stock prices is a very complex problem. It is preferable to know the range of variation in both stocks prices, the period of time that this influence is likely to happen and also the statistical significance of the discovered rule.
A. Time Series
A sequence of continuous, real valued elements such as stock prices is known as time series. A fundamental problem that needs to be addressed before any attempt of trend discovery is the representation of the time series.
B. Sequence Mining:
It is considered that the fluctuation of a stock price is the result of previous stock events (buying, selling). Different events could lead to different prices. , the idea is to predict such behaviour in order help the investors to optimize the management of their portfolios.
In contrast, technical analysis depends on historical and time-series data These strategists believe that market timing is critical and opportunities can be found through the careful averaging of historical price and volume movements and comparing them against current prices.
Technicians also believe that there are certain high/low psychological price barriers such as support and resistance levels where opportunities may exist
They further reason that price movements are not totally random, however, technical analysis is considered to be more of an art form rather than a science and is subject to interpretation.
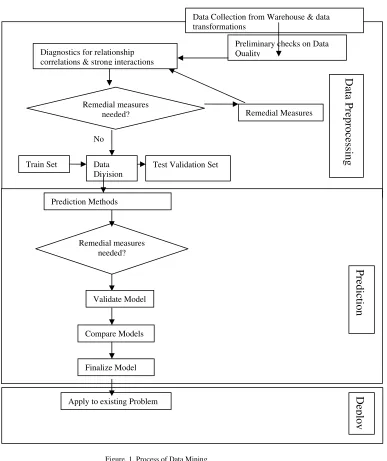
Figure. 1. Process of Data Mining
III. THE PROTOTYPE
A. Architectural Design of Tool:
The following architecture is planned which can be useful in solving the major problems related to stock monitoring & prediction.
The update component consists of a set of agents who communicate with the web sources to retrieve data and store them locally. The data format is not the same for all the sources so there is the need for dedicated, to the sources, agents. Obviously each agent should check if the data have been already updated by another source so that data consistency is guaranteed. The agents can be scheduled to update automatically the data every business day. Finally, each agent will be responsible for the cleaning and preparation of the data before their storing in the main database of the system.
The ETL (Extract-Transform-Load) component consists of a set of tools that are responsible for the preparation of the data before a data mining algorithm uses them. Of course these tools depend on the specific algorithms hence each algorithm needs its own tool.
The sequence mining algorithm that was used (data mining engine component) needs a specific input in order to run. The ETL component should prepare a table in the database with just two fields: Event description, Event timestamp. The Event description represents the description of the event, i.e. the event type that occurred on the Event timestamp.
The evaluation component is the intelligent part of the whole system. It takes the set of rules produced by the sequence mining algorithm and it tries to understand the meaning of these. Specifically, it tries to adapt the results to Train Set Data Test Validation Set
Division No
Prediction Methods
Remedial measures needed?
Validate Model
Compare Models
Finalize Model
Apply to existing Problem
P
re
d
ic
tio
n
Remedial measures
needed? Remedial Measures
D
ep
lo
y
D
at
a
P
re
p
ro
ce
ss
in
g
Diagnostics for relationship correlations & strong interactions
Data Collection from Warehouse & data transformations
the user’s preferences and needs and to provide suggestions. A major task of this component is to decide whether a produced rule (pattern) strengthens or not an already stored one. The tool includes an algorithm which searches for equal patterns (common LHS and RHS) and decides to update or not the one that is already stored.
Data warehouses are used to support the integration of many, distributed data sources and the application of OLAP technology. Decision making needs aggregated, statistical data and not raw data that are stored and used only for operational purposes
The “automatic reaction” component has been included for a more complete view of the system. It could be a future characteristic which will be based on alerts and triggers that will act when some predefined events occur.
IV. FUNCTIONALITY OF THE PROTOTYPE
This phase exhibits the main capabilities/functionalities of the proposed prototype. There will be a main form where the user can see market news, stock prices (imported from Finance related (Moneycontrol.com, rediff stocks etc.) Web Service and perform a number of operations using either the menu bar or the tabs.
The user can create portfolios that contain stocks belonging to many different business sectors of the stock market. Each portfolio is related with monthly, weekly or daily prices and a risk is specified for it. Users can select to view the stocks per portfolio, per category (sector) of a portfolio or per category (sector). Graphical Analysis charts will also be available to the user which will allow him/her to track the stock specific actions more accurately & easily.
What-if scenarios analysis is an important part of modern decision support tools. It provides the user with the capability to create custom scenarios and to receive answers to their questions. The proposed system allows the user to create scenarios that include the stock prices behaviour and other external events. Examples are as follows:
“What will happen when the price of petrol/oil reaches the (close/open fluctuation level, high/low fluctuation level and volume level) or some external events (elections, oil prices).
The formulated SQL statement is executed against the patterns warehouse which includes the sequences of events produced by the execution of the main sequence mining algorithm. After the execution of the SQL statement the results are presented in a user friendly tree grouped by the different stocks (or other event types). Therefore, a user can ask what will happen when event type A occurs and receive categorized answers.
The proposed tool is an intelligent stock market tool so it should provide capabilities of suggesting to buy or to sell stocks. Furthermore, alarms are used to remind users of these suggestions.
Three major factors are taken into consideration; the risk level, the buying price and the need for cash. When the
user asks for suggestions then the stored patterns are preferences are presented.
If the user needs cash immediately then the system looks for rules that determine the fall of some stocks. The investors can sell this stock before it falls so that they earn some more money. . Of course the buying price should be taken into consideration and this is the reason why the investor is informed about the profit or the loss.
The most intelligent capability of this system is to protect the investors from taking risky decisions. A mechanism will be used to examine rules such as “When Reliance goes up by 3 %( Event Type-A) then HUL (Defensive Sector) goes down 5% (event type B) in 0-15 days”. The obvious behaviour of the tool would be to suggest to the users to buy Reliance stocks so that when B happens they sell the Reliance stocks and they gain profit. The system checks the historical prices and presents the profit level to the user.
Market News related to the stock under enquiry from the user is displayed to the user so that the user is also well informed about the stock held. Also advice to exit the stock is given if the target price is achieved.
V. WORK IN THE RELATED AREA
In the area of Stock Prediction very less concrete work has been done as of now. Much work has been done using Time Series Data Mining. The presented approach is concerned with the analysis of the impact of trade-specific and market-specific features on trading styles.
VI. CONCLUSIONS & FURTHER
Future work could include the enrichment of the current tool and its expansion with a component that will combine data mining and technical analysis capabilities. The core intention of a successful investor is to catch trends in their early beginning or to technically capture it when it is still in progress. The aim is not to buy cheap stocks but these that present an upward tendency. After a medium term interval and when the stocks that were bought start to present a downward tendency, the investor sells the stocks and earns profit. Technical analysis can provide the user with answers about these tendencies. The answers are hidden on the charts; this is the philosophy of technical analysis. In fact, technical analysis focuses on the chart of a stock and does not try to relate one stock with some others in order to discover some common or correlated behaviour.
Figure.2. Architecture of the System Source1
Source 2
Source N
WEB
Agent 1
Agent 2
Agent N
Update Manager Stock
Market Data
Data Preparation Data Mining Engine Intelligent Evaluation
Data Warehousing (OLAP)
Pattern Storage
Stock Monitoring Automatic Reaction
Market News
Web Service Portfolio Monitoring
VII. REFERENCES
[1] Das, G., Gunopulos, D., Mannila, H.: Finding Similar
Time Series. Proc. 3rd Int. Conf. Knowledge Discovery
and Data Mining (KDD ’97), Newport Beach, California, USA (1997) 88-100
[2] Agrawal, R., Faloutsos, C., Swami, A.: Efficient
Similarity Search in Sequence Databases. Proc. 4th Int.
Conf. Foundations of Data Organizations and Algorithms (FODO ’93), Chicago, IL USA (1993) 69-84
[3] Agrawal, R., Srikant, R.: Mining sequential patterns.
Proc. 11th Int. Conf. Data Engineering (ICDE ’95),
Taipei, Taiwan (1995) 3-14 . [a] www.moneycontrol.com [b] www.rediffstocks.com [c] www.icicidirect.com
[4] Pediaditakis, K.: A Temporal Data Mining Approach for the Extraction of Optimal Temporal Constraints of Sequential Patterns on Event Sequences. MPhil Thesis, School of Informatics, Faculty of Humanities, University of Manchester (2005).
[5] Weigend, A., Chen, F., Figlewski, S., Waterhouse, S.R.: Discovering Technical Trades in the T-Bond Futures
Market. Proc. 4th Int. Conf. Knowledge Discovery and