! "
# # "$ % %#
& ''' (
On the Utilization of ID-based Connected Dominating Sets for Mobile Ad hoc Networks
Narmathan Velummylum
Undergraduate Student, Department of Computer Science North Carolina State University
Raleigh, NC, USA [email protected]
Natarajan Meghanathan*
Assistant Professor, Department of Computer Science Jackson State University
Jackson, MS, USA [email protected]
Abstract:The design of routing protocols based on connected dominating set (CDS) has been recognized as a suitable approach for routing in mobile ad hoc networks (MANETs). There are multiple ways to form a CDS within a given MANET, and the algorithm used for CDS formation will affect the performance and lifetime of the CDS and the performance of the MANET as a whole. In this study, the well-known ID-based CDS (ID-CDS) formation method is analyzed and compared to the commonly used method of maximum density based CDS (MaxD-CDS) formation. The idea of the ID-CDS approach is to select nodes with larger node IDs to be part of the CDS, whereas the MaxD-CDS approach prefers nodes with a larger number of uncovered neighbors (a larger density) for CDS selection. Simulation results reveal that the ID-based CDS has a significantly longer lifetime in comparison to the MaxD-CDS; an extended CDS lifetime can directly bring performance improvement to the entire MANET. In our performance simulations, the ID-based CDS is also observed to incur a relatively larger number of nodes and edges, a factor that helps to lower the average hop count and hence the end-to-end delay.
Keywords:Connected Dominating Set; Node ID; Density; Mobile Ad hoc Networks; Stability; Simulations
I. INTRODUCTION
A mobile ad hoc network (MANET) is a type of communication network that lacks infrastructure; only subscriber units (mobile wireless nodes) are necessary to form the network. It is a dynamic distributed system of arbitrarily moving wireless nodes that operate on a limited battery charge [3]. A MANET operates on a limited bandwidth and a limited transmission range per node. Due to these limitations, two mobile nodes in a MANET can communicate directly with each other through a single-hop routing path only if their positions are close enough (if they are within each other’s transmission range). Otherwise, a multi-hop routing path is needed to carry out communication, making multi-hop communication very common in MANETs. Since node mobility frequently causes unpredictable topological changes, the task of finding and maintaining routing paths in MANETs is not trivial [1]. There have been extensive studies to optimize route discovery within a MANET.
Among the routing algorithms and protocols proposed for MANETs, routing based on a connected dominating set (CDS) has been recognized as a suitable approach in adapting quickly to the unpredictable fast-changing topology and dynamic nature of a MANET [10]. It is considered adaptable because as long as topological changes do not affect the structure of the CDS, there is no need to reconfigure the CDS since the routing paths based on the CDS would still be valid.
A MANET is often represented as a unit disk graph [6] built of vertices and edges, where vertices signify nodes and edges signify bi-directional links that exist between any two nodes if they are within each other’s transmission range. In a given graph representing a MANET, a CDS is a dominating set within the graph whose induced sub graph is connected. A dominating set of a graph is a vertex subset, such that every vertex is either in the subset or adjacent to a vertex in
the subset [3]. Routing based on a CDS within a MANET means that routing control messages will be exchanged only amongst the CDS nodes and not broadcast by all the nodes in the network; this will reduce the number of unnecessary transmissions in routing [2].
There are multiple ways to form a CDS within a given MANET, and the algorithm used for CDS formation will affect the performance and lifetime of the CDS and the performance of the MANET as a whole. A popular approach in CDS formation is attempting to form the smallest possible CDS within a MANET, a minimum connected dominating set (MCDS). Reducing the size of the CDS will mean reducing the number of unnecessary transmissions. Unfortunately, the problem of determining a MCDS in an undirected graph like that of the unit disk graph is NP-complete [2][9]. Efficient heuristics [7][8][9] have been proposed to approximate the MCDS in wireless ad hoc networks. A common thread among these heuristics is to give the preference of CDS inclusion to nodes that have high neighborhood density. The MaxD-CDS heuristic [2] that we study in this paper is one such heuristic.
significant impact on the lifetime per CDS as well as on the other performance metrics measured.
We compare the performance of the ID-CDS against that of the MaxD-CDS through extensive simulations. Simulation results reveal that the ID-based CDSs have a significantly longer lifetime in comparison to the MaxD-CDSs. The trade-off is the inclusion of a larger number of nodes and edges in the ID-CDS; however, this is a quality that helps the ID-CDS maintain a relatively lower average hop count per source-destination path. To the best of our knowledge, we could not find such an extensive comparison between the ID-based CDS and the maximum density-based CDS approaches, with respect to the stability of the CDS, in the literature.
The rest of the paper is organized as follows: Section II describes the ID-based CDS formation algorithm as well as the MaxD-CDS formation, and provides the corresponding pseudo-code. In addition, we also provide an example of how both the algorithms construct a CDS within a MANET. Section III illustrates how we handle CDS reconfiguration by providing an algorithm that we use to check the existence of a CDS at any time instant, and also discuss the randomization-based reconfiguration of the CDS. Section IV discusses the simulation environment and conditions; presents and analyzes the simulation results obtained for ID-CDS (with and without randomization) vis-à-vis MaxD-CDS, with respect to metrics such as CDS lifetime, number of nodes per CDS, number of edges per CDS and the hop count per path. Section V draws the conclusions and suggests possible future extensions of this work.
II. ALGORITHMS TO DETERMINE ID-BASED CDS AND MAXIMUM DENSITY (MAXD)-BASED CDS
A. Primary Data Structures and Breadth First Search We use the following principal data structures for our two CDS formation algorithms:
(i) CDS-Node-List – includes all nodes that are members of the CDS
(ii) Covered-Nodes-List – includes all nodes that are in the CDS-Node-List and all nodes that are adjacent to at least one member of the CDS-Node-List. Before we run the CDS formation algorithm, we make sure the underlying network graph is connected by running the Breadth First Search (BFS) algorithm [5]; because, if the underlying network graph is not connected, we would not be able to find a CDS that will cover all the nodes in the network. We run BFS, starting with an arbitrarily chosen node in the network graph. If we are able to visit all the vertices in the graph, then the corresponding network is said to be connected. If the graph is not connected, we simply collect a snapshot of the network topology at the next time instant and start with the BFS test.
B. Algorithm to Determine ID-based CDS
The idea of the ID-based CDS formation algorithm is to select nodes with larger IDs for inclusion in the CDS. The algorithm forms and outputs a CDS based on a given input graph representing a snapshot of the MANET at a particular time instant. Specifically, the algorithm outputs a list ( CDS-Node-List) of all nodes that are part of the CDS formed based on the given MANET. The first node to be included in the CDS-Node-List is the node with the largest ID amongst
all the nodes in the network. A CDS member is considered to be “covered”, so a CDS member is additionally added to the Covered-Nodes-List as it is added to the CDS-Node-List. All nodes that are adjacent to a CDS member are also said to be covered, so the uncovered neighbors of a CDS member are also added to the Covered-Nodes-List as the member is added to the CDS-Node-List. To determine the next node to be added to the CDS-Node-List, we must select the node with the largest ID amongst the nodes that meet the criteria for inclusion into the CDS. The criteria for CDS membership selection are the following: the node cannot already be a part of the CDS (CDS-Node-List), the node must be in the Covered-Nodes-List, and the node must have at least one uncovered neighbor (at least one neighbor that is not in the Covered-Nodes-List). Amongst all the nodes of the network that meet these criteria for CDS membership inclusion, we select the node with the largest node ID to be the next member of the CDS. This process is repeated until all the nodes in the network are included in the Covered-Nodes-List. Once all the nodes in the network are considered to be “covered”, the CDS has been formed and the algorithm returns a list of the members included in the resultant ID-CDS (nodes in the CDS-Node-List).
Input: Graph G = (V, E); V – vertex set, E – edge set Source vertex, s – vertex with the largest ID in V
Auxiliary Variables and Functions:
CDS-Node-List, Covered-Nodes-List, Neighbors(v) for every v in V
Output: CDS-Node-List
Initialization: Covered-Nodes-List = {s}
CDS-Node-List =
Begin Construction of ID-CDS while ( |Covered-Nodes-List| < |V| ) do
Select a vertex r∈Covered-Nodes-List and r∉CDS-Node-List such that r has the largest ID and has at least one neighbor that is not in Covered-Nodes-List
CDS-Node-List = CDS-Node-List U {r}
for all u∈Neighbors(r) and u∉Covered-Nodes-List Covered-Nodes-List = Covered-Nodes-List U {u}
end for end while
return CDS-Node-List
End Construction of ID-CDS
Figure 1. Pseudo Code for the Algorithm to Construct ID-based CDS
C. Algorithm to Determine MaxD-CDS
covered, so the uncovered neighbors of a CDS member are also added to the Covered-Nodes-List as the member is added to the CDS-Node-List. To determine the next node to be added to the CDS-Node-List, we must select the node with the largest density amongst the nodes that meet the criteria for inclusion into the CDS. The criteria for inclusion into the MaxD-CDS are same as the criteria for inclusion into the ID-based CDS. Amongst the nodes that meet these criteria for CDS membership inclusion, we select the node with the largest density (i.e., the largest number of uncovered neighbors) to be the next member of the CDS. Ties are broken arbitrarily. This process is repeated until all nodes in the network are included in the Covered-Nodes-List. Once all nodes in the network are considered to be “covered”, the CDS has been formed and the algorithm returns a list of the members included in the resultant MaxD-CDS (nodes in the CDS-Node-List).
Input: Graph G = (V, E); V – vertex set, E – edge set Source vertex, s – vertex with the largest number of uncovered neighbors in V
Auxiliary Variables and Functions:
CDS-Node-List, Covered-Nodes-List, Neighbors(v) for every v in V
Output: CDS-Node-List
Initialization: Covered-Nodes-List = {s}
CDS-Node-List =
Begin Construction of MaxD-CDS while ( |Covered-Nodes-List| < |V| ) do
Select a vertex r
∈
Covered-Nodes-List and r∉CDS-Node-List such that r has the largest number of uncovered neighbors that are not in Covered-Nodes-ListCDS-Node-List = CDS-Node-List U {r}
for all u
∈
Neighbors(r) and u∉Covered-Nodes-List Covered-Nodes-List = Covered-Nodes-List U {u}end for end while
return CDS-Node-List
[image:3.612.333.540.52.97.2]End Construction of MaxD-CDS
Figure 2. Pseudo Code for the Algorithm to Construct Maximum Density (MaxD)-based CDS
D. Example to Illustrate Construction of ID-CDS and MaxD-CDS
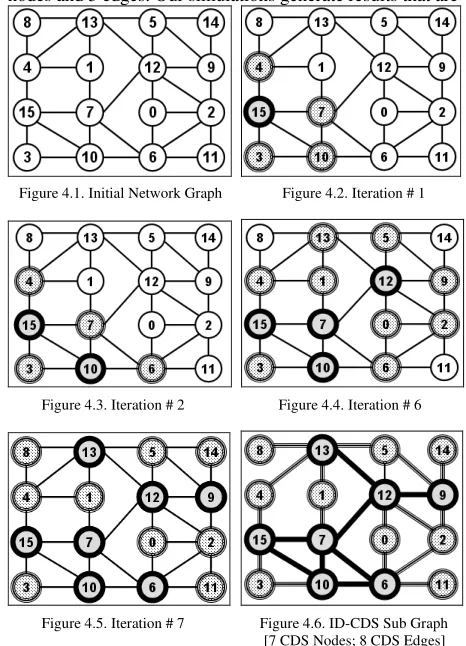
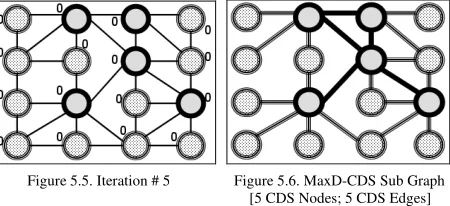
Figures 4 and 5 illustrate examples to demonstrate the working of the ID-based CDS and MaxD-CDS algorithms respectively. In these figures, each circle represents a node in the network graph. Furthermore, in these figures, CDS nodes are represented with a thick black-bordered circle and gray-shaded inside; covered nodes (i.e., a non-CDS node covered by at least one CDS node) are represented with a thick gray-bordered circles and black dots inside the circle; the non-covered nodes (i.e., nodes not yet covered by even one CDS node) are represented with a black thin circle and no shade or dots inside the circle. For the ID-based CDS illustration (Figure 4), the integer inside each node circle represents the node ID. For the MaxD-CDS illustration (Figure 5), the integer outside of each node circle represents the number of uncovered neighbors for the corresponding node. Figure 3 is the legend for Figures 4 and 5.
Figure 3. Legend for Figures 4 and 5
For the 16-node network examples depicted in Figures 4 and 5, it takes 7 iterations to form the ID-based CDS and 5 iterations to form the MaxD-CDS. The ID-based CDS constructed in Figure 4 consists of 7 nodes and 8 edges; while the MaxD-CDS constructed in Figure 5 consists of 5 nodes and 5 edges. Our simulations generate results that are
Figure 4.1. Initial Network Graph Figure 4.2. Iteration # 1
Figure 4.3. Iteration # 2 Figure 4.4. Iteration # 6
[image:3.612.319.552.166.489.2]
Figure 4.5. Iteration # 7 Figure 4.6. ID-CDS Sub Graph [7 CDS Nodes; 8 CDS Edges]
Figure 4. Example to Illustrate the Construction of an ID-CDS
Figure 5.1. Initial Network Graph Figure 5.2. Iteration # 1
[image:3.612.323.552.512.710.2]
[image:4.612.63.288.51.154.2]
Figure 5.5. Iteration # 5 Figure 5.6. MaxD-CDS Sub Graph [5 CDS Nodes; 5 CDS Edges]
Figure 5. Example to Illustrate the Construction of a Maximum Density-based CDS (MaxD-CDS)
similar to these examples. In simulation, the ID-based CDS includes relatively more nodes and edges than the MaxD-CDS; this helps to inrease the stability of the CDS, allowing it to sustain a longer lifetime. The relatively larger CDS node size and edge size also helps to lower the average hop count per source destination path, which would indirectly help to reduce the end-to-end delay and energy consumed per data packet.
III. ALGORITHM TO CHECK CDSEXISTENCE AND RANDOMIZATION-BASED RECONFIGURATION OF ID-CDS
A. Algorithm to Check the Existence of a CDS
A CDS is used as long as it exists. If the CDS structure gets destroyed due to the dynamic nature of the MANETs or the limited battery charge of the nodes, CDS reconfiguration becomes inevitable. In other words, if the CDS ceases to exist, we must reinitiate the CDS formation algorithm to determine a new CDS for use during subsequent time instants. In order to decide whether we could use the currently known CDS or opt for a new CDS, we use a validation algorithm (adapted from [11]) to check the existence of the currently known CDS (applicable to both ID-CDS and MaxD-CDS) at any particular time instant t. To utilize the CDS validation algorithm of [11], we must construct a list of edges (CDS-Edge-List) that exist between any pair of nodes in the given known CDS-Node-List (the list of nodes in the CDS) at the particular time instant t for which we want to evaluate the existence of the CDS. An edge exists between two nodes if and only if the Euclidean distance between the co-ordinates of the two nodes is less than or equal to the transmission range per node [11].
The CDS validation algorithm (refer Figure 6) works as follows: We run the well known Breadth First Search (BFS) algorithm [5] on the CDS-Node-List and the CDS-Edge-List to evaluate whether the underlying CDS is connected or not. If the CDS is observed to be not connected, then the algorithm returns false and the appropriate CDS formation algorithm is initiated to form a new CDS based on the current MANET. If the CDS is connected, we then test whether every non-CDS node in the network is a neighbor of at least one CDS node. If there exists at least one non-CDS node that is not a neighbor of any non-CDS node at time t, the algorithm returns false – necessitating the instantiation of the appropriate CDS construction algorithm. If every non-CDS node has at least one non-CDS node as neighbor, the algorithm returns true – the current CDS covers the entire network and there is no need to determine a new CDS; the current CDS can continue to be used for as long as it exists.
Input:CDS-Node-List // Set of vertices part of the CDS
Auxiliary Variables and Functions:
CDS-Edge-List – Set of edges,
⊆
E, between the vertices that are part of CDS-Node-ListconnectedCDS – Boolean variable that stores information whether CDS-Node-List and CDS-Edge- List form a connected sub graph of G.
Output:true or false
// true, if the nodes in CDS-Node-List form a connected sub graph of G and every vertex v∉CDS-Node-List is a neighbor of a vertex u∈CDS-Node-List
// false, if the nodes in CDS-Node-List do not form a connected sub graph of G and/or there exists at least one vertex v
∉
CDS-Node-List that has no neighbor in CDS-Node-ListInitialization:
CDS-Edge-List =
Begin CDS-Validation
for every pair of vertices u, v
∈
CDS-Node-List doif there exists an edge (u, v)
∈
E at time instant tthenCDS-Edge-List = CDS-Edge-List U {(u, v)}
end if end for
connectedCDS = Breadth-First-Search(CDS-Node-List, CDS-Edge-List) ifconnectedCDS = true then
for every vertex v
∉
CDS-Node-Listdoif there exists no edge (u, v)
∈
E where u∈
CDS-Node- List at time instant tthenreturnfalse
end if end for
return true
end if
returnfalse // if connectedCDS = false
End CDS-Validation
Figure 6. Pseudo Code for the CDS Validation Algorithm
Covered-Nodes-List is filled with the randomized IDs of these neighbor nodes.
Our hypothesis for incorporating randomization before every ID-CDS reconfiguration is that since the selection of nodes into the ID-CDS is purely based on node IDs, if we do not redistribute the node IDs for the purpose of CDS inclusion, the same set of nodes are more likely to get added
to the ID-CDS and the lifetime of the ID-CDS would be then heavily dependent on the mobility of such nodes that have a relatively larger ID. Also, randomly redistributing the node IDs before every ID-CDS reconfiguration step would increase the fairness of node usage, especially with respect to energy consumption and the time of first node failure, and
[image:5.612.62.551.66.222.2]
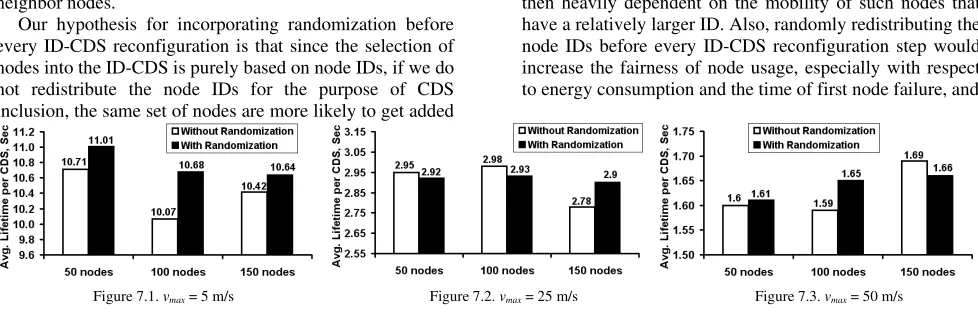
Figure 7.1. vmax= 5 m/s Figure 7.2. vmax= 25 m/s Figure 7.3. vmax= 50 m/s
Figure 7. Average Lifetime per ID-CDS (without Randomization and with Randomization)
do not overuse certain nodes at the cost of others.
We thus conducted our simulations for ID-CDS, with and without randomization, and measured the effect on the average lifetime per CDS, the number of nodes per ID-CDS, the number of edges per ID-CDS as well as the hop count per ID-CDS. A surprising observation is that we do not see any significant impact of randomization on the above performance metrics. The difference in the lifetime per ID-CDS (illustrated in Figure 7) with and without randomization is more at low node mobility compared to high node mobility. At low node mobility, since the topology remains relatively static, randomization does help to a certain extent (i.e. increase the lifetime per ID-CDS); however, the increase is only by a factor of at most 6%. As we increase node mobility and/or the network density, the impact of randomization on the lifetime per ID-CDS is very minimal. The impact of randomization on the other performance metrics studied in this paper is also similar.
We also conjecture that the choice of the mobility model could have influenced the impact of randomization on the performance metrics for the ID-based CDS. We used the well-known Random Waypoint MANET mobility model for all of our simulations. According to this model, the velocity with which the nodes keeps randomly changing with time within a range [vmin,…, vmax]. No node is struck with a particular velocity for the entire simulation time. This helps to significantly delineate the influence of node IDs on the lifetime of the ID-CDS as a node may be moving with different velocities at different time instants during the simulation. In future work, we would study the impact of randomization on the ID-CDS under different mobility models, especially those mobility models for which different nodes are destined to move at different velocity for the entire simulation time period.
IV. SIMULATIONS AND RESULTS
The implementation of the two CDS algorithms as well as all of the simulations has been conducted in a discrete-event simulator developed by the authors in Java. The dimensions of the network topology are 1000 m x 1000 m. The network density is represented as a measure of the average neighborhood size, which is calculated as follows: N* R²/A, where N is the number of nodes in the network, R is the transmission range of a node, and A is the network area [2]. The transmission range per node in all of our
simulations is 250 meters. Using a fixed transmission range and network area, we vary network density between levels of low, medium, and high, by altering the number of nodes (N) in the network. In our simulations, we use networks built of 50 nodes, 100 nodes, and 150 nodes to represent networks of low, medium and high density respectively.
We make use of the Random Waypoint mobility model [4], one of the most widely used models for simulating mobility in MANETs [2]. The model works as follows: each node starts moving from an arbitrary location to a random destination with a random speed in the range of [vmin ... vmax]. Once the destination is reached, the node stops there for a pause time before continuing on to another randomly selected destination with a new randomly selected speed. The minimum velocity per node, vmin, as well as the pause time of the nodes is set to 0. The values of vmax are varied between 5 m/s, 25 m/s, and 50 m/s to represent levels of low, medium and high mobility respectively.
Under each of the above simulation conditions, we generate mobility trace files for a simulation time of 1000 seconds. We sample the network topology every 0.25 seconds. If a CDS ceases to exist at a particular time instant, we reinitiate the appropriate CDS formation algorithm.
A. Performance Metrics
The following performance metrics are measured in our simulations. Each data value in Figures 7 through 11 is an average computed over 10 mobility trace files and 10 randomly chosen source-destination (s-d) pairs from each file. The values reported for the ID-based CDS in Figures 8 through 11 are those obtained with randomization before every time instant the CDS is reconfigured.
CDS Node Size: This is a time-averaged value of the number of nodes included in the CDS, over the entire duration of the simulation.
CDS Edge Size: This is a time-averaged value of the number of edges connecting nodes that are part of the CDS, over the entire duration of the simulation. CDS Lifetime: This is the time elapsed between the construction of a CDS and its destruction, averaged over the entire duration of the simulation.
B. CDS Node Size
The ID-based CDS includes more nodes than the MaxD-CDS (refer to Figure 8). This difference in node size can be attributed to the criteria used to form the CDS. The aim of the MaxD-CDS is to approximate a minimum CDS (MCDS) within the MANET. The MaxD-CDS tries to minimize the number of nodes in the CDS by giving preference for CDS
inclusion to the candidate node with the largest number of uncovered neighbors. It tries to cover as much of the network as possible with the addition of each new node to the MaxD-CDS, leading to an overall reduction in the number of CDS nodes by the time all nodes in the network are covered. The ID-based CDS formation, on
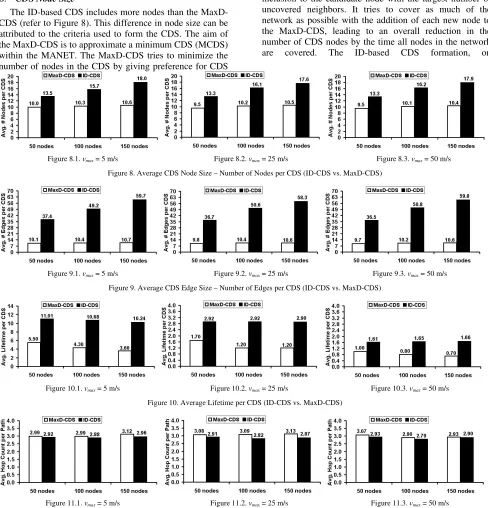
[image:6.612.61.549.58.566.2]
Figure 8.1. vmax= 5 m/s Figure 8.2. vmax= 25 m/s Figure 8.3. vmax= 50 m/s
Figure 8. Average CDS Node Size – Number of Nodes per CDS (ID-CDS vs. MaxD-CDS)
Figure 9.1. vmax= 5 m/s Figure 9.2. vmax= 25 m/s Figure 9.3. vmax= 50 m/s
Figure 9. Average CDS Edge Size – Number of Edges per CDS (ID-CDS vs. MaxD-CDS)
Figure 10.1. vmax= 5 m/s Figure 10.2. vmax= 25 m/s Figure 10.3. vmax= 50 m/s
Figure 10. Average Lifetime per CDS (ID-CDS vs. MaxD-CDS)
Figure 11.1. vmax= 5 m/s Figure 11.2. vmax= 25 m/s Figure 11.3. vmax= 50 m/s
Figure 11. Average Hop Count per Source-Destination Path (ID-CDS vs. MaxD-CDS)
the other hand, does not give much consideration to the number of uncovered neighbors of a node before adding a node to the CDS. It gives preference for CDS inclusion to the candidate node with the largest ID and with at least one uncovered neighbor. As a result, the number of nodes included in the ID-based CDS is relatively higher than number of nodes included in the MaxD-CDS.
From our results, we observe that the node size of the ID-based CDS is 1.40 (at low network density) to 1.68 (at high network density) times larger than the node size of the MaxD-CDS. In observation of the MaxD-CDS, we find that the MaxD-CDS node size increases only by at most 10% when we increase the network density from low to high. On
C. CDS Edge Size
The MaxD-CDS algorithm ends up selecting CDS nodes that are far away from each other since it aims to select nodes that cover as many uncovered neighbors as possible. Since the nodes of the MaxD-CDS are more likely to be far away, the number of edges between the MaxD-CDS nodes tends to be very low (an edge can only exist between two nodes if they are within each other’s transmission range). The ID-based CDS, however, incurs a larger node size and subsequently incurs a correspondingly larger number of edges between CDS nodes (refer to Figure 9).
From our results, we observe that the edge size of the ID-based CDS is 3.75 (at low network density) to 5.5 (at high network density) times larger than the edge size of the MaxD-CDS. In observation of the MaxD-CDS, we find that the edge size increases only by at most 7% as we increase the network density from low to high. On the other hand, the edge size of the ID-based CDS is found to increase as large as by 59% as we increase the network density from low to high. The increase in the CDS node size can explain this corresponding increase in the ID-CDS edge size. A node size and edge size that is relatively larger than that of the MaxD-CDS contributes to the longer lifetime of the ID-based CDS (refer Section 4.4). For a given network density, the edge size of the MaxD-CDS and ID-based CDS does not change appreciably, as we increase the node mobility from low to high.
D. CDS Lifetime
The relatively larger node size and edge size of the ID-based CDS contribute to its significantly longer lifetime (refer to Figure 10). Due to the inclusion of more nodes into the ID-based CDS, the edges between the ID-CDS nodes are bound to exist for a longer time and the connectivity of the nodes that are part of the ID-CDS is likely to be maintained for a longer time. The MaxD-CDS, however, is likely to select nodes that are far away from each other to be part of the CDS. The edges between such nodes are likely to fail sooner, leading to loss of connectivity between the nodes that are part of the MaxD-CDS [2][11]. Thus, we realize a tradeoff between CDS lifetime and CDS node size. If we choose to form the CDS based on node ID (ID-CDS) instead of neighborhood density (MaxD-CDS), the CDS lifetime can be significantly improved – the tradeoff being an increase in the number of nodes per CDS.
From our results, we observe that the lifetime of the ID-based CDS is 1.72 (at low network density) to 5.5 (at high network density) times longer than the lifetime of the MaxD-CDS. The higher stability and lifetime of the ID-based CDS can be explained by the inclusion of a relatively larger number of nodes and edges into the CDS. The number of nodes in the ID-based CDS is still around only 27% (low density), 16% (moderate density) and 12% (high density) of the total number of nodes in the network. In other words, the ID-based CDS does not need a significantly larger number of nodes to have a comparatively longer lifetime. The substantial increase (as large as by a factor of 5.5 at high network density) in the lifetime for the ID-based CDS is achieved with at most only a 68% increase in the CDS node size, compared to the MaxD-CDS.
E. Hop Count per Path
The average hop count per path (refer Figure 11) between an s-d pair through the MaxD-CDS is 3% to 10% larger than the average hop count of the ID-based CDS. The slightly lower hop count of the s-d paths using an ID-based CDS can be explained by the relatively larger number of nodes in CDS and the larger number of edges connecting those CDS nodes. With fewer edges and nodes in the MaxD-CDS, the paths between any two nodes through the MaxD-CDS nodes will have a relatively larger hop count.
If the CDS incurs a relatively larger average hop count per path and a lower average CDS node size, as the MaxD-CDS does, it can suffer from unfairness in node usage and a larger end-to-end delay per data packet. Since there are fewer nodes in the MaxD-CDS than the ID-CDS, the nodes of the MaxD-CDS are likely to get heavily used and overstressed more quickly; this can cause the premature failure of critical nodes, reducing the network connectivity in the case of the MaxD-CDS. With a moderately larger number of CDS nodes and edges connecting those nodes, the ID-based CDS can incur a lower end-to-end delay in packet distribution and enhance the fairness of node usage.
V. SIMULATIONS AND FUTURE WORK
Simulation results show that the ID-based CDS can be more stable than MaxD-CDS. The increased stability can bring direct performance improvement to the CDS as well as the entire MANET. We have shown through extensive simulations that the ID-based CDS algorithm can form a CDS with a significantly longer average lifetime than a CDS constructed by the MaxD-CDS algorithm. We have also illustrated that the ID-based CDS includes a relatively larger number of nodes and edges; this quality contributes to the lower average hop count per path and the improved fairness of node usage when using an ID-based CDS. We thus observe a tradeoff between CDS node size and CDS lifetime. If we choose to form the CDS based on node ID (ID-CDS) instead of neighborhood density (MaxD-CDS), the CDS lifetime can be significantly improved at the cost of a relatively larger node size. However, the percentage difference between the lifetime per ID-CDS and MaxD-CDS (as large as 450%) is significantly larger than the percentage difference between the number of nodes per ID-CDS and MaxD-CDS (as large as only by 68%).
As future work, we will study the energy consumption and the time of first node failure (node lifetime) for an ID-CDS constructed with and without randomization; this would help us to evaluate the impact of randomization on the fairness of node usage in an ID-CDS. We will study the impact of mobility models on the stability of the ID-CDS, with and without randomization. We also plan to develop and study the performance of a hybrid ID-Density-CDS wherein we will consider both the node ID and the number of neighbors per node to determine the weight associated for a node; the next node to be added to the hybrid ID-Density-CDS is the node (that has at least one uncovered neighbor) with the largest weight.
VI. ACKNOWLEDGMENT
Networks and Sensor Networks,” hosted by the Department of Computer Science at Jackson State University (JSU), MS, USA. The authors also acknowledge Dr. Loretta Moore, Dr. Marvin Watts, Mrs. Brenda Johnson and Ms. Ilin Dasari (all at JSU) for their services to this program conducted during Summer 2010.
VII. REFERENCES
[1] P. Sheu, H. Tsai, Y. Lee, and J. Cheng, “On Calculating Stable Connected Dominating Sets Based on Link Stability for Mobile Ad Hoc Networks”, Tamkang Journal of Science and Engineering, Vol. 12, No. 4, pp. 417-428, 2009.
[2] N. Meghanathan, “On the Stability of Paths, Steiner Trees and Connected Dominating Sets in Mobile Ad hoc Networks,” Ad hoc Networks, Vol. 6, No. 5, pp. 744-769, July 2008.
[3] Y.P. Chen and A.L. Liestman, “Approximating Minimum Size Weakly-Connected Dominating Sets for Clustering Mobile Ad Hoc Networks,” Proceedings of the ACM International Symposium on Mobile Ad hoc Networking and Computing, Lausanne, Switzerland, June 9-11, 2002.
[4] C. Bettstetter, H. Hartenstein and X. Perez-Costa, “Stochastic Properties of the Random-Way Point Mobility Model,” Wireless Networks, Vol. 10, No. 5, pp. 555-567, September 2004.
[5] T. H. Cormen, C. E. Leiserson, R. L. Rivest and C. Stein, “Introduction to Algorithms,” 2nd Edition, MIT Press, 2001.
[6] F. Kuhn, T. Moscibroda and R. Wattenhofer, “Unit Disk Graph Approximation,” Proceedings of the ACM DIALM-POMC Joint Workshop on the Foundations of Mobile Computing, pp. 17-23, Philadelphia, October 2004.
[7] K. M. Alzoubi, P.-J Wan and O. Frieder, “Distributed Heuristics for Connected Dominating Set in Wireless Ad Hoc Networks,” IEEE / KICS Journal on Communication Networks, Vol. 4, No. 1, pp. 22-29, 2002.
[8] S. Butenko, X. Cheng, D.-Z. Du and P. M. Paradlos,
“On the Construction of Virtual Backbone for Ad Hoc Wireless Networks,” Cooperative Control: Models, Applications and Algorithms, pp. 43-54, Kluwer Academic Publishers, 2002.
[9] S. Butenko, X. Cheng, C. Oliviera and P. M. Paradlos, “A New Heuristic for the Minimum Connected Dominating Set Problem on Ad Hoc Wireless Networks,” Recent Developments in Cooperative Control and Optimization, pp. 61-73, Kluwer Academic Publishers, 2004.
[10] Alzoubi, K. M., Wan, P. J. and Frieder, O., “New Distributed Algorithm for Connected Dominating Set in Wireless Ad Hoc Networks,” Proceedings of the 35th Hawaii International Conference on System Sciences, pp. 3849-3855, 2002.