Volume 4, No. 10, Sep-Oct 2013
International Journal of Advanced Research in Computer Science
RESEARCH PAPER
Available Online at www.ijarcs.info
ISSN No. 0976-5697
An Efficient Innovative Method to Decrease Routing Table Size in Packet Switched
Networks
Maassoumeh Javadi Baygi, Abdul Rahman B Ramli, Bahram Zaeri, Borhanuddin Mohd Ali
PhD Scholar University Putra ,Malaysia
Abstract:Appropriate routing for supporting the requirements of various high quality applications emerged in current communication networks is a challenging problem that can lead to improved routing algorithms. Taking into considerationthe highly distributed character of networks, numerousmulti-agent based algorithms, and particularly ant colony based algorithms, have been proposed in recent years. However, consideringthe need for decreasing overhead and increasing the scalability of these algorithms remains an elusive challenge. Our goal here is to reduce the overhead and the process complexity in nodes by decreasing the size of routing tables of network nodes in an innovative manner. More specifically, data routing tables which are established in theAntNet algorithm and keep the information of all destination nodes in network convert to tables that only keep the information of popular destinations of network. The resulting algorithm, the ‘‘D-T-SAntNet,’’ is then simulated via Omnet++ onUUNET network topology. The network performance is evaluated under various node-failure and nodeaddedconditions. Statistical analysis of results confirms that the new method can significantly reducethe average packet delivery time and rate of convergence to the optimal route when compared withstandard AntNet.
I. INTRODUCTION
Routing algorithms, as the heart of network systems, play a key role inthe exponentially growing communication worldwide. If professionallydesigned and configured, they can provide faster and more reliable data packet transfer, and improve several metrics of network performance such as end-to-end delay, end-to-end delay variance (jitter) and throughput.
Traditional routing algorithms such as distance-vector algorithms (RIP1) [1] and link-state algorithms (OSPF2
At each node i, ant selectsits next hop n to its destination according to routingtable of node i, then updates node i’s routing table. Itincreases the probability ofchoosing n as a next hop (increasing the pheromone) while selection probability of otherneighbors is decreased for destination d. In 1998Di Caro and Dorigo introduced a new algorithm ) [2] rely on global exchange of informationbetweennetwork nodes and thereforethey become unfeasiblewhen network size increases. However the exponentially growth of networksin size and the related scalability issues evidently show the necessityof new approach for routing.Communication networks are distributed platforms which provide good environment for multi mobile agent systems and distributed decisionmaking and accordingly in the last decade, many routing algorithms based on multiagents have been introduced.
Most of proposed multiagent-based algorithms take their inspiration from ants’behaviour in nature. Real ants are able to find shortest path between their nest and food source byfollowing pheromone trail of other ants. Schonderwoerdin[3] proposed and implemented an algorithm with ant-like agents for routing. In his algorithm, each source node s sendsan ant toward destination d at regular intervals, where d is selected in a random scheme.
based on ant behavior for packed switch networks known as AntNet [4]. In their system two types of ants introduced,forward and backward ants. Like the Schonderwoerd’s algorithm, network nodes send forward ants to different destinations periodically, however in this algorithm the forwardants do not update the nodes routing table that they visit. They only find a pathto destination d and simultaneously collect information of path. When a forward ant arrives at its destination, it generates a backward ant and dies. The backward ant then goes back in the same path asthe forward ant that created it and updates the routing tables for intermediate anddestination nodes.The AntNet has received significant attention by various researchers. Many researchers have tried to improve this method, such as Cuifangxinget.al.in [5] and B. Baran and R. Sosa in [6]. [6]improved AntNet by proposing an intelligent initialization of routing tables, an intelligent update after network resource failures, and a noisy decision making against undesirable networks ‘‘freezing’’ their routing probabilities in dynamic environment. Later, in 2002, Kassabalidis and El-Sharkawi showed that for large networks, good routing solutions can be achieved by combined use of network clustering, autonomous systems and ant colony [7]. Many other researchers have used the AntNet as a basis for new routing algorithms, particularly for QoS routing, routing for ad hoc and wireless networks [8,9,10,11,12,13,14,15].
Their routing tables are different from that in OSPF. In OSPF, there is only one outgoing link to each destination while in AntNet, for a specific destination, the node keeps a probability for each link. For example AntNet on the average has 162 entries in the routing table of the nodes in NTTNet topologyas compared to 57 for OSPF [2].Also as many of the above research have pointed out, while AntNet is strong in regards to distributedrouting, it still has a weakness in term of response to network changes/failures.The idea presented in this paper is limiting the routing table size in each node. In this way routers don’t need to keep unusable information and only keep necessary information which effect on decision and performance on network.In this approach a node only knows its neighbors and popular destinations. Popular destination will be determined dynamic and adaptively. By means of this method any changes in network and link/node failure could be reflected in decision making and routing tables. The total number of destinations is always n. n is a small number which is carefully chosen to allow higher performance and minimize data size
II. THE DECREASINGROUTING TABLE SIZE METHOD FOR ANTNET (D-R-T-S ANTNET)
Unlike the AntNet in which each node keeps global, in our approach a node only knows its neighbours, and some popular destinations. The total number of destinations is n which is sensibly selected due to size of network topology. In this approach each node should keep a traffic table to record the popular destinations where more data packets go them. Each node will update its tables regularly every T seconds by adding popular destinations, and removing destinations, which become unpopular over time (less packets go to them). Firstly the node sorts the record in traffic table to select n top popular destinations. Then the node checks destinations in the routing table to see whether it is a neighbour or among top n popular destinations. Destinations that satisfy the above condition will be kept intact; otherwise they will be removed. After checking the routing table, the node will fill the vacancies in the routing table and the local traffic statistics table with nodes appeared in the top popular list until the sizes of routing table is n. Once this is updated, all the data in the traffic table will be purged in order to accept new incoming data packets Suppose there are N nodes in the network, each node only keeps n destinations; the routing information kept in each node is of that in AntNet. Moreover this dynamic strategy can also solve the problems of topology changes, such as link and node failures, because destinations in routing tables are always changing
A. Proposed Algorithm:
a. At regular intervals, each node launches a forward ant to a destination. In our model, each node chooses destinations for ants among the current destinations in the node routing table.
b. As soon as a node receives an ant, it will forward theant if it is not the destination of the ant.
a) When a session requested at a source node s with a destination which is not in its routing table , this node starts a reactive path discovery phase, in which ant agents called path discovery ants,
denoted as , are multi cast (forks) and spread over the network in order to find a path to destination d of the session. s use high priority queues.
b) In each intermediate node if the destination d is included in the routing table of the node, node forwards according the routing information and probability values of the routing table and in other case is multicast.
c) Due to this initial (and further) multicasting, different instances of the same original ant will travel through the network. It will be referred to the set of ants which originated from the same initial ant as an “ant generation”. As mentioned the task of the ants of one generation is to find a path connecting s and d. Due to this multicasting, an ant generation can proliferate quickly over the network, with different ant instances following different paths to the destination. If an ant arrives in a node which was already visited by a different ant of the same generation, it is discarded.
d) The first ant which finds the path and reaches d, becomes a backward path request ant, denoted as . It returns to s and tracks the path it finds in its forward trip.
e) In the reverse trip which a backward ant goes back to its source,if the destination exists in the routing tables of the nodes that are on its path, the ant will update the routing tables according AntNet algorithm; otherwise if the encounters a node that does not have destination d in its routing table, it creates an entry for this destination and initiate the probability values of this destination node per each neighbour node.
f) When the first arrives at the source, source can send data to d.
g) If more s arrive d from other paths, they also change into backward path discovery ants, come back to s and act according section iv to update entries in the routing tables of intermediate nodes indicating a path between s and d.If a backward ant cannot be forwardedbecause of a link or a node failure, it willbe killed since its information is not valid anymore.
h) When a backward ant reachesthe source, it will be killed after it updates therouting table of the source. i) In overall when a node receives a datapacket,
which needs to be forwarded, the nodewill look for its destination in the routing table. Ifthis destination can be found, it will be forwardedbased on the AntNetalgorithm [4].
III. EXPERIMENTS AND ANALYSIS
All experiments were implemented with network simulator Omnet++ [18]
A. Simulation Environment:
In this section details about experimental setting and performance metrics are given.
a. Performance metrics: Packet lost rate, queue
together, they will provide a clear picture about the performance of QoS and will cover the intention to see whether data packets will be delivered quickly, or not
b. Network Topology: Our experiments were
conducted on UUNET (Figure 2). UUNET is North American Internet fiber-optic backbone. It is a network with 45 nodes and 173 bidirectional links. Link bandwidth is from 1.5Mbps to 2.5Gbps. The link propagation delays are between 1 to 5 ms (they are unified to 3 ms in the experiments here). UUNET is sensitive to routing algorithm’s performance: Once an ant or a data packet is forwarded towards a wrong way, it can easily get lost due to the topology constrains
In all experiments, the network will be given 1500 seconds to simulate normal work condition. After the network is constructed, each node will only know its neighbours. Data packets will be injected into each node from the very beginning Nodes will generate ants to random destinations every 300ms, and forward ants probabilistically. In some experiments, one or more important nodes will be removed from the network at 500s; at 1000s, the removed node(s) will come back to work so it will test network’s
adaptive ability under severe link/node failures. At 1200s, the data packet injection is stopped to allow all packets to be delivered. At 1500s, simulation stops. This setting is suitable for the experiments. We found the network becomes stable quickly after topology and traffic change
c. Data Traffic Pattern:Data IP packets size is set to 512 bytes, which is the same as many of pervious research such as [18]. At each interval, each node will send data packets to other nodes in the network where the destination addresses are selected randomly (no matter whether the destination exists or not). This is performed in order to simulate the condition with link failures (a node sends out a data packet to a destination which does not exist in the network) and worst case traffic load (burst traffic It should be noted that the selection of the interval to send data packets is important. When some nodes are removed from the network, the whole network becomes two small networks connected with one long link. During the experiments, each node sends data packets every 1.13 seconds, thus with such a traffic, the load on that long link is around 80% (assuming all data packets will be delivered with correct direction
[image:3.595.41.557.340.709.2]
Figure 1. The UUNET'S North American Internet Backbone (45 nodes)[19]
In the experiments, if a node discovers that a data packet went into a loop, the node will forward this data packet. This approach is used in order to give more chance to the network to deliver data packets. However, this setting
UUNET. This number will ensure the majority of data packets will reach their destinations, and kill other data packets wandering in the network All simulation scenario settings are summarized in Table 1.
Table 1 The scenario setting in experiment
Parameter Value
Number of nodes (ASs) Number of links Link type
Link propagation delay Link bandwidth Simulation time
[image:4.595.52.267.118.306.2] [image:4.595.64.532.522.763.2]45 173 bidirectional [1-5] msec [1.5 - 2.5] mbps 1500 sec Data packet size
Traffic (CBR) CoT
512 bytes 2 mbps
{EF, AF1, AF2, BE}
Pheromone decay factor ( ) 0.05
Pheromone delay weigh ( ) 0.3
Delay weight ( ) 0.05
Route expiration timer Queue length sampling
3.5 sec 0.02 sec Reverse refresh timer
Reverse route lifetime Shortest hop weight EXP-ANT launch interval (m)
1.5 sec 3.0 sec 1.0 300 msec
d. Ants’ Settings: Forward ants are generated at every 300ms. An ant’s life is set to 110 (selected empirically), which is two times the node number in UUNET. UUNET needs a larger ant life time than NSFNET due to its topology
e. Nodes’ Settings:Each node updates its routing table and local traffic statistics table every 10 seconds. Queue lengths are sampled every 0.02 second. The average of queue lengths is recorded every 0.5 second The sliding window for the local traffic statistics table is determined by
, hence the size of the sliding window is 100 Furthermore, nodes will keep all incoming packets if necessary. There are no upper limits for queue sizes. The Table2 presents list of the parameters we are used in our experiment.
Table 2 List of D-R-T-S AntNet experiment parameters
Parameter Value
0.3
0.05
0.05
0.7
0.3
0.78
* 0.05
to prevent the problem of "stickiness )
B. Experiment Results:
The following are experimental results conducted on D-R-T-S AntNetapproach discussed in Chapter 3. Firstly, we investigate the impact of routing table size. Several routing table sizes are chosen and compared to original AntNet in order to show the impact of the routing table size on network performance.
Six following cases in these experiments are considered
Case 1: Global (originalAntNet) Case 2: Size=30 (global setting) Case 3: Size=20 (global setting) Case 4: Size=10 (global setting) Case 5: Size=5 (global setting)
Case 6: Local (each node only knows existence of its neighbours)
a. Observation 1 without node failure:
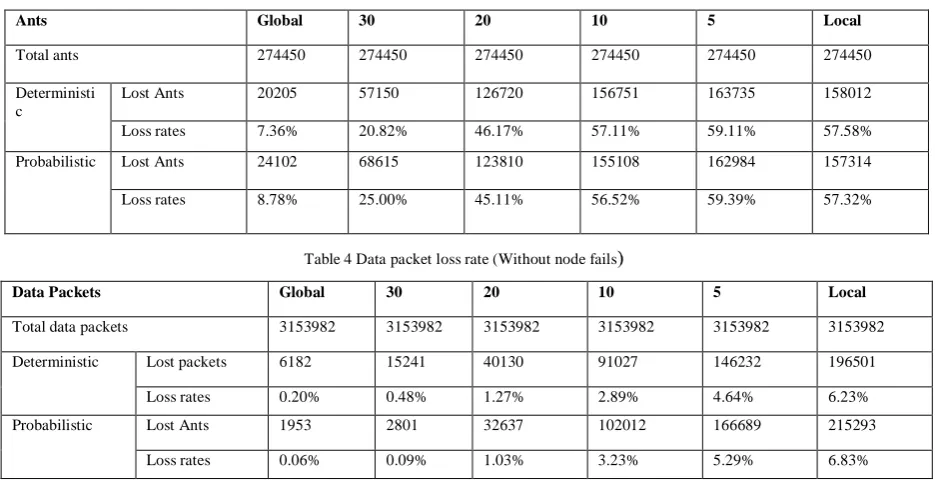
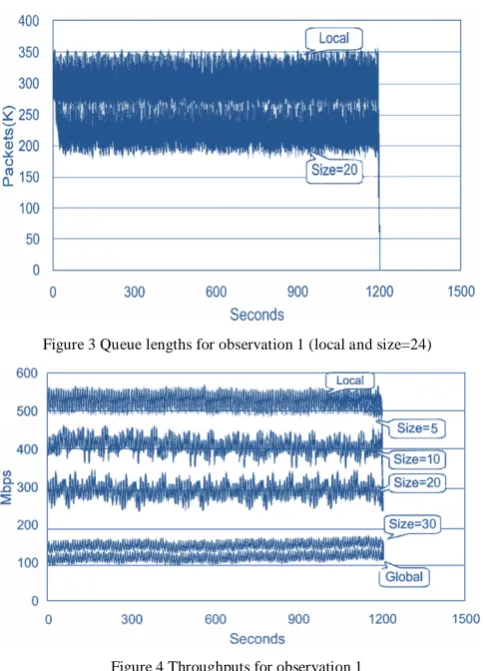
Table 3 and Table 4 show loss rates for ants and data packets. Figure 2 shows the queue length while for deterministic packet forwarding and for local as well as global settings, without node failure. Figure 3 illustrates the queue lengths for two data packet forwarding patterns; for probabilistic packet forwarding, size is 24 for local settings and without node failure.
Table 3 Ants' loss rate (Without node fails)
Ants Global 30 20 10 5 Local
Total ants 274450 274450 274450 274450 274450 274450
Deterministi c
Lost Ants 20205 57150 126720 156751 163735 158012
Loss rates 7.36% 20.82% 46.17% 57.11% 59.11% 57.58%
Probabilistic Lost Ants 24102 68615 123810 155108 162984 157314
Loss rates 8.78% 25.00% 45.11% 56.52% 59.39% 57.32%
Table 4 Data packet loss rate (Without node fails
Data Packets Global 30 20 10 5 Local
Total data packets 3153982 3153982 3153982 3153982 3153982 3153982
Deterministic Lost packets 6182 15241 40130 91027 146232 196501
Loss rates 0.20% 0.48% 1.27% 2.89% 4.64% 6.23%
Probabilistic Lost Ants 1953 2801 32637 102012 166689 215293
Figure.2 Queue lengths for observation 1 (local and global)
Figure 3 Queue lengths for observation 1 (local and size=24)
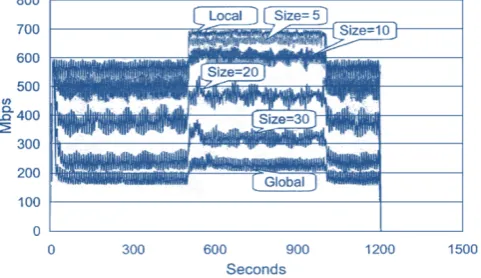
Figure 4 Throughputs for observation 1
Figure 4 shows throughputs for deterministic scenario without node failure.5 shows throughputs for the three patterns where packet forwarding is probabilistic, without node failure for size= 6, size=24 and Global.
Figure 5 Throughputs for observation 1 for the three patterns
The limited routing table sizes introduce high ant loss rates. The network will lose almost half of ants (46.17%) even if each node knows 4/9 of the topology. This loss rate is close to the local setting (each node only knows its neighbours .However, the high ant loss rates do not lead to high data packet loss rates. This is because:
a) No data packet will be discarded if a loop occurs. b) Ants act like athletes in four by one hundred meters
relay; a complete path can be discovered by ants’ teamwork
For the nodes that only know their neighbours, the loss rates are slightly lower than size=6, that is because usually a node will see more packets around itself thus ants’ destinations will be more likely to be nodes nearby. This could offset part of the loss rate due to the limited routing table size; however, the total loss rate will decrease Limited routing table sizes increase the queue lengths. While different data packet forwarding approaches have similar packet loss rates, they do introduce differences in queue sizes. Probabilistic forwarding results in stable queue sizes because it will distribute data packets according to queue sizes to different links Data packets are more likely to follow links with shorter queue sizes. Thus probabilistic forwarding will create more balanced queue sizes, whereas deterministic forwarding cannot distribute the load. Hence, sudden changes appear in the queue lengths for that approach
In D-R-T-S AntNet, a data packet may be forwarded many times if the nodes cannot find its destination. Thus in the throughput, such a data packet will be counted many times. This will introduce a throughput increase; on the other hand, if a data packet is delivered to its destination quickly; such a data packet will not contribute to throughput increase too much. Therefore, in the experiments, the smaller throughput is better For probabilistic data packet forwarding, the throughputs and queue lengths triple when the routing table sizes decrease from global to local, in which case routing table sizes is less than 1/9 of the global ones. For deterministic forwarding throughput of local information is four times of the global ones
b. Observation 2 UUNET’s central node fail:
[image:5.595.39.281.295.631.2]second, and it will be back to work at 1000 second. This node failure will lead to severe network conditions. The results are shown in Table 5, Table 6, and Figure 6, 7, 8, 9, 10 and 11.
In the table below, the number of lost ants does not include ants generated by central node between 500s and 100s; the number of lost data packets does not include data packets generated by central node, and data packets heading for central node. The reason for this is that these ants/data
[image:6.595.41.561.182.757.2]packets will never reach their destination due to central node's failure. If they are counted as lost ants/data packets, the data will not provide accurate information. In this case, 1667 ants (0.61% of total ants), and 47787 data packets (1.54% of total data packets) are not counted as lost packets.
Table 5 Ants' loss rate (Central node fails)
Ants Global 30 20 10 5 Local
Total ants 272783 272783 272783 272783 272783 272783
Deterministic Lost Ants 36221 71770 136403 160970 163735 168601
Loss rates 13.28% 26.31% 50.00% 59.01% 61.81% 59.58%
Probabilistic Lost Ants 38853 82810 132275 161181 168630 162111
Loss rates 14.24% 30.36% 48.49% 59.09% 61.82% 59.43%
Table 6 Data packet loss rate (Central node fails
Data Packets Global 30 20 10 5 Local
Total data packets 3106195 3106195 3106195 3106195 3106195 3106195
Deterministic Lost
packets
30765 40369 72240 119019 205185 298157
Loss Rates
0.99% 1.30% 2.33% 3.83% 6.61% 9.60%
Probabilistic Lost
Ants
26134 33121 78726 178078 263780 318203
Loss Rates
0.84% 1.07% 2.53% 5.73% 8.49% 10.24%
Results for packet lost rates and throughputs present similar results as case 1 (without node failure). However, there are interesting changes in queue lengths. Queue lengths for three cases (routing table size is 36, 24, 12 and 6) in deterministic data forwarding always go up between 500s and 1000s. This shows that the topology lacks ability to adjust to severe network failures.
The reason is that in deterministic data packet forwarding, a node will always forward data packets through the best" route, regardless of how many packets waiting in that outgoing queue Occurrences of these unsolved congestions are random so in the global setting and the local setting, the congestion did not happen
[image:6.595.37.282.574.698.2]Figure 6 Queue length (central node fails, deterministic scenario and size=global, 5 and 20)
Figure 7 Queue length (central node fails, deterministic scenario and size=local, 10 and 30)
Figure 9 Queue length (central node fails, probabilistic scenario and size=global, 5 and 20)
Figure 10 Throughput (central node fails, deterministic scenario)
Figure 11 Throughput (central node fails, probabilistic scenario)
There is a peak for queue lengths in probabilistic data packet forwarding. The larger routing table size is, the higher the peak is. The reason is that the node failure has more affect to the case with larger routing table size. On the other hand with a smaller routing table size, some nodes do not know the existence of central node,so its failure will not affect them a lot. After the peaks, the adaptive network studies the topology and adjusts the routing tables, so the queue sizes drop rapidly
c. Observation 3 two accessorial nodes fail:
The HOUSTON and TORONTO nodes are accessorial nodes at UUNET's infrastructure. These two nodes will fail at 500 second, and back to work at 1000 second. Table 7 and Table 8 give the results for this observation. The results are similar to those in the observation 2 (central node fails), except that this time the local routing information cannot adjust to the change in the topology either. The peaks for queue lengths in probabilistic forwarding are lower because these two nodes are not as important as central node. In this observation, 3333 ants (1.23% of total ants), and 95575 data packets (3.13%of total packets) are not counted in lost ants/data packets
Table 7 Ants' loss rate with two accessorial nodes fail
Ants Global 30 20 10 5 Local
Total ants 221117 221117 221117 221117 221117 221117
Deterministic Lost Ants 38551 74836 133399 159261 166710 161096
Loss rates 14.22% 27.60% 49.20% 58.74% 61.49% 59.42%
Probabilistic Lost Ants 42694 86485 132115 161307 168116 160656
[image:7.595.39.281.58.202.2]Loss rates 15.75% 31.90% 48.73% 59.50% 62.01% 59.26%
Table 8 Data packet loss rate with two accessorial nodes fail
Data Packets Global 30 20 10 5 Local
Total data packets 3058407 3058407 3058407 3058407 3058407 3058407
Deterministic Lost
packets
52821 33680 63401 105518 186214 282892
Loss Rates
1.73% 1.10% 2.07% 3.45% 6.09% 9.25%
Probabilistic Lost
Ants
48897 51619 90724 190820 271106 308517
d. Observation 4 two accessorial nodes and one
random node fail:
Table 9 and Table 10 show the results for Node 6, 19, 42 fail at 500 second, back to work at 1000 second. Node 6 and 19 are one of local nodes, and node 42 is selected from three local long links randomly The results are similar to Observation 2 (central node fails), but with more cases fail
[image:7.595.39.271.221.358.2] [image:7.595.67.531.498.683.2]Table 9 Ants' loss rate (two accessorial nodes and one random node fail)
Ants Global 30 20 10 5 Local
Total ants 269450 269450 269450 269450 269450 269450
Deterministic Lost Ants 51648 72362 133058 161274 166252 161384
Loss rates 19.17% 26.86% 49.38% 59.85% 61.70% 59.89%
Probabilistic Lost Ants 49445 91369 137936 162614 168535 160587
Loss rates 18.35% 33.91% 51.19% 60.35% 62.55% 59.60%
Table10 Data packet loss rate (two accessorial nodes and one random node fail)
Data Packets Global 30 20 10 5 Local
Total data packets 3010619 3010619 3010619 3010619 3010619 3010619
Deterministic Lost
packets
74045 27691 42619 98802 171646 280540
Loss Rates
2.46% 0.92% 1.42% 3.28% 5.70% 9.32%
Probabilistic Lost
Ants
71017 72896 118014 201994 269899 299344
Loss Rates
2.36% 2.42% 3.92% 6.71% 8.96% 9.94%
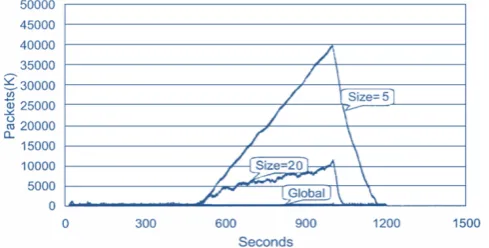
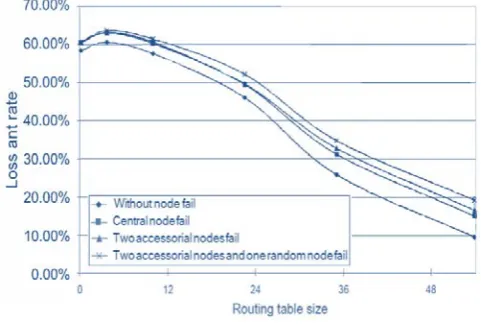
[image:8.595.38.279.397.560.2]The following figures (Figure 12 and Figure 13) show the proceeding of ants’ and data packets loss rates. It is very clear that both rates decrease when routing table sizes grow. When sizes of routing tables are between 20 (about 4/9 of topology) and global settings, ant loss rates drop rapidly, while there are no significant increase in data packet loss rates. On the other hand, when the sizes are below 24, the ratio of ant loss rates drop slowly, while data packet loss rates increase sharply
Figure 12. Proceeding of loss ant rates (Probabilistic)
Figure 13. Comparison of loss data packet rates (probabilistic)
IV. CONCLUSION
In this paper, a new method for decreasing the routing table size is introduced. In this new method routing table features, as well as its content, are evolved. It is upon this idea that the nodes in the network don’t need to have global information about entire the network and a priori knowledge regarding a number of nodes in the network is not necessary. Although in this method routing tables can be updated automatically and follow any changes in the network topology or node/link failure. The new approach is based on AntNet [4], which is an adaptive routing algorithm. Many properties of the AntNet are kept in this method but the routing tables and the local traffic statistics tables at first only know their neighbours and in continued automatically discover and add popular destinations from the point view of each node. In this way continuously the destinations update based on the data packets visiting and changes in network nodes. According results this approach can deliver more than 94% of the packets without the global information even under severe node / link failures
V. REFRENCES
[1].
Atkinson, M. Fanto, The Internet Society (January 2007)
[2]. R. Guerin, D. Williams, T. Przygienda, S. Kamat, and A. Orda,“QoS Routing mechanisms and OSPF extensions,”IEEE Globecom 1997, vol.3, 1997, pp.1903-1908.
[3]. Schoonderwoerd, R., et al., Ant-based Load Balancing in Telecommunications Networks. Adaptive Behavior, 1997. 5(2): p. 169–207.
[4]. G. Di Caro and M. Dorigo, “AntNet: Distributed Stigmergetic Control for Communications Networks,”Journal of Artificial Intelligence Research 9,1998,pp. 317-365.
[6]. B. Barán and R. Sosa. “AntNet: Routing Algorithm for Data Networks based on Mobile Agents”. Argentine Symposium on Artificial Intelligence ASAI-2000,Tandil – Argentina
[7]. Kassabalidis, El-Sharkawi ,”Swarm Intelligence for Routing in Communication Networks”,2002,IEEE Globecom
[8]. P. Lalbakhsh et al., “Improving shared awareness and QoS factors in AntNet algorithm using fuzzy reinforcement and traffic sensing “, Future Computer and Communication, 2009, ICFCC 2009, M.N. pp.: 47-51
[9]. G. Di Caro et al.,“Ant-SELA: Ant-agents and stochasticautomata learn adaptive routing tables for QoS routing in ATM networks”, In Proc. of 2nd International Workshop on Ant Colony Optimization, 2000.
[10]. Z. Subing, L. Zemin, “A QoS routing algorithm based on ant algorithm”, ICC 2001 – IEEE International Conference on Communications, vol.5, no.1,2001, pp.1587-1591.
[11]. K. Oida, M. Sekido., “ARS: an efficient agent-based routing system for QoS guarantees,” Computer Communications (Elsevier), vol. 23, 2000, pp. 1437-1447.
[12]. S. Tadrus and L. Bai., “QColony: a multi-pheromone best-fit QoS routing algorithm as an alternative to shortest-path routing algorithms,” International Journal of Computational
Intelligence and Applications, vol. 5, no.2, 2005, pp.141– 167.
[13]. L. Carrillo, J. L. Marzo, L. F`abrega, “Ant colony behaviour as routing mechanism to provide quality of service,” Proc. ANTS, vol. 3172 of Lecture Notes in Computer Science, 2004, pp. 418–419, Berlin, Springer.
[14]. H. Lee et al., “A nature-inspired QoS routing algorithm for next generation networks”, Autonomic and Autonomous Systems, 2008, ICAS 2008, pp.: 226 – 232
[15]. M. Yuxing et al., “QoS routing algorithm based on parameter adaptive ant colony optimization”, International Conference on Computer Science & Service System (CSSS), 2012, Eng. Inst. of Corps of Eng., PLA Univ. of Sci. &Technol., Nanjing, China, pp.: 1204 – 1207
[16]. S. Dhillon, P. Van Mieghem, “Performance analysis of the AntNet algorithm Computer Networks”, Elsevier,Computer Networks, vol.51, 2007, pp. 2104-2125.
[17]. The OMNET++ Network Simulator,
http://www.omnetpp.org /
[18]. Liu, X.J., Application of Improved Ant Colony Algorithm in QoS Routing Optimization. Advanced Materials Research, 2010. 108: p. 353-358.
![Figure 1. The UUNET'S North American Internet Backbone (45 nodes)[19]](https://thumb-us.123doks.com/thumbv2/123dok_us/698192.1077566/3.595.41.557.340.709/figure-uunet-s-north-american-internet-backbone-nodes.webp)