International Journal of Advanced Research in Computer Science
RESEARCH PAPER
Available Online at www.ijarcs.info
NS-2 based simulation environment for performance evaluation of UMTS Architecture
Waseem Abbas
Computer Engineering Department University of Engineering and Technology
Taxila, Pakistan
Muhammad Asim Malik
Computer Engineering Department University of Engineering and Technology
Taxila, Pakistan [email protected]
Nasim Abbas
Electronic Engineering Department Muhammad Ali Jinnah University
Islamabad, Pakistan [email protected]
Abstract: The paper presents our work in the performance evaluation of enhanced UMTS and proposes new simulator that supports wireless 3G networks. Existing network simulators are implemented using time based link level simulations and integrate system level and link level simulators. Our proposed network simulator assimilates time based link level simulations by extending network simulator into event based simulator. Extended simulator can be used to explore and investigate the network metrics (delay, loss, jitter, and throughput) associated with enhanced UMTS to evaluate the existing and future protocols and architectures and also evaluates the performance of radio interface as well as core network of UMTS. Simulation based results are presented in which the fairness of traffic scheduling algorithms for UMTS real time traffic that passes through UMTS core network and external IP bone network, based on DiffServ. A scenario modelling a demanding traffic mix for mobile users through different environments is evaluated and results are presented.
Keywords: EURANE; HSDPA; NS-2; Scheduling; UMTS;
I. INTRODUCTION
In modern communication systems an increasing number of services are provided by using wireless technologies. The Universal Mobile Telecommunications System (UMTS) is one of the Third Generation (3G) cellular systems whose key purpose is to offer a general infrastructure which can deliver both existing and upcoming services. 3G is standardized by third generation Partnership Projects [1]. Wireless mobile networks are developed to transmit multimedia real-time traffic including VOIP, video conferencing, data and other applications. Since the requirements for new wireless services and their data rates increase High Speed Downlink Packet Access (HSDPA), in order to improve the support of high data rate packet services. HSDPA is considered 3.5G offering data rates up to 15Mbps. An Enhanced UMTS network an evolution step of UMTS network is an All-IP based network which supports amendments and adaptations to the UMTS network [2]. Since the new services require more resources, these upgrades intend to assure the requirement of increase in capacity, flexibility in the UMTS IP domain and provide auxiliary integrated services that cannot be expected from the standard UMTS architecture. Because of that, Enhanced UMTS build an efficient end-to-end packet-based transmission [3]. The main objective of enhanced UMTS simulations is to raise a network based on the present topology design and class based traffic distribution with diverse requirements of QoS.
Coverage, capacity and QoS are the Key parameters which system level simulations focus to achieve the target arising
the issue of whether the planned network be able to support the envisioned of traffic mix, as a result parameters affecting QoS will be investigated. Our aim was to assess the network performances when different traffic scheduling algorithms such as WRR, WFQ, PQ and LLQ are implemented on UMTS core network and on other IP backbone networks. A simulation environment is proposed in this paper that enables the performance evaluation of Radio interface, resource management and UMTS core networks. The necessitate of proposed simulator comes up from diverse traits of enhance UMTS such as the users accessing different types of application servers in addition to the need of user mobility, hand over and Radio Resource Management mechanisms.
Existing models of network simulators includes Monte-Carlo, time-based and event based simulators. Simulator presented in [4] and MoDySim [5] are event driven. Mont-Carlo simulator is discussed in [6]. Another simulator OPNET simulation environment [7] has event driven kernel but node stacks are ATM based. The event based NS-2 simulator [8] take a network oriented perspective rather than a system level perspective.
II. SYSTEM LEVEL SIMULATOR
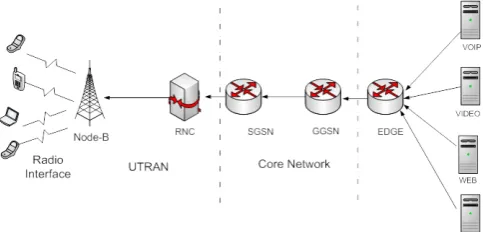
In this paper we proposed UMTS system level simulator which is the modification of an open source network simulator version 2 (NS-2). UMTS extension was first developed by SEACORN project [2]. The model of the simulator was designed according to the needs and specifications required for simulating UMTS architecture as depicted in Figure 1. The need of designing a universal simulator for existing technologies and also which supports the upcoming UMTS services is attained by the severance of service technologies and the access, so the complete architecture is divided into subsystems based on various parameters like protocol architecture and nature of traffic.
Figure1. UMTS architecture for packet switched operations
The architecture of UMTS includes the User Equipment (UE), Radio Access Network (RAN), and Core Network (CN). RAN consists of UMTS Terrestrial Radio Access Network (UTRAN) which includes the Base Stations and Radio Network Controller (RNC). The CN comprises of serving GPRS Support Node (SGSN) manages all packet switched data and its delivery in its service area and Gateway GPRS Support Node (GGSN) manages the internetworking with IP network and GPRS network.
UE corresponds with base station through radio interface in wireless stations. Base station controls the radio interface for the UE having same cell as base station. Radio Network controller key role is to administer the air interface resources which are shared with the users connected to base station which is being covered by it. It also synchronizes and manages the processes like admission control handoffs, buffer packets for UE, and SGSN to allow the communication between SGSN and UE. Radio network controller covers multiple base stations at a time to control many calls simultaneously. RAN is connected to base stations via IP based routers [9].
In extensions of ns-2, all UMTS aware entities and the models including radio propagation, RRM mechanism, mobility and different traffic models for different scenarios are included. For external IP backbone network default ns-2 nodes are used.
[image:2.595.37.279.228.344.2]The proposed simulator was designed in separate modules where each module differs in its functionalities and responsible in its service area. The modules are classified in three groups comprising Mobile environment, Control mechanisms and performance evaluation. The structure of the modules is depicted in Figure 2
Figure 2. System Level Simulator Modules
The main advantage of using this approach is the implementation and modification of existing and future networking protocols necessary for QoS Provisioning. In packet switched networks bottleneck can be anywhere hence QoS cannot be guaranteed. Our proposed simulator allows capturing both the dynamic end-to-end behavior of whole network and the air interface.
III. SIMULATION RESULTS AND DISCUSSIONS
In this section we presented simulation results obtained by using the network simulator with EURANE extensions. Our main target while evaluating the simulation scenario was to investigate the effects of core network on data transmission and to achieve a better bottleneck link bandwidth utilization while keeping the packet loss and end-to-end delay within their boundary. So the key network parameters for investigating end-to-end QoS provisioning are end-to-end delay, packet loss, and bottleneck link utilization.
A. Simulation Scenario
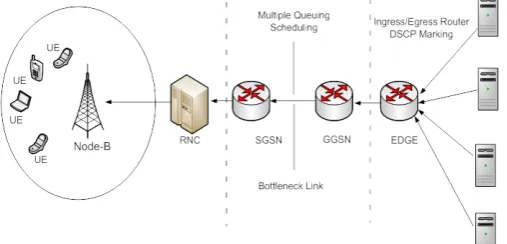
Figure 3. Implemented End to End QoS provisioning algorithm
The GGSN out-link differentiates each IP data flow according its DSCP (the GGSN does not change the DSCP assigned from the external network) and transmits them with the queuing and scheduling schemes. The SGSN receives these packets and forwards them to the RNC, at which the IP packets are converted into RLC SDUs. The radio link settings are shown in Table II. The DCH works in Acknowledge Mode, and the maximum RLC layer retransmission time is unlimited. This setting is due to the EURANE limitations.
Hence all the erroneous RLC PDUs will be recovered, and the end-to-end SDU loss will only be caused by IP packet dropping in the bottleneck link queue, which is Early Drop for real-time traffic or queue overflow for all other traffic. On the other hand the unlimited RLC PDU retransmission will result in much more uncertainty for the end-to-end delay, and make the delay control more difficult.
Based on the same network topology settings and on the same traffic model, we investigated four end-to-end QoS provisioning methods:
1) Strict Best Effort: no AC and all types of services were simply equally handled.
2) Peak-Rate based AC. UMTS AC is based on the EB, where the AC admits coming sessions by comparing the available bandwidth with the EB of the service type of the coming session. In this scenario the EB is estimated as peak rate, i.e., the on-time application layer sending rate in our traffic model.
3) Mean-based AC. Here the EB is estimated as the mean sending rate of each type of service.
[image:3.595.28.282.63.185.2]4) Proposed EB based AC with user differentiation. An enhanced EB estimation of each service type is combined with parameter optimized QoS mechanisms. Both the value of the EB and the parameters settings for buffering and scheduling are optimized according to simulation results from the previous three scenarios. The initial buffering and scheduling settings are shown in Table III; it should be mentioned that the queue for Best Effort(BE) is Drop Tail, and the queue size in BE is approximately the same as the total queue size of the four queues in Scenario 2 and 3. The EB setting for each scenario (except BE) is presented in Table IV.
Table I. Traffic parameters in simulation Applications VOIP Video
Streaming
HTTP FTP
Transport Layer
Protocol
UDP UDP TCP TCP
IP Packet Size (byte) 120 160 240 480
Traffic source model Exp
on/off
Exp on/off Pareto
on/off
Pareto
on/off
Holding time
distribution
Exp Exp
Log-normal
Pareto
Avg sending rate (kbps) 30 128 60 120
Bottleneck BW (Kbps) 1000
Traffic load (total avg
load/BW)(%)
74.32
B. Performance Evaluation
1) Best Effort:As depicted in Table V, only 49.0% of the VoIP packets meet the delay boundary ondition in the BE scenario. This result shows that the best effort strategy causes an unacceptable QoS level for conversational service in a high traffic load. On the other hand, it also gained a high bottleneck link utilization rate (63.7% in a 74% traffic load), by sacrificing the QoS performance.
II. Simulation Parameters Wired Part Link Bandwidth
(Mbps)
Link Delay (ms)
Server-Edge router 10 20
Edge router-GGSN 10 2
GGSN-SGSN 1 2
SGSN-RNC 10 2
RNC-Node B 10 5
Wireless Simulated cell
Number
1
Active UE number 20
DCH bandwidth 384Kbps
Fast Power Control Ideal Radio link RLC PDU
error
Uniform, mean=0.01
[image:3.595.320.557.388.586.2]Mobility model no
Table III. QoS Provisioning Settings
Application VOIP VIDEO HTTP FTP
Queue Type Drop Tail Drop Tail RED RED
Queue Size (Pkt) 8 30 120 200
RED Threshold N/A N/A 0.01 0.01
Early dropping Probability 52 45 2 1
the traffic load. Hence it is a too conservative strategy for our optimization target.
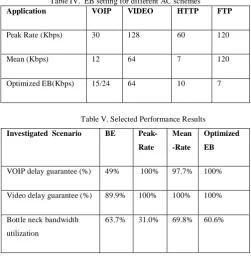
Table IV. EB setting for different AC schemes
Application VOIP VIDEO HTTP FTP
Peak Rate (Kbps) 30 128 60 120
Mean (Kbps) 12 64 7 120
Optimized EB(Kbps) 15/24 64 10 7
Table V. Selected Performance Results
Investigated Scenario BE
Peak-Rate
Mean
-Rate
Optimized
EB
VOIP delay guarantee (%) 49% 100% 97.7% 100%
Video delay guarantee (%) 89.9% 100% 100% 100%
Bottle neck bandwidth
utilization
63.7% 31.0% 69.8% 60.6%
3) Mean-based AC: This is an aggressive AC that achieves a bandwidth utilization of 69.8%, which means it allows for a high multiplexing gain. However, in order to stay inside the delay boundary, short queues have to be used for the conversational class, and the packet loss ratio becomes unacceptable. Further the packet loss for the interactive class is also very high (not shown in Table 6). So this QoS strategy needs to be further optimized by reserving more resources for the conversational class and interactive class.
4) Optimized EB-based AC with parameter optimized QoS mechanisms: In this simulation scenario we proposed a set of EB estimations, and combined them with optimized buffering and scheduling settings. For the EB estimation for the exponential traffic model in this paper, we use is give in [11] as.
EB = m + α
(
σ/√
N) (1)
Where
α =
√
(-
2ln (ε)
–
ln(2π))
(2)
and
σ
is standard deviation and N is the number of conversational sessions during the simulation run. This results in EB = 15kbps. But simulations show that this is still a too aggressive value which cannot match the QoS requirements for the conversational class in high traffic load (74%) scenarios. Furthermore, EBs for interactive and background services are also modified according to the first role of Table The full set of performance for this scenario is shown in Table VII, the results show that our enhanced QoS algorithm and settings satisfy the QoS for all the service types and also achieve good bandwidth utilization (60.6%). To compare more clearly the performance of all the simulated scenarios, we define a utilization function to be the ratio of the number of packets that satisfy the QoSrequirements divided by the total number of sent packets of this service type. That way, both lost packets and out-of-delay-boundary packets will be excluded from the utility function.
U= No of Packets with in QoS boundary
Application
(3) Total No of Sent Packets
[image:4.595.318.557.221.333.2]The utility for VoIP and Video traffic is plotted in Figure 4, where the Best Effort case is depicted as EB = 0, and the results at EB = 15kbps and EB = 24kbps are generated with the enhanced queue settings in Table VI.
Table VI. QoS provisioning Settings
VOIP VIDEO HTTP FTP
EB setting (Kbps) 24 64 10 7
Queue Type Drop Tail Drop Tail RED RED
Queue Size (Pkt) 8 30 120 200
RED Threshold N/A N/A 0.01 0.01
Early dropping
Probability
50 40 5 1
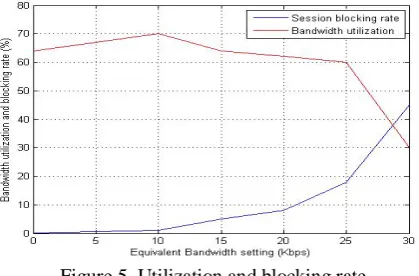
While the results at EB = Peak-Rate and EB = Mean-rate are based on the initial queue settings in utilization of each scenario is plotted in Figure 5.
Table VII. Simulation result of proposed EB-AC with QoS algorithm
GGSN-SGSN VOIP VIDEO HTTP FTP
Packet Loss 0 2.3x10 -4 1.5x10⁻⁴ 0
End-to-End Delay
guarantee
100% 100% N/A N/A
[image:4.595.323.537.550.681.2]While the results at EB = Peak-Rate and EB = Mean-rate are based on the initial queue settings in utilization of each scenario is plotted in Figure 7.
Figure 4. Utility Performance
balance between QoS (or utility) and bandwidth utilization. To conclude, the Best Effort strategy failed to supply E2E QoS with an unacceptable large latency for conversational service.
Figure 5. Utilization and blocking rate
Then the designed QoS provisioning mechanisms and ACs with different EB estimation methods are compared: Peak-Rate-based estimation certainly supplied the required QoS profile at the price of low bandwidth utilization; at the other end, mean-based estimation achieved high bandwidth utilization but also failed in guaranteeing QoS for conversational services; finally, the optimized EB setting along with the QoS provisioning schemes balanced the conflict between QoS and bandwidth utilization, and achieved good performance for all KPIs.
IV. CONCLUSION
This paper focuses on investigating a simulation environment for the evaluation of new and existing protocols and architectures of UMTS. The modifications were done in open source network simulator using event based techniques and these modifications can simulate and evaluate all nodes of UMTS. The proposed simulator evaluates the enhanced algorithm combines DiffServ-UMTS QoS mapping, EB based access control and scheduling algorithms with optimized parameters and show the following properties. The simulator simulates the algorithms which show sufficient performance with respect to E2E delay and packet loss ratio. The algorithm achieves good bottleneck link utilization within all the QoS limitations. The mechanisms are very simple to implement and do not
require additional signaling. Future analysis will include other traffic models for upcoming new applications in UMTS networks and simulation environment will handle multi-cell topologies.
V. ACKNOWLEDGEMENT
The authors would like to thank all the reviewers for their constructive remarks and suggestions and wish to express their gratitude to the other members of the consortium for fruitful discussions.
VI. REFRENCES
.
[1] 3rd Generation Partnership Project ,
http://www.3gpp.org.
[2] Simulation of Enhanced UMTS Access and Core Networks (SEACORN). <http://seacorn.ptinovacao.pt> [3] 3rd Generation Partnership Project: Technical
Specification Group Radio Access Networks; RF System Scenarios (Release 7).
[4] M.J.Fleuren, H. Stuben, G.F.Zegwaard. MoDySim, a parallel dynamical UMTS simulator. Parallel Computing 2003 (ParCo2003).
[5] Hoppe R., Buddendick H., Wolfle G., Landstorfer F. M. “Dynamic simulator for studying WCDMA radio network performance”, 53rd Vehicular Technology Conference (VTC) 2001 - Rhodos, May 2001.
[6] Dehghan, D.Lister, R. Owen, and P. Jones, “W-CDMA Capacity and Planning Issues,” IEE Electronics & Communication Journal, June 2000, pp101-118
[7] OPNET: <www.opnet.com>
[8] NS2 website,
[9] Muratore F. Ed. “UMTS: Mobile Communications for the Future,” Wiley, 2001.
[10] RFC 2475, “An Architecture for Differentiated services”, IETF, 1998.
[11] P.Joos, W. Verbiest, ”A statisticalbandwidth allocation and usage monitoring algorithm for ATM networks”,in Proc. IEEE ICC1989, Vol.1, pp. 415-422