1092
Development of Model for Estimating Saturation Flow
Considering Width, Acceleration and Queue Length for
Selected Intersections of Ahmedabad City
Bhavsar Priyesh
1, Dr. N. G. Raval
2Transportation Engineering1, 2, Government Engineering College, Modasa1,2 Email:[email protected] 1,[email protected] 2
Abstract- To assess the capacity of signalized intersection saturation flow is most important parameter. Saturation flow determines the effectiveness of traffic control systems at signalized intersection. Hence, accurate calculation of saturation flow at signalized intersection is most important. The conventional models used for determining saturation flow are based on homogenous traffic condition and lane behavior is strictly followed. Another important parameter are acceleration and queue length of vehicles at intersection. Queue length at intersection is also used to identify effectiveness of traffic control equipment. Acceleration and deceleration of vehicles at signalized intersection depends upon vehicle characteristics, driver‟s reaction time and pavement condition. In developing countries, vehicles are of different static and dynamic characteristics, proportion of share varies, moving on common carriageway width. Conventional method does not include the variation of speed of different categories vehicles during passing through intersection. Saturation flows calculated by any conventional models like Webster‟s method underestimates. It is necessary to determine the effect of width, acceleration and queue length on saturation flow for heterogeneous flow condition. The present study is aimed to determine saturation flow as per field heterogeneous condition of various intersection of Ahmedabad city. The Model is developed for estimating saturation flow considering variables like width, queue length and acceleration of vehicles. The developed models are validated using statistical tools.
Keywords- Saturation flow, Heterogeneous traffic, Queue length, Acceleration.
1. INTRODUCTION
The urban road of India carries heterogeneous traffic comprising two wheeler, auto rickshaw, car, buses, trucks, light motor vehicles, heavy motor vehicles, bicycles, hand cart, cycle rickshaw etc. From 2010 to 2016, the average no. of registered vehicles has recorded an annual growth rate of 10.3 %. The problems occurred due to increasing in number of registered vehicles are like congestion, delay, pollution, fatigue etc, which leads to complexity for traffic management. Saturation flow is the hourly rate at which queued vehicles can traverse an intersection approach under existing conditions if the green signal is available always and no lost times are experienced. Highway Capacity Manual (HCM) describes an equation to compute the adjusted saturation flow rate per lane for the subject lane group, where a base saturation flow rate of 1900 Veh/hour/lane is considered along with 10 adjustment factors. As traffic signal shows green, there is first a very short gap as the first driver reacts to the signal change. The rate of vehicles crossing the stop line increases as vehicles accelerate to the speed determined by the cars they are following. Vehicles soon reach a state, where they are following one another at a constant headway. This headway is known as saturation headway.
To determine the saturation flow rate, following equation is used:
(1)
Where:
s = saturation flow rate in PCU/hr hs = headway in meter.
Various factors influencing saturation flow are width, traffic composition, no. of lane, percentage heavy vehicles in the corresponding movement group, approach grade for the corresponding movement group, parked vehicles, bus blockage, area type, lane utilization right turners, left turners, pedestrians and bicycle etc.
2. OBJECTIVES
The main objectives of present study are as follows, 1) To determine saturation flow for the selected
stretches of urban area.
2) To develop a model of saturation flow and various parameters such as width, acceleration and queue length.
3) To validate the developed model using statistical tests.
3. LITERATURE REVIEW
1093 wheelers and heavy vehicles. (B. G. Savitha et. al.,
2017) Studied various signalized intersections of Bangalore city and developed model for base saturation flow by considering width as a parameter. Actual saturation flow rates were calculated by multiplying base saturation flow equation with factor of gradient and factor of turning radius. (Neelam Jain Gupta et. al., 2016) developed dynamic PCU value for heterogeneous traffic condition by using area and speed ratio. Saturation flow were determined by using this dynamic PCU values and compared with saturation flow determined by using IRC SP 41. (N. G. Raval et. al., 2012) developed models for saturation flow by considering width and traffic composition as parameters. (Padmakumar Radhakrishnan et. al., 2010) optimized PCU values by minimizing the difference between an ideal saturation flow curve and the observed flow curve. This PCU values were used in model of saturation flow which considered traffic composition as parameter. (C. J. Bester et. al., 2007)
carried out a study on saturation flow and developed a model for saturation flow by considering parameters like grade, number of lane and speed limits.
4. DATA COLLECTION AND ANALYSIS
4.1Study area
Following are the intersections selected for present study.
1. Lal Bunglow intersection 2. Shastrinagar intersection 3. Paldi intersection
4. Sardar Patel Statue intersection
The intersections are selected based on observed high congestion, large amount of vehicles throughout the day and variation in traffic composition. All intersections are signalized intersections having four arms meeting right angle to each other. The selected intersections are having flat gradient, not affected by the influence of any bus stops, pedestrians, parked vehicles. In the selected intersections, traffic data are collected from the various approaches of intersections and analysis are shown below.
1. Lal Bunglow Approach 2. AEC Bridge Approach 3. Ghatlodia Approach 4. Vasna Approach
5. Dr. Amin Junction Approach 6. Stadium Cross Road Approach 7. Ankur Approach
4.2Methodology adopted for data collection
Data are collected during morning and evening peak hours. For data collection videography technique is used. About 350 sets of data are collected for development of model. Digital camera is so positioned that it can capture a view of approximately 30 m behind stop line and stop line of destination approach. The measurement of queue length is done manually. Last vehicle, which is passed during the green period, is considered for measuring queue length. The position
of last vehicle at particular leg in green time is marked with black board chalk. The distance between stop line and marking made with chalk is measured with odometer, which shows distance digitally in meters.
Different categories vehicle‟s acceleration is measured by dividing the distance between stop lines into segment of 10 m. Time of travel of each vehicles are recorded with accuracy of 0.01 sec.
4.3Data Collection
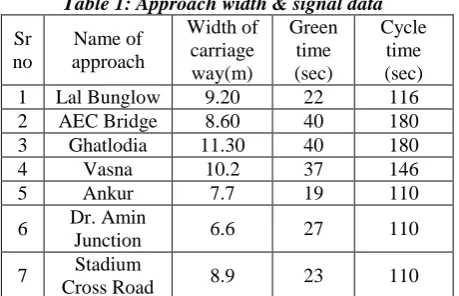
It includes measurement of width of study approach no. of lane, width of footpath and width of the median, type of signal, cycle time, green time, red time, amber time for selected approach. Existing signal timing data and geometry of road are measured manually. The inventory data and green period is presented in table 1.
4.4Traffic composition data
[image:2.595.308.538.346.494.2] [image:2.595.308.527.527.763.2]For present study, the collected data are extracted from video and observed traffic is classified into various categories i.e. two wheelers, three wheelers, cars, light commercial vehicle, heavy commercial vehicle, Bus, Bicycle. Vehicles are counted for morning and evening peak hours and composition are presented in table 2.
Table 1: Approach width & signal data
Sr no Name of approach Width of carriage way(m) Green time (sec) Cycle time (sec) 1 Lal Bunglow 9.20 22 116 2 AEC Bridge 8.60 40 180 3 Ghatlodia 11.30 40 180
4 Vasna 10.2 37 146
5 Ankur 7.7 19 110
6 Dr. Amin
Junction 6.6 27 110 7 Stadium
Cross Road 8.9 23 110
Data is collected for approach width ranging from 6.6 m to 11.30 m.
Table 2: Vehicle composition at various approaches
Sr no Na me o f a pp ro a ch TW ( %) Aut o ( %) Ca r (%) L CV ( %) C y cle ( %) B us ( %) H CV ( %)
1 Lal
Bunglow 61 14 22 1 2 0 0
2 AEC
Bridge 68 7 21 2 1 1 0
3 Ghatlodia 70 10 17 2 1 0 0
1094 5 Ankur 68 14 16 0 1 0 0
6 Dr. Amin
Junction 58 10 31 1 0 0 0
7
Stadium Cross Road
63 19 18 0 0 0 0
From table 2, it is concluded that majority of traffic is of 2 wheeler, Auto and cars. The composition of buses, light commercial vehicles and bicycles are very less. Share of two wheeler varies from 50 % to 70%. Composition of auto rickshaw is between 7% to 35%. Proportion of car is about 10% to 21%.
4.5 Queue length
[image:3.595.73.292.86.219.2]Queue length is one of the most important performance measures for signalized intersections, which are also used to signal optimization. Queue length of waiting vehicles at intersections is an important parameter for determining the quality of the traffic control. Actual queue of vehicles which are passing into green period is measured with odometer. Observed queue length data for different cycles are represented in scatter diagram. The present paper includes queue length data for only Ghatlodia approach in the form of scatter diagram.
[image:3.595.307.529.99.384.2]Figure 1: Observed queue length during green period at Ghatlodia (Morning)
Figure 2: Observed queue length during green period at Ghatlodia (Evening)
4.6Approach Speed and Acceleration Data
Acceleration of vehicles is important for various applications like length of yellow light at intersection, determination of sight distances at intersection. At signalized intersections, vehicles decelerate, stop, queue up (during red signal) and then accelerate during green and amber signal. Acceleration characteristics depend on number of factors such as, individual vehicle type, driver behaviour, number and type of vehicles at intersection. Time to cover 10 m segment for each vehicles are recorded and speed to determined. Speed of vehicles and time is represented in graphical manner. The slope of speed versus time diagram will give acceleration of vehicles.
20 30 40 50 60 70 80 90 100
1 6 11 16 21 26 31
Q
ueue
leng
th (
m
)
Cycle
Morning Queue length
20
30
40
50
60
70
80
90
1
6
11 16 21 26 31
Queue
leng
th
(
m)
Cycle
1095
Figure 3: Speed profile of various vehicles in different cycle
Acceleration of vehicles in different cycles is analyzed form the graph of speed versus time. Cumulative acceleration in different segment in different cycles are graphically represented.
Figure 4: Acceleration profiles of various vehicles in different cycle
4.7Saturation Flow Data
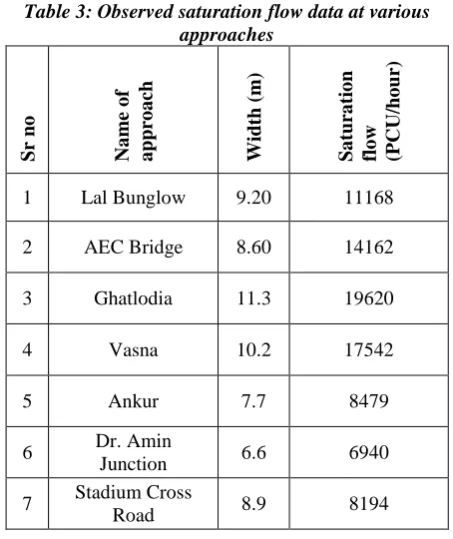
[image:4.595.306.533.89.359.2]To measure saturation flow, movement wise classified traffic volume has been calculated for the all approaches of an intersection. The observation point is normally stop line. Start of the green is noted down. Saturation flow ends when the rear axle of the last vehicle from a queue crosses the stop line. During this time period, different types of vehicles count is done for each movement (left turn, through and right turn separately). Using PCU factors, the effect of heterogeneity are eliminated. For present study, PCU suggested by IRC 106-1990 for various categories of vehicles are used.
Table 3: Observed saturation flow data at various approaches
Sr
no
Na
me
o
f
a
pp
ro
a
ch
Width (
m)
Sa
tura
tio
n
flo
w
(P
CU/ho
ur)
1 Lal Bunglow 9.20 11168
2 AEC Bridge 8.60 14162
3 Ghatlodia 11.3 19620
4 Vasna 10.2 17542
5 Ankur 7.7 8479
6 Dr. Amin
Junction 6.6 6940
7 Stadium Cross
Road 8.9 8194
5. DEVELOPMENT OF MODEL
Models are developed for estimation of saturation flow using regression technique considering various variables. These developed models are validated with t test and R2 value.
Model 1:
This model is developed considering proportion of various categories of vehicles in terms of PCU and width of road.
S = 398 W + 62 TW + 74 Auto + 66 Car – 8 LCV +30 Bicycle + 58.83 Bus - 42 HCV (2)
Where,
S = saturation flow (PCU/hour) W = width of road in meter
TW = proportion of two wheeler in PCU Auto = proportion of auto in PCU Car = proportion of Car in PCU Bus = proportion of Bus in PCU
LCV = proportion of Light Commercial Vehicle in PCU
HCV = proportion of Heavy Carrier Vehicle in PCU Bicycle= proportion of Bicycle in PCU
The developed model is having R2 value and t test is performed at significance level of 5%. The summary of statistical validation is presented in table 4.
0 1 2 3 4 5 6 7 8 9 10 11
0 2 4 6 8 10 12 14 16 18 20
Sp
ee
d
(m
/s
)
Time (s)
0.0 1.0 2.0 3.0 4.0 5.0 6.0
0 20 40 60
Cum
ula
tiv
e
Acc
eler
a
tio
n (
m
/s
2)
[image:4.595.72.294.351.528.2]1096
Table 4: Statistical validation of Model 1 Variables t observed
Width 34.12
TW 18.53
Auto 24.77
Car 8.23
LCV -0.35
Bicycle -0.29
Bus 2.03
HCV -0.77
t critical 1.97
R2 value 0.992
In Model-1, the absolute value of „t‟ is significantly high for width, proportion of two wheeler, Auto, Car, and Bus in terms of PCU compare to „t‟ critical. It can be concluded that this variables coefficient can be useful in estimating the saturation flow.
Model 2:
The model is developed by considering width as independent variable and saturation flow as dependent variable.
S = 972 W (3)
Where,
S = saturation flow (PCU/hour) W = width of road in meter
[image:5.595.303.528.573.666.2]The developed model is having R2 value and t test is performed at significance level of 5%. The summary of statistical validation is presented in table 5.
Table 5: Statistical validation of Model 2
Variables t observed
Width 60.31
t critical 1.96
R2 value 0.912
In Model-2, the observed value of „t‟ is significantly high for width of road than „t‟ critical. It can be concluded that coefficient of width of road can be useful in estimating the saturation flow.
Model 3:
The model is developed by considering width and queue length as independent variable and saturation flow as dependent variable.
S = 504 W + 92 Q (4)
Where,
S = saturation flow (PCU/hour) W = width of road in meter Q = queue length in meter
The developed model is having R2 value and t test is performed at significance level of 5%. The summary of statistical validation is presented in table 6.
Table 6: Statistical validation of Model 3
Variables t observed
Width 19.07
Queue length 19.55
t critical 1.967
R2 value 0.958
In Model-3, the observed value of „t‟ is significantly high for width of road and queue length of vehicles passed during green time than „t‟ critical. It can be concluded that this variable‟s coefficient can be useful in estimating the saturation flow.
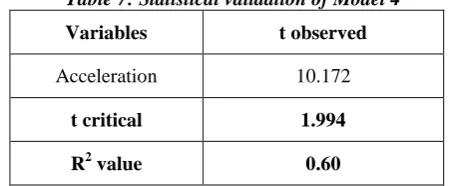
Model 4:
The model is developed by considering saturation flow as independent variable and acceleration as dependent variable.
S = 2.23 Acc (5)
Where,
S = saturation flow for straight moving vehicles (PCU/sec)
Acc = Acceleration of straight moving vehicles (m/s2)
The developed model is having R2 value and t test is performed at significance level of 5%. The summary of statistical validation is presented in table 7.
Table 7: Statistical validation of Model 4
Variables t observed
Acceleration 10.172
t critical 1.994
R2 value 0.60
In Model-4, the observed value of „t‟ is significantly high acceleration than „t‟ critical. It can be concluded that coefficient of acceleration can be useful in estimating the saturation flow.
6 CONCLUSION
1097 presence of countdown timer, the start-up lost time
is reduced to 2 sec, which increases discharge flow rate in the initial time of green period.
b. Model 1 is developed by using proportion of various category of vehicles in terms of PCU as variable, which gives satisfactory result with field observation and validated with t test.
c. Model 2 considers width of road to develop model for saturation flow. The R square value and t test results indicates good relationship between these two variables.
d. Queue length is parameter used to determine degree of saturation and adequacy for traffic control system. Hence, this parameter is needed to consider and identify effect on saturation flow. e. Model 3 considers width of road and queue length
of vehicles passed during green period to develop model for saturation flow. This model gives more satisfactory result than Model 2.
f. Pavement condition at any intersection affects accelerating and decelerating characteristics of vehicles. Saturation flow is also affected by pavement condition.
g. Model 4 considers acceleration of vehicles during different various cycles as independent variable and saturation flow as dependent variable. This model is validated with t test.
h. Webster equation for determining saturation flow underestimates the value of saturation flow. Hence this equation needs to be modified.
i. In present study, saturation flow is estimated by PCU values given in IRC SP 106-1994. But static PCU values given by IND-HCM can be used for saturation flow estimation.
j. The model can be used in any part of country, where similar traffic vehicles characteristic is found.
k. The present work is carried out at seven approaches of Ahmedabad city. Similar analysis should be carried out for large number of intersection approaches.
REFERENCES
[1] Arpita saha et. al. (2017). “Saturation Flow Estimation at Signalized Intersections under Mixed Traffic Conditions”. Urban Transport XXIII.
[2] B. G. Savitha et. al. (2017). “Geometric Factors Influencing Saturation Flow Rate at Signalized Intersections under Heterogeneous Traffic Conditions”. Journal of Transportation Technologies, 83-94.
[3] C. J. Bester et. al. (2007). “Saturation Flow Rates”. Proceedings of the 26th Southern African Transport Conference, 560-568.
[4] N. G. Raval et. al. (2012). “Modification of Webster‟s Delay Formula Using Modified Saturation Flow Model for Non-Lane Based Heterogeneous Traffic Conditions”. Journal of Indian Road Congress, 41-48.
[5] Neelam Jain Gupta et. al. (2016). “Development of saturation flow model at signalized intersection for heterogeneous traffic”. World Conference on Transport Research, 1662-1671.
[6] Padmakumar Radhakrishnan et. al. (2010). “Calibration of micro simulation models for non-lane based heterogeneous traffic at signalized intersections”. Journal of urban planning and development, ASCE.