An Economic Analysis of Rural
Land Use Policies in Ontario
Executive summary / iii Introduction / 1
1. Empirical evidence on agricultural land trends in Ontario, 1951–2013 / 4 2. Provincial land use policy analysis framework / 25
3. Identification and documentation of major land use policy changes in Ontario since 1980 / 36
4. Analysis of major changes in rural land use policy in Ontario since 1980 / 53 Conclusion: Alternative approaches to rural land use policy / 60
Appendix / 63 References / 64
About the authors / 70 Acknowledgments / 70 Publishing information / 71 Supporting the Fraser Institute / 72 Purpose, funding, & independence / 72 About the Fraser Institute / 73
Executive summary
There is a widely held public perception that agricultural land is being con-verted to non-agricultural uses at a high—even an alarming—rate in Ontario. This perception has had an appreciable effect on public policy. Frankena and Scheffman (1980) conducted the most recent comprehensive economic analy-sis of rural land use policies in Ontario. Their primary findings were that the rate at which agricultural land had been converted to non-agricultural uses was not high for the period 1951 to 1976, and that conversion of agricultural land to urban uses represented a small share of overall conversions at a prov-incial scale. They also concluded that rural land use policy and planning in Ontario had been conducted with insufficient regard for the contributions that economic analysis could make to policy development.
The purpose of this report is to revisit Frankena and Scheffman’s findings to determine if they still hold for the years that have elapsed since 1980. Our analysis proceeds along two lines. First, we examine the empirical evidence on the amount of agricultural land in Ontario and how that has changed over time. Our empirical work covers the 1951 to 1976 time period studied by Frankena and Scheffman, but we also examine data up to 2013, the most recent year for which data are available. We consider several data sets that provide empirical estimates of the amount of agricultural land in Ontario. We conclude that Frankena and Scheffman’s major findings still hold. The area of cropland in Ontario, which we argue is the most meaningful meas-ure of the amount of agricultural land in the province, has been essentially constant, with perhaps a slight increase in area, since 1951. Farmland area, which is defined on a different basis from cropland area, has been decreas-ing, but we explain that this is a less meaningful measure of the amount of agricultural land in the province.
After reviewing the empirical evidence and research on the supply of agricultural land in Ontario, we develop a framework for evidence-based policy making with respect to land use. This framework draws on the theories of market and non-market failure, as well as the lessons learned from the eco-nomic calculation debate on central planning. We also differentiate between the theories of absolute and comparative advantage as competing perspec-tives on resource use. Evidence-based policy making has been endorsed
by both the Government of Canada and the Government of Ontario. This approach to policy making originated in education policy and public health policy. In more general contexts, a conceptual framework is needed to inte-grate some of the more normative elements in policy decision making that are perhaps less prominent in the original contexts of this approach. Our view is that the economic theory of government policy can make an important con-tribution to the application of evidence-based policy making in new areas.
We proceed to identify and describe the major changes in land use policy that have occurred in Ontario since 1980. In particular, we examine the series of four Provincial Policy Statements, the Niagara Escarpment Act and Plan, the Oak Ridges Moraine Act and Plan, and the Greenbelt Act and Plan. We then apply our theoretical framework to these major changes in policy with a view to addressing the following questions:
1 Is the rationale for policy consistent with at least one category of market
failure? What evidence of the existence and severity of market failure was used to develop the rationale for policy?
2 Was there evidence of consideration of potential non-market failure problems arising from the policy measures in question?
3 Was implementation analysis applied before policy implementation?
4 Was there evidence that consideration was given the lessons learned from
the economic calculation debate?
5 Was there acknowledgement of the theory of comparative advantage? 6 Are there any general trends toward increased provincial control over local
land use decisions?
Sadly, we found that, generally speaking, Frankena and Scheffman’s conclusion that land use policy could benefit from increased regard for critical economic concepts still holds. Policy documents make frequent and general references to concepts like efficiency, prosperity, optimality, and even cost-benefit analysis of alternative policy measures. Unfortunately, there seems to have been little in the way of application or follow-through on these concepts. Lessons learned from the economic calculation debate on the viability of cen-tral planning, in our view, have application in land use planning. The theory of comparative advantage, as opposed to the theory of absolute advantage, deserves more serious consideration in land use policy. In addition, the wide-spread reliance on land use designation, and the abandonment of the prior provincial policy approach of purchase of environmentally sensitive lands financed through tax revenue, are inconsistent with the economic theory of public goods and have created important equity concerns for rural land owners, who have ended up bearing a disproportionate share of the burden of providing benefits shared among the citizens of the province.
development rights, compensation for land owners adversely affected by a development proposal, restrictive covenants and deed restrictions, propri-etary community models, land trusts, and a club goods model.
five per cent of it is suitable for food production. And once farmland is gone, it’s never coming back.
Larry Davis, Ontario Federation of Agriculture, Ontario Farmer, November 25, 2014
On a clear day, over one-third of Canada’s best agricultural land can be seen from the top of Toronto’s CN Tower.
Statistics Canada, Canadian Agriculture at a Glance, 1999
Despite its obvious importance, Ontario is losing its agricultural land base at a rapid rate as many farms go out of production every year. Urban sprawl and rural non-farm development are contrib-uting to the annual loss of thousands of acres of farmland.
Ontario Farmland Trust, Why Save Farmland, 2014
18% of Ontario’s Class 1 farmland has been lost to urban expansion.
Ministry of Municipal Affairs and Housing, Sustainability: The Intersection of Land Use Planning and Food, 2010
The answer to the central question must depend on how much of our cropland, present and potential, is currently being transformed for urban uses. I suggest that the likely amount is only about one-third of the amount claimed by NALS in its national campaign to arouse concern about the issue, a rate probably no greater but rather less than in the past, and certainly not three times the rate of the recent past as claimed by NALS. This true rate is not likely to worry those knowledgeable about agriculture.
Julian Simon, Are We Losing Our Farmland? 1982
The amount of agricultural land in the world is continuing to rise, just as in the past centuries, despite popular belief that it is fixed in quantity.
Julian Simon, Worldwide, Land for Agriculture Is Increasing, 1980
The data on land use conversion indicate clearly that in the aggregate the rate of conversion of land to built-up urban use is low in relation to the rate of productivity increase in agriculture, the stock of agricultural land, and the decrease in the acreage of census farms.
Mark Frankena and David Scheffman, Economic Analysis of Provincial Land Policies in Ontario, 1980
In recent CAST and NALS studies which conclude that market forces will not adequately protect agricultural land, there is little recognition of the information and knowledge problems that lie at the heart of all questions concerning the relative merits of the market versus central direction in resource allocation.
Introduction
Concerns about the amount of agricultural land and the conversion of agricul-tural land to non-agriculagricul-tural uses in Ontario are not new. A popular percep-tion is that agricultural land, and particularly good agricultural land, is being converted to non-agricultural uses at an alarming rate. Motivated, at least in part, by this perception, the Government of Ontario has undertaken a series of policy measures to protect agricultural land. Adequacy of the supply of agricultural land may seem like a topic of primary concern to farmers, but unintended consequences of policies put in place to slow the rate at which agricultural land is converted to non-agricultural uses have broad implica-tions outside of the agricultural economy. The supply of wildlife habitat, the supply of affordable housing, and the development of transportation and other infrastructure can all be affected by these policy measures.
The governments of Canada and Ontario have both committed them-selves to a process known as evidence-based policy making, which originated in education and public health policy.1 This approach is offered by its
advo-cates as an alternative to policy making based either on anecdotal evidence or on ideology, without regard to empirical analysis. Application outside of the contexts in which it was developed is a work in progress. Generally, there is not much controversy about whether elementary school students should achieve better scores on standardized math tests, or whether smoking cessa-tion programs are a good way to enhance public health. In other policy con-texts, however, more difficult normative questions may arise.
The economic theory of government policy offers a template for the application of evidence-based policy making in these more challenging con-texts. The first element of this theory is the diagnosis of a market failure. The existence of at least one of the categories of market failure is a necessary con-dition for there to be an economic justification for policy action by govern-ment. Market failures lead to inefficient use of resources. Policy action, in principle, can mediate these efficiency losses, if certain conditions are met. 1. See Rajsic and Fox (2015) for an overview of the literature on evidence-based policy
making and for a discussion of the application of this approach in agricultural and nat-ural resource policy.
Two elements are involved in the diagnosis of market failure. First, a theor-etical case is needed to argue that a given problem under consideration for policy action could indeed arise as a consequence of at least one of the cat-egories of market failure. The second element involves compiling empirical evidence, beyond anecdotes, that the market failure hypothesized in the first element is ongoing and significant.
Diagnosis of market failure, however, is not a sufficient condition for an economic justification for government policy. Economists have developed a theory of non-market or policy failure that complements the theory of market failure. Non-market failure arises when government policies them-selves cause inefficiency. It is possible that the inefficiencies generated by the policy cure end up being more serious than the inefficiencies created by the market failure disease. The second stage, therefore, in the economic theory of government policy, is to examine the existing problem being considered for policy action to determine if it is symptomatic of one of the categories of non-market failure. If it is, then the remedy might be to reform or rescind that original policy. Non-market failure analysis should also be conducted on an ex ante basis for any policy action being considered.
The third element in the economic theory of policy is called implemen-tation analysis, following Wolf (1979). This process involves the assessments of market and non-market failures, the latter of which may involve retrospect-ive as well as forward looking application, to evaluate the overall benefits and costs, or advantages and disadvantages, of policy action. Ideally, implementa-tion analysis should be done before policy is adopted, however retrospective analysis can also be useful. The economic theory of policy development is a helpful supplement to the evidence-based policy making model. It provides a framework to address important normative questions. It also provides guid-ance on the type and nature of empirical evidence required to get beyond public perceptions, anecdotes, and ideology.
In this report, we apply the economic theory of government policy and the model of evidence-based policy making to the question of what policy action, if any, is indicated in response to the widely-held public per-ception that Ontario is losing farmland at an alarming rate. We do this by first reviewing and analysing the existing data on the question: “How much agri-cultural land is there in Ontario and how has that changed over time?” Then, we apply the economic theory of government policy to changes in Ontario’s rural land use policies between 1980 and the present time.
Frankena and Scheffman (1980) conducted the most recent compre-hensive and rigorous economic analysis of rural land use policies in Ontario. Their general findings, for the time period from 1951 to 1976, were that agri-cultural land had not been disappearing at an alarming rate in Ontario and that urban use represented only a small contribution to the overall conversion
rural land use policy had been generally conducted without reference to the constructive role that economic analysis could play in policy development and evaluation. One of our purposes is to assess the extent to which Frankena and Scheffman’s (1980) findings apply to more recent decades.
1. Empirical evidence on agricultural land
trends in Ontario, 1951
–
2013
This section addresses the question of how much agricultural land exists in Ontario and how this has changed over the time period from 1951 to 2013. Our particular focus is on the period since 1980, the year in which Frankena and Scheffman published their review of rural land use policies in Ontario. We com-pare trends during the post-1980 period to their analysis of the pre-1980 per-iod. In addition to marking the 35th anniversary of the publication of Frankena
and Scheffman’s study, 2015 also marks the 10th anniversary of the creation of
Ontario’s Greenbelt, which is undergoing a legislatively required review. Frankena and Scheffman (1980) relied primarily on data from the Census of Agriculture between 1951 and 1976, the latter being the most recent year for which Census data were available in 1980. Based on data from the Census of Agriculture (1951–2011), we estimate that farmland area in Ontario decreased by 39.33 percent over the period from 1951 to 2011, while crop-land area actually increased by 3.29 percent.2 Frankena and Scheffman (1980) focused on farmland area and concluded that it decreased by 29.4 percent from 1951 to 1976. This implies a much slower rate of decrease in farmland area in the post-1980 period. And cropland area, which, in our view is a more meaningful measure related to food production, has increased.
In addition to Census data, we consider data from Agricultural Statistics for Ontario (1951–1996), and, more recently, Statistics (2003–2012) from the Ontario Ministry of Agriculture, Food, and Rural Affairs (OMAFRA), the
Annual Crop Inventory from Agriculture and Agri-Food Canada (2011–2013),
Agricultural Resources Inventory (1983) and the Soil Survey Complex (2009) from OMAFRA, production and yield data from Statistics (2014) collected by Statistics Canada and distributed by OMAFRA, and Tile Drainage Area
(2012) collected by the Ministry of Natural Resources.
2. The definition and meaning of the terms farmland and cropland are discussed later in this report. At this point, it is important to note that cropland area is a subcategory of
farm-The additional data sources that we consider used different methods of data collection, cover different time periods, are collected at different fre-quencies, and, to some extent, have different spatial coverage. But, collectively, they offer a richer perspective on the question of how much agricultural land exists in Ontario and how that has been changing over time. The Census data are available at five-year intervals. The Agricultural Statistics for Ontario data are published annually. The Crop Inventory data are also annual.
Later, we will also discuss three studies, Human Activity and the Environment—Agriculture in Canada (Gagnon et al., 2014), Urban Consumption of Agricultural Land (Hoffmann, 2001), and The Loss of Dependable Agricultural Land in Canada (Hofmann et al., 2005), which offer important insights on trends in what is sometimes referred to as prime agricultural land.
Boundaries of the study area
We are primarily concerned with the amount of agricultural land in Ontario, but we also report some estimates at the regional level. Some of our data sets report estimates for all of Ontario. Others report estimates for primarily the southern portions of the province. Three data sets, the Census of Agriculture (1951–2011, census years), Agricultural Statistics for Ontario, and the pro-duction and yield data are reported for the whole province. For some of the other data sets, estimates are only available regionally, focusing mainly on the southern regions of the province. In addition, land areas in the fruits and vege-tables category from the Agricultural Statistics for Ontario (1951–2013) or the production and yield data (2014) are reported only at the provincial level.
For data sets which offer only partial coverage of the province, we focus on southern Ontario, western Ontario, central Ontario, and eastern Ontario, where most of the agricultural land and agricultural production are located. The Agricultural Resource Inventory (1982) covers the 36 counties which have
the most significant share of agricultural production. In some comparisons, we select data from provincial data sets for only these 36 counties.
The names and boundaries of some counties and regional municipal-ities have changed during the period from 1951 to 2014. These municipal boundary changes do not affect the overall provincial totals, but some adjust-ments in county and regional level estimates were necessary to accommodate changes in municipal boundaries.3 The definition of regions in the province
is based on the Census Agricultural Regions, which include the Southern
Region, the Western Region, the Central Region, and the Eastern Region, which were defined by Statistics Canada in 1981.4
Definition of agricultural land
The seemingly simple term agricultural land turns out to be complicated. In the Greenbelt Plan (2005), “agricultural land” is not defined, but “agricultural uses” is defined based on the Provincial Policy Statement (2005):
Agricultural uses: Means the growing of crops, including nursery and horticultural crops; raising of livestock; raising of other animals for food, fur or fibre, including poultry and fish; aquaculture; apiaries; agro-forestry; maple syrup production; and associated on-farm build-ings and structures, including accommodation for full-time farm la-bour when the size and nature of the operation requires additional employment. (Ontario, 2005c)
The definition of agricultural land varies across the five data sets we examine, and also in the three studies that we review. Farmland is the broadest term defined in the Census of Agriculture (1951–2011). Cropland is a narrower category than farmland. Cropland includes all land reported for field crops5
and hay, vegetables, sod, nursery products, fruits, berries and nuts. Farmland includes cropland and adds pasture, summer fallow, woodlands, wetlands, and other land (i.e., farm buildings, barnyards, etc.). Agricultural land may include, therefore, area which would not be what we think most people have in mind when they think about agricultural land. Woodland and wetlands may provide benefits in the form of habitat and amenities, but are less central to the agricultural economy. The definition of agricultural uses in the Provincial Policy Statement (2005) is broader than the definition of cropland defined in the Census of Agriculture, because it also includes farm buildings; how-ever, it is narrower than the definition of farmland as defined in the Census of Agriculture, which defines farmland to include woodlands and wetlands. 4. The Northern Ontario region also contains some agricultural land; some of our data sets provide estimates of this area, but others do not. The Northern Region is large in total land area but the amount of agricultural land in this region is small relative to the more southerly portions of the province. For our calculations, the lists of counties included in the Western and Central Regions were modified to accommodate changes in municipal boundaries between 1951 and 2014. Details are provided in Wang (2015). Sometimes changes in municipal boundaries involved the transfer of agricultural land from one municipality to another. At the regional level, the empirical impacts are small, and, for
In the Agricultural Statistics for Ontario dataset, field crops include major row crops, such as corn, soybeans, winter wheat, and other grains and oilseeds. In other data sets, definitions of farmland and cropland are sometimes not specified. To make datasets comparable, we calculate area of farmland and cropland for each dataset using categories similar to the ones defined in the Census of Agriculture.
The definition chosen for estimating the availability of agricultural land ideally depends on the nature of the intended analysis. If the concern is food security or the viability of the agricultural economy, then cropland would be more relevant. If the concern is the total rural land area providing habitat, greenspace, or amenity benefits, then farmland area might be the more rel-evant measure. However, there are important limitations to using farmland as a measure of agricultural land area, which we will discuss shortly. Also, in the final section of our report, we suggest alternative approaches to land use policy that might be considered as means of securing habitat and amenity benefits.
Agricultural Census data (1951
–
2011)
For the Census of Agriculture6 data, Statistics Canada sends questionnaires to farmers whose operations meet the definition of a Census Farm. The def-inition of a Census farm has changed several times since 1951. A summary of these changing definitions is provided in the Appendix and in Wang (2015).
We used census data at the county, regional, and provincial levels. Regional data are available from the original census data sets beginning in 1981, when the Census of Agricultural Regions (CAR) were created. Before 1981, we calculated regional estimates by summing individual Census Division level data. Only regional and provincial level data are presented in the tables. Table 1 and table 2 report estimates of farmland area and cropland area for the whole province and for regions respectively from 1951 to 2011.
Table 1 shows that farmland area has been decreasing since 1951, at both the provincial and regional levels. At the provincial level, farmland area was 8,449,857 hectares in 1951, and it was 6,261,705 hectares in 1976—the most recent year available to Frankena and Scheffman (1980). In 2011, farmland area was 5,126,653 hectares.
Table 2 reports that cropland area increased provincially from 3,498,629 hectares in 1951 to 3,506,943 hectares in 1976, and further increased to 3,613,821 hectares in 2011. Trends vary regionally. From 1951 to 2011, the southern and western regions experienced increases in cropland area, while the eastern, central, and northern regions experienced decreases in cropland 6. The Census of Agriculture data are collected every five years. The most recent agri-cultural census was conducted in 2011.
area. Southern Ontario experienced the most significant increase, from 1,024,108 hectares to 1,337,269 hectares from 1951 to 2011.
Table 1
Estimates of provincial and regional farmland area from the Census of Agriculture, 1951–2011 (hectares) Census year 1951 1956 1961 1966 1971 1976 1981 1986 1991 1996 2001 2006 2011 Ontario 8,449,857 8,045,006 7,518,454 7,213,944 6,460,019 6,261,705 6,039,236 5,646,582 5,451,379 5,616,860 5,466,233 5,386,453 5,126,653 Southern Region 1,848,743 1,819,790 1,775,765 1,745,968 1,687,403 1,661,905 1,651,064 1,590,702 1,579,424 1,659,580 1,612,725 1,592,343 1,549,113 Eastern Region 1,842,812 1,736,181 1,618,464 1,544,252 1,331,680 1,244,664 1,153,950 1,050,780 1,003,620 1,012,037 1,002,046 973,568 913,832 Central Region 1,566,070 1,443,498 1,345,395 1,253,475 1,075,951 1,003,221 963,044 877,337 829,276 833,445 798,487 778,936 717,760 Western Region 2,216,117 2,166,709 2,082,623 2,012,762 1,854,502 1,820,547 1,778,684 1,684,896 1,627,375 1,696,918 1,643,423 1,627,992 1,571,145 Northern Region 976,115 878,829 696,208 657,487 510,483 531,367 492,495 442,866 411,684 414,880 409,552 413,613 374,803 Notes: Estimated farmland area for Ontario includes all regions. Farmland includes cropland, tame or seeded pasture, natural pasture, woodlands, wetlands, Christmas tree area, and all other land, as filled out in the census questionnaires. The definition of a census farm determines if land is included in farmland area. A piece of land would not be included if it was not part of a census farm. See the Appendix for a discussion of the changing definitions of census farms.
Source: Statistics Canada, 1951–2011.
Table 2
Estimates of provincial and regional cropland area from the Census of Agriculture, 1951–2011 (hectares) Census year 1951 1956 1961 1966 1971 1976 1981 1986 1991 1996 2001 2006 2011 Ontario 3,498,629 3,326,276 3,232,369 3,382,474 3,179,166 3,506,943 3,632,727 3,457,966 3,411,667 3,544,927 3,656,705 3,660,941 3,613,821 Southern Region 1,024,180 1,052,302 1,057,178 1,138,821 1,169,663 1,261,458 1,329,747 1,285,131 1,286,432 1,343,964 1,359,008 1,353,636 1,337,269 Eastern Region 644,359 577,009 553,894 569,707 481,756 520,763 517,873 488,165 478,756 496,638 542,478 546,492 539,969 Central Region 543,758 485,457 459,901 468,122 409,635 441,958 457,079 417,638 408,840 413,627 429,801 428,484 411,327 Western Region 1,060,258 996,467 979,221 1,029,063 980,026 1,119,217 1,165,156 1,119,924 1,101,931 1,148,852 1,172,573 1,178,474 1,179,240 Northern Region 226,074 215,047 182,178 176,758 138,083 163,546 162,871 147,107 135,708 141,847 152,844 153,856 146,016 Notes: Estimated cropland for Ontario includes all regions. Cropland is defined to include area under field crops and hay, vegetables, sod, nursery products, fruits, berries and nuts.
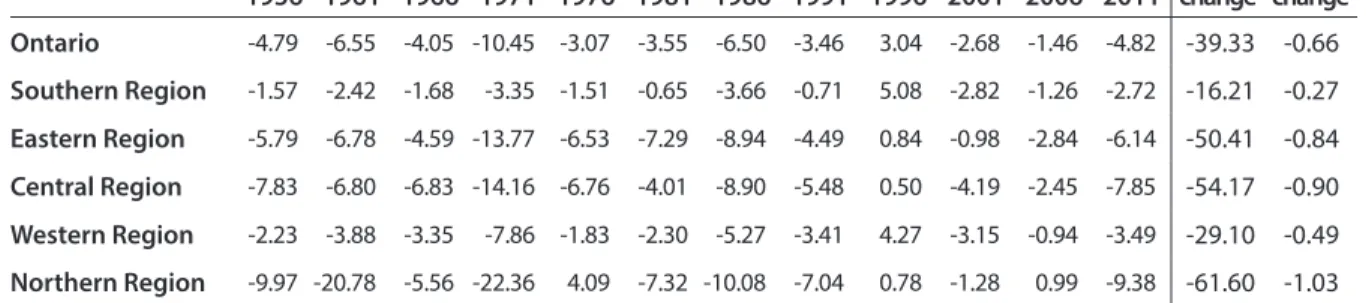
Table 3 reports percentage changes of the total farmland area. Ontario experienced a 39 percent decrease in farmland at the provincial level from 1951 to 2011. Frankena and Scheffman (1980) reported a 29 percent decrease in farmland at the provincial level from 1951 to 1976, so the rate of decrease in farmland area was much lower from 1976 to 2011 than it was from 1951 to 1976. The cropland area tables, however, show a different pattern. Table 4
reports the percentage changes in cropland area, with a 3.29 percent increase from 1951 to 2011, or an average annual increase of 0.05 percent per year.
Table 3
Estimates of provincial and regional percentage change of farmland area, 1951–2011
1956 1961 1966 1971 1976 1981 1986 1991 1996 2001 2006 2011 Total % change Average annual % change Ontario -4.79 -6.55 -4.05 -10.45 -3.07 -3.55 -6.50 -3.46 3.04 -2.68 -1.46 -4.82 -39.33 -0.66 Southern Region -1.57 -2.42 -1.68 -3.35 -1.51 -0.65 -3.66 -0.71 5.08 -2.82 -1.26 -2.72 -16.21 -0.27 Eastern Region -5.79 -6.78 -4.59 -13.77 -6.53 -7.29 -8.94 -4.49 0.84 -0.98 -2.84 -6.14 -50.41 -0.84 Central Region -7.83 -6.80 -6.83 -14.16 -6.76 -4.01 -8.90 -5.48 0.50 -4.19 -2.45 -7.85 -54.17 -0.90 Western Region -2.23 -3.88 -3.35 -7.86 -1.83 -2.30 -5.27 -3.41 4.27 -3.15 -0.94 -3.49 -29.10 -0.49 Northern Region -9.97 -20.78 -5.56 -22.36 4.09 -7.32 -10.08 -7.04 0.78 -1.28 0.99 -9.38 -61.60 -1.03 Notes: Farmland area is defined in the notes to table 1. The changing definitions of census farms are discussed in the Appendix. Calculations for Ontario include all regions.
Annual percentage change is calculated by dividing the total change from 1951 to 2011 by 60 years. Source: Statistics Canada, 1951–011.
Table 4
Estimates of provincial and regional percentage change of cropland area, 1951–2011
1956 1961 1966 1971 1976 1981 1986 1991 1996 2001 2006 2011 Total % change Average annual % change Ontario -4.93 -2.82 4.64 -6.01 10.31 3.59 -4.81 -1.34 3.91 3.15 0.12 -1.29 3.29 0.05 Southern Region 2.75 0.46 7.72 2.71 7.85 5.41 -3.36 0.10 4.47 1.12 -0.40 -1.21 30.57 0.51 Eastern Region -10.45 -4.01 2.86 -15.44 8.10 -0.56 -5.74 -1.93 3.74 9.23 0.74 -1.19 -16.20 -0.27 Central Region -10.72 -5.26 1.79 -12.49 7.89 3.42 -8.63 -2.11 1.17 3.91 -0.31 -4.00 -24.35 -0.41 Western Region -6.02 -1.73 5.09 -4.77 14.20 4.10 -3.89 -1.61 4.26 2.06 0.50 0.06 11.22 0.19 Northern Region -4.88 -15.29 -2.98 -21.88 18.44 -0.41 -9.68 -7.75 4.52 7.75 0.66 -5.10 -35.41 -0.59 Notes: Cropland includes area under field crops and hay, vegetables, sod, nursery products, fruits, berries, and nuts. Refer to table 2 notes for details of the crop categories included. Refer to the Appendix for a discussion of the changing definitions of a census farm. Calculations for Ontario include all five regions.
Annual percentage change is calculated by dividing the total change from 1951 to 2011 by 60 years. Source: Statistics Canada, 1951–2011.
One possible resolution of the different trends observed in estimates of farmland and cropland areas over time has to do with changes in what agri-cultural economists call the structure of agriculture, meaning the size dis-tribution of farms. Over time, consolidation into larger farm units has been occurring in agriculture across North America. Part of this change has to do with size and scale economies in farming, and part can be attributed to the rising opportunity cost of labour. We hypothesize that, as smaller farms have been consolidated into larger farms, the primary productive asset that has moved to the larger farms has been cropland. As we explain in the Appendix, the threshold for a farm to be counted in the Agricultural Census, historically, has been low. Many Census Farms are not what most people have in mind when they think of a farm. As smaller farms have exited from the Census data base, the non-cropland area that they occupied may have simply been dropped from the estimates, because the owners were not completing ques-tionnaires. On the other hand, cropland transferred, either through sales or leases, would be included in the questionnaires of the larger farm. We suspect that the non-cropland area of these smaller farms has largely remained intact, but that it is not being measured and hence the estimated area of farmland has appeared to decline.
Figure 1 shows the change in the number of census farms by size, in terms of land area. The green line represents the number of large farms, and shows a slightly increasing trend. The blue line represents the number of medium sized farms, and shows a decreasing trend—from 36,130 in 1966 to
Figure 1
Number of census farms in Ontario by size from Census of Agriculture, 1966–2011
Notes: See the Appendix for discussion of changes in definition of census farms. Small farms are de-fined as up to 179 acres (72.4 hectares), medium sized farms as from 180 to 1119 acres (72.8 hectares to 452.8 hectares), and large farms as 1120 acres (453.2 hectares) or more.
Number of farms 0 15,000 30,000 45,000 60,000 75,000 2011 2006 2001 1996 1991 1986 1981 1976 1971 1966 Small farms Medium-sized farms Large farms
18,233 in 2011, a decrease of 49 percent. The red line represents the number of small farms, which decreased sharply from 73,506 in 1966 to 32,170 in 2011, a 56 percent drop.
Annual provincial crop area data
Agricultural Statistics for Ontario data were published in paper form every year from 1951 to 1995. More recent data published on the Ontario Ministry of Agriculture, Food and Rural Affairs (OMAFRA) website under statistics and county data are available since 2003.7 We were able to obtain data for
the intervening years from statisticians at OMAFRA.
These provincial data do not include estimates of farmland or cropland area, but only areas for individual agricultural products. We added these indi-vidual product areas to obtain estimates of cropland area.8Figure 2 presents regional field crop harvested area. Southern Ontario and western Ontario show an increase in field crop area, while eastern Ontario and central Ontario remained relatively constant. Both southern Ontario and western Ontario started with 900,000 hectares of field crop harvested area in 1951; by 2013, the former reached above 1,200,000 hectares and the latter reached 1,000,000 hectares. There has been considerable variation in areas planted to individ-ual crops over time.9Figure 3 reports estimates of harvested cropland10 area at the provincial level. Two series are plotted. The longer series is based on our summation of reported individual field crop, fruit, and vegetable areas over the time period. The shorter series is a published total obtained from Historical Statistics. The minor differences between the two series arise due to periodic differences in the availability of area estimates for individual com-modities. Both series indicate a stable-to-slightly-increasing trend in cropland area during our study period.
7. During Census Years, OMAFRA usually transcribed the data from the Census, except
in census years after 1996. Even though these years were census years, OMAFRA still collected data from other sources. Refer to Wang (2015) for details.
8. Details of data of different crop categories at the county level are described in Wang (2015).
9. The areas of individual field crops respond to farmers’ price expectations and also to
weather conditions at the beginning of the growing season. Changing technology has also played a role. Historically, oat production declined as mechanical power replaced horses for field work.
10. Cropland area consists of field crop area plus the areas of fruits and vegetables.
Typically, area devoted to fruit and vegetable production has amounted to about 2.5 per-cent of cropland area in reper-cent years.
Figure 2
Estimates of regional field crop harvested area based on Agricultural Statistics for Ontario (1951–1995) and Statistics (1996–2013)
Notes: Refer to text for boundary definitions for regions.
Field crop harvested area is calculated by summing up the county level harvested area data of grain corn (1974–2013) or husking corn (1951–1973), soybeans, winter (1955–2013) or fall (1951–1954) wheat, spring wheat, buckwheat, oats, barley, rye, flaxseed, mixed grain, dry peas, dry beans, coloured beans, fodder corn, field roots (excluding potatoes), sugar beets and canola, which are categories listed in Agricultural Statistics for Ontario, field crops. Sweet corn is included in vegetables, so it is not shown here. Winter wheat was named fall wheat from 1951 to 1954. Rye was named fall rye from 1955 to 1962. Data for some crops are not available at the county level for certain years. Spring wheat data are not available from 1968 to 1996 and from 2010 to 2013 at the county level. Buckwheat data are not available from 1968 to 2013 at the county level. For flaxseeds, data are available from 1951 to 1967 at the county level. For dry peas, data are available from 1951 to 1967 at the county level. Dry white beans were named dry beans from 1951 to 1995 at the county level. For coloured beans, data are only available from 2005 to 2013 at the county level. Grain corn was called husking corn from 1951 to 1973 at the county level. For field roots, data are available only from 1951 to 1967 at the county level. For sugar beets, data are available at the county level from 1957 to 1966 only. For canola, data were only available from 2003 to 2013 at the county level. The missing data may lead to underestimation of field crop harvested area.
Source: OMAFRA, Agricultural Statistics for Ontario and Statistics, various years.
Thousand hec tar es 0 200 400 600 800 1,000 1,200 1,400 2011 2001 1991 1981 1971 1961 1951 Southern Ontario Western Ontario Central Ontario Eastern Ontario
Figure 3
Estimates of provincial cropland area based on Agricultural Statistics for Ontario (1951–1995) and Statistics (1996–2013), and Historical Provincial Estimates (1981–2013)
Notes: The red line represents data on cropland area collected at the county level, reported in
Agricultural Statistics for Ontario data and Statistics, from 1951 to 2013. The blue line represents data on cropland area collected at the provincial level, reported in the table “Historical Provincial Estimates” from 1981 to 2013.
Data cover Southern Region, Western Region, Eastern Region, Central Region, and Northern Region, and some data at provincial level are not reported at the county level.
Cropland area includes harvested field crop area, vegetables and fruits area.
Source: OMAFRA, Agricultural Statistics for Ontario and Statistics, various years.
Thousand hec tar es 2,000 2,500 3,000 3,500 4,000 2011 2001 1991 1981 1971 1961 1951 Historical Statistics Agricultural Statistics for Ontario
Agricultural Resource Inventory (1981
–
1982)
Agricultural Resource Inventory (ARI) data were collected by OMAFRA in 1982 and 1983. Data were collected by mapping crews doing in-field observa-tions. In 2010, the county level data were merged into a provincial ARI data set in Geospatial format. Farmland and cropland area are not defined in this data set. We added land use types into the categories of farmland or cropland to correspond to the approach in the Census. For example, we calculated crop-land area as the area sum of: continuous row crop, corn system, mixed sys-tem, grain syssys-tem, hay syssys-tem, peaches, cherries, peaches-cherries, orchard, vineyard, orchard-vineyard, vineyard-orchard, berries, extensive field vege-tables, market garden or truck farms, tobacco system, nursery, and sod farms, which are categories listed in the Agricultural Resource Inventory. Farmland is calculated as the sum of cropland, pasture, grazing, idle agricultural land, woodland, pastured woodland, swamp or marsh, and reforestation.
Table 5 reports the results at the regional level. Farmland area was 6,935,400 hectares during the period of 1981 to 1982 and cropland area was 4,322,194 hectares during the same period. Southern Ontario possessed the largest amount of cropland, at 1,586,482 hectares, and its farmland area was 1,605,779 hectares. Western Ontario had 2,029,173 hectares of farmland and 1,309,789 hectares of cropland. The province of Ontario, excluding the Northern Region, had 4,322,194 hectares of cropland and 6,935,400 hectares of farmland in the early 1980s, according to these estimates.
Table 5
Estimates of Ontario cropland and farmland area based on the Agricultural Resource Inventory, 1981–1982 (hectares)
Cropland Farmland Southern Ontario 1,586,482 1,605,779 Western Ontario 1,309,789 2,029,173 Central Ontario 814,770 1,691,719 Eastern Ontario 611,153 1,608,729 Ontario total 4,322,194 6,935,400
Notes: Cropland calculated as the area sum of: continuous row crop, corn system, mixed system, grain system, hay system, peaches, cherries, peaches-cherries, orchard, vineyard, orchard-vineyard, vineyard-orchard, berries, extensive field vegetables, market garden/truck farms, tobacco system, nursery and sod farms. Cropland is calculated in a manner consistent with definition of cropland in the Census of Agriculture. Farmland includes cropland, pasture, grazing, idle agricultural land, woodland, pastured woodland, swamp/marsh, and reforestation.
Data were collected by study teams using field surveys from 1981 to 1982. Ontario total excludes northern Ontario.
Annual Crop Inventory (2011–2013)
The Annual Crop Inventory dataset (2011–2013) was compiled by Agriculture and Agri-Food Canada (AAFC) using remote sensing technology, using vari-ous methods. Data are available for 2011, 2012, and 2013 for Ontario. The data exist in the form of projected geospatial data, with map projections developed by AAFC. AAFC cooperates with provincial crop insurance agencies to valid-ate the crop inventory data. Where insurance data are not available, ground-truth data were acquired by AAFC staff and from other resources. For Ontario, the overall accuracy of the interpretation of the remote sensing data was 82 percent for 2011, 76 percent for 2012, and 87 percent in 2013. The lower accuracy in 2012 had to do with using lower cost remote sensing and inter-pretation methods. Neither farmland nor cropland estimates are reported as aggregates in this data set. We used a procedure similar to what we used with the Agricultural Resource Inventory to construct these aggregates.
Table 6 reports cropland area from this dataset from 2011 to 2013. At the provincial level, excluding northern Ontario, cropland area was 2,848,693 hectares in 2011, 2,633,224 in 2012, and 2,893,044 in 2013. At the regional level, southern Ontario, which had the largest cropland area, had a more or less constant amount of cropland area, ranging from 1,332,532 hectares to 1,391,434 hectares during the period. Western Ontario had the second largest area of cropland, ranging from 812, 269 to 878,507 hectares during the period.
Canada Land Inventory System
Often, concerns about loss of farmland focus on the conversion of high qual-ity agricultural land to non-farm uses. Provisions aiming at protecting prime agricultural land can be found in the Provincial Policy Statement (2014) and the Greenbelt Plan (2005). The Canada Land Inventory System (AAFC, 2013) classifies agricultural land into seven categories based on physical land and soil attributes and climatic information.
Table 7 lists the definitions of each major soil class.11 The major soil
classes describe to what extent a plot of land is suitable for agriculture. Any individual land parcel can consist of several different major and minor soil classes. Class 1 to Class 3 land is often used to define prime agricultural land or dependable agricultural land.
11. There are also minor soil classes in the CLI that describe the factors contributing to the soil’s ability to accommodate agricultural production.
Table 6
Estimates of Ontario cropland area based on the Crop Inventory, 2011–2013 (hectares) 2011 2012 2013 Southern Ontario 1,332,532 1,391,434 1,360,443 Western Ontario 853,551 812,269 878,507 Central Ontario 363,924 260,000 369,635 Eastern Ontario 298,687 169,522 284,460 Ontario total 2,848,693 2,633,224 2,893,044
Notes: Cropland area is calculated as the area sum of all crops estimated in a year recorded by
Agricultural and Agri-food Canada in its Crop Inventory (2011–2013). Crop classification is based
on data accuracy each year. If the accuracy of distinguishing certain crops is low, these crops will be classified in an upper category. (i.e., if winter wheat and spring wheat cannot be distinguished,
they will be classified as wheat). Categories for each year will be listed in the notes below. The Crop
Inventory data exist in the format of geospacial raster data, and Arc GIS is the software applied here to convert the data from raster to polygon data, and to calculate the sums for each category in each county. A projected map of 2011 Ontario’s county boundaries was placed as an upper layer on the
Crop Inventory map. The projection method applied to the Ontario’s county boundary is “NAD_1983_ Ontario_MNR_Lambert”. Data for each county were extracted by cutting out the individual county on the Crop Inventory map. Once data for a single county were collected, each crop category area was
calculated by summing up all the area polygons which are in the same category. The Crop Inventory
comes with a customized projection method, which cannot be found in the ArcGIS software. So there exists a possibility of measurement error when calculating the county level crop area data.
In 2011, cropland area includes: fallow, cereals, camelina, canola, sunflowers, soybeans, beans, peas, beans, vegetables, fruits, herbs, nursery, buckwheat, other crops and undifferentiated agriculture. For this year, individual types of cereal were not identified. Corn, wheat, and soybeans were not identified individually.
In 2012, the cropland area includes: fallow, cereals, barley, corn, canola, sunflowers, soybeans, peas, beans, vegetables, potatoes, sugarbeets, other vegetables, fruits, berries, orchards, vineyards, herbs, nursery, buckwheat, hemp, other crops and undifferentiated agriculture. For this year, types of cereals other than barley and corn were not identified individually.
In 2013, the cropland area includes: fallow, barley, oats, rye, triticale, wheat, corn, other cereals, gin-seng, canola/rapeseed, mustard, safflower, sunflowers, peas, soybeans, beans, potatoes, sugarbeets, vegetables, other vegetables, fruits, berries, orchards, other fruits, vineyards, herbs, sod, nursery, buck-wheat, tobacco, undifferentiated agriculture, and other crops.
Ontario total excludes northern Ontario. Refer to text for boundary definition.
Table 7
Canada Land Inventory definitions: Soil capability for agriculture (major classes)
Class 1
Soils in this class have no significant limitations in use for crops. The soils are deep, are well to imperfectly drained, hold moisture well, and in the original state were well supplied with plant nutrients. They can be managed and cropped without difficulty. Under good management they are moderately high to high in productivity for a wide range of field crops.
Class 2
Soils in this class have moderate limitations that restrict the range of crops or require moderate conservation practices. The soils are deep and hold moisture will. The limitations are moderate and the soils can be managed and cropped with little difficulty. Under good management they are moderately high to high in productivity for a fairly wide range of crops.
Class 3
Soils in this class have moderately severe limitations that restrict the range of crops that can be grown or require special conservation practices. The limitations are more severe than for class 2 soils. They affect one or more of the following practices: timing and ease of tillage, planting and harvesting, choice of crops, and methods of conservation. Under good management they are fair to moderately high in productivity for a fair range of crops.
Class 4
Soils in this class have severe limitations that restrict the range of crops that can be grown or require special conservation practices. The limitations seriously affect one or more of the following practices: timing and ease of tillage, planting and harvesting, choice of crops, and methods of conservation. The soils are low to fair in productivity for a fair range of crops but may have high productivity for a specially adapted crop.
Class 5
Soils in this class give very severe limitations that restrict their capability in producing perennial forage crop and improvement practices are feasible. The limitations are so severe that soils are not capable of use for sustained production of annual field crops. The soils are capable of producing native or tame species of perennial forage plants, and may be improved by use of farm machinery. The improvement practices may include clearing of bush, cultivation, seeding, fertilizing, or water control.
Class 6
Soils in this class are capable only of producing perennial forage crops and improvement practices are not feasible. The soils provide some sustained grazing for farm animals, but the limitations are so severe that improvement by use of farm machinery is impractical terrain may be unsuitable for use of farm machinery, or the soils may not respond to improvement, or the grazing season may be very short.
Class 7 Soils in this class have no capacity for arable culture or permanent pasture. This class also includes rockland, other non-soil areas, and bodies of water too small to show on the maps.
Class 0 Organic soils (not placed in capability classes).
Note: There are 8 major classes in this system in addition to 13 sub-categories of classes. Class 1 is considered to be the most suitable for mechanized agricultural production, Class 7 the least suitable. Class 0 is organic soil, which is not placed in capability classes.
Soil Survey Complex Data (2009)
The Soil Survey Complex database for southern Ontario has been produced by the Ontario Ministry of Agriculture and Food, the Ontario Ministry of Rural Affairs, and Agriculture and Agri-Food Canada, in cooperation with the Ministry of Natural Resources (Land Information Ontario, 2009). The existing data were collected by surveyors from the 1920s to the 1990s, but the data are still being updated (Rabe, 2014). Up to three soil classes are recorded for each map unit or “polygon”, representing a parcel of land on the map. Nevertheless, the number of soil classes to be included in the dataset is up to the surveyor’s professional judgement. For instance, a parcel of soil may contain more than 3 classes of soils, but the surveyor must estimate, based on his or her knowledge, the three predominant classes in each polygon12.
The percentages of the three soil types are assumed to add up to 100 percent.
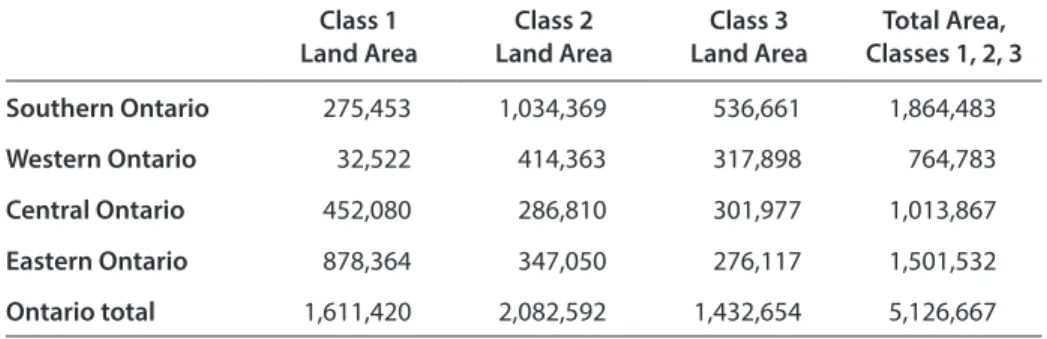
Table 8 presents the area of dependable agricultural land at the regional level. Southern Ontario possesses the third largest area of class 1 land at 275,453 hectares. Western Ontario has the most class 1 land, at 878,364 hectares, and central Ontario comes second with 452,080 hectares of class 1 land. However, when examining the amount of dependable agricultural land, southern Ontario comes first with 1,864,483 hectares, followed by western Ontario with 1,501,532 hectares and central Ontario with 1,013,867 hectares.
Table 8
Estimates of total Class 1, Class 2, and Class 3 land area in Ontario, based on the Soil Survey Complex (hectares)
Class 1 Land Area Class 2 Land Area Class 3 Land Area Total Area, Classes 1, 2, 3 Southern Ontario 275,453 1,034,369 536,661 1,864,483 Western Ontario 32,522 414,363 317,898 764,783 Central Ontario 452,080 286,810 301,977 1,013,867 Eastern Ontario 878,364 347,050 276,117 1,501,532 Ontario total 1,611,420 2,082,592 1,432,654 5,126,667
Notes: The Soil Survey Complex (2009) reports the most recent soil class data available for Ontario. Data
were collected by OMAFRA, whose surveyors conducted soil survey for each county.
The figures were calculated by applying the boundary definitions onto the soil data using ArcGIS. Refer to table 7 for soil class definitions.
Ontario total excludes northern region. Refer to text for boundary definitions. Source: OMAFRA, 2009a.
Other estimates of agricultural land area in Ontario
Hofmann (2001) and Hofmann et al. (2005) reported estimates of dependable agricultural land for Ontario, and estimates of the cumulative amount of Class 1 agricultural land that has been converted to urban uses since the beginning of European settlement. Hofmann (2001) estimated that 6.8 percent of the land area of Ontario is dependable agricultural land and that 13 percent of Class 1 land had been converted to urban uses by 1971, 14 percent had been converted by 1981, 17 percent by 1991, and 19 percent by 1996. Findings from this first study have been quoted widely in both the research literature and in the press.
Hofmann et al. (2005), however, estimated that 15.5 percent of Ontario’s land area is dependable agricultural land, more than double the previous estimate of 6.8 percent. The 2005 report shows that the conversion rate of Class 1 agricultural land to urban uses since the beginning of European settlement was 5 percent by 1971, 7 percent by 1981, 9 percent by 1991, and 11 percent by 2001. In contrast to Hoffman (2001), this study has been generally ignored in the research literature and the press.
The two studies used different data sources: for the 2001 report, McCuaig and Manning (1982) and the Environment Accounts and Statistics Division in Statistics Canada, and for the 2005 report, the Canada Land Inventory and the Environment Accounts and Statistics Division in Statistics Canada. The method used to calculate settlement areas was different as well. In the 2001 report, estimated settlement area was calculated by generating circles around urban areas, while these estimates were calculated as squares in the 2005 report.13 The second approach generated much lower and
argu-ably more realistic estimates of urban area, since settlement areas more typ-ically follow a rectangular road grid pattern.
Gagnon et al. (2014) estimated the change of agricultural land at the national scale based on ecozones, and concluded that urban development on prime agricultural land has not been a significant contributor to farmland conversion in the Mixedwood Plains ecozone. The Mixedwood Plains eco-zone corresponds to southern Ontario and western Quebec (Gagnon et al., 2014). Table 9 presents their estimates of total dependable agricultural land, farm area on dependable agricultural land, and settled area on dependable agricultural land. The authors used a different settlement area GIS map and a different GIS map projection from the one used by Hofmann et al. (2005). 13. Filoso (2014) wrote that : “The reports used urban enumeration area (EA) points from the census years (1971 to 2001) and generated a polygon based on the average urban EA polygons from the 1991 Statistics Canada digital EA polygon file. The first pass (2001 report) generated circles with the calculated average provincial urban EA area. In 2005 it was decided that instead of using a circle we would generate a square around each urban EA point. This was deemed to be closer to the rectangular grid pattern of the road network.”
Table 9 suggests that there are 6,991,637 hectares of dependable cultural land in the Mixedwood Plains. The farmland area on dependable agri-cultural land was 4,567,559 hectares in 2000 and 4,360,662 hectares in 2011, which represents a 4 percent decrease from 2000 to 2011. Settled area on dependable agricultural land increased by 128,030 hectares, or 27 percent, from 2000 to 2011. The authors pointed out that “over half this growth came from the Greater Golden Horseshoe.” However, the settlement area is relatively small compared to the total area of dependable agricultural land in this ecozone. Cummings (undated) reported that, from 2001 to 2011, the rate of decline in farmland area within the Ontario Greenbelt was 16 percent higher than the rest of Ontario, which saw a decline of 5.4 percent during the same period. However, we believe that cropland area is a more relevant measure of the agricultural land base than farmland area. Dr. Cummings kindly shared his customized data (Statistics Canada, 2014) to enable us to calculate chan-ges in cropland area for 2001, 2006, and 2011. Table 10 shows that from 2001 to 2006, cropland area within the Greenbelt Area decreased by 7.8 percent. From 2006 to 2011, cropland area within the Greenbelt Area decreased by 3.79 percent. The total decrease in cropland area within the Greenbelt Area from 2001 to 2011 was 11.3 percent. The trend for the rest of Ontario showed a minor increase of 0.77 percent in cropland area from 2001 to 2006, followed by a decrease of 1 percent from 2006 to 2011, so from 2001 to 2011, the total
Table 9
Farm area and settled areas in relation to Canada Land Inventory by ecozone (hectares) Dependable agricultural land Land with important limitations for agriculture
Farm area on dependable agricultural land
Farm area on land with important limitations for
agriculture Settled area on dependable agricultural land 2001 2011 2001 2011 2000 2011 Canada total 50,534,9224 74,413,254 36,796,533 35,826,731 23,410,939 23,772,487 1,173,8245 1,393,335 Mixedwood Plains 6,991,637 2,812,461 4,567,559 4,360, 662 1,297,333 1,242,348 479,923 607,953 Notes: Dependable agricultural land is land designated as Class 1 (no significant limitations), Class 2 (moderate limitations) and Class 3 (moderately severe limitations) by the Canada Land Inventory and includes all evaluated land areas that are not affected by severe constraints for crop production. Land with important limitations for agriculture is designated as Class 4 (severe limitations), Class 5 (forage crops improvement practices feasible), and Class 6 (forage crops improvement practices not feasible).
Settled area is based on Agriculture and Agri-Food Canada’s (AAFC) 30 m land cover code for developed areas. Some northern areas only partially covered by the AAFC land cover were supplemented with estimates derived from Statistics Canada’s settlements data and AAFC’s 30 m land cover (see Statistics Canada, 2013: Map 1, Appendix C, for geographic coverage).
Total dependable agricultural land presented here differs from that in Hofmannet al. (2005), due to differences in the projection se-lected and the reporting geography for the GIS analysis and the supplementary data sources.
Total settled area on dependable agricultural land presented here differs from that in Hoffman et al. (2005); the latter uses 2001 Census Enumeration Area (EA) files for the estimate of total settled area, while this study mainly used 2000 AAFC 30 m satellite im-agery.
The Mixedwood Plains ecozone covers the Quebec City–Windsor corridor, including Southern Ontario. Source: Gagnon et al., 2014.
Comparisons among datasets and studies
While there are important differences in data collection methods, definitions and area of coverage, the data indicate a consistent pattern with respect to cropland area and dependable agricultural land area. While farmland area has experienced a long-standing declining trend in Ontario, cropland area and dependable agricultural land area have been either almost constant or perhaps increasing slightly. Conversion of cropland area and dependable agri-cultural land area to non-agriagri-cultural uses, which may be taking place at sig-nificant rates in some locations, from a provincial scale does not seem to be a significant factor influencing the availability of agricultural land. Our view is that cropland area or dependable agricultural land area are better indica-tors of the land base of agriculture in Ontario. In addition to estimates of land area, however, important changes have taken place over the time period cov-ered in this study, changes that have influenced the productivity and quality of the agricultural land base in Ontario. These changes need to be taken into account in any consideration of the adequacy of the amount of agricultural land in the province.
Table 10
Cropland area, Ontario’s Greenbelt versus the rest of Ontario, 2001–2011 (hectares) 2001 2006 2011 Percentage change, 2001-2006 Percentage change, 2006-2011 Percentage change, 2001-2011 Ontario total 3,656,705 3,660,941 3,613,821 0.11584% -1.28710% -1.17275% Greenbelt area 278,570 256,824 247,102 -7.80629% -3.78555% -11.29633% Rest of Ontario (excluding Greenbelt) 3,378,135 3,404,117 3,366,719 0.76912% -1.09860% -0.33793%
Sources: Statistics Canada, Census of Agriculture, various years; Cummings (undated); customized data request from Statistics Canada.
Crop yield data (1980–2014)
Like many agricultural regions of the world, output per hectare of most crops has increased substantially in Ontario over the time period considered in this study. Figure 4 presents provincial selected crop yields from 1980 to 2014 for four major crops: grain corn, soybeans, winter wheat, and hay.14
Grain corn yields increased substantially, from 6,000 kilograms per hectare in 1981 to over 10,000 kilograms per hectare in 2014. The yield of winter wheat has increased by 48 percent and the yield of soybeans increased by 40 per-cent during the same period. Increases in yields have been achieved through improvements in technology and management, including investments in tile drainage, which we will discuss separately. One implication of these increased yields is that, if the primary concern about the adequacy of the supply of agricultural land is food security or the viability of the agricultural economy, then less land is needed to produce the volume of production obtained in the past. In principle, this could free up agricultural land for other purposes, including habitat, recreation, transportation infrastructure, and urban use.
14. Date for major crop yields were available at the provincial level, published on the
Figure 4
Estimates of provincial average yields for selected crops, 1981–2014
Source: OMAFRA, Statistics,, various years.
Kilog
rams per hec
tar e 0 2,000 4,000 6,000 8,000 10,000 12,000 2011 2001 1991 1981 Grain corn Hay Winter wheat Soybean
Tile drainage area (2012)
Excess moisture at the beginning of the growing season can limit yields on poorly drained soils. Farmers have made extensive investments in tile drainage to overcome this limitation to crop production.15 Tile drainage can improve
average yields and reduce production risk, making lower quality land (in the absence of tile drainage) into better quality, more productive land. Tile drain-age area data are compiled by the Ministry of Natural Resources, based on information provided by installers.16Table 11 presents the tile drainage area at the regional and provincial level. As of 2012, a total of 1,646,624 hectares had been tile drained in Ontario, excluding northern Ontario. This represents about 50 percent of the cropland area from the Statistics data, indicating a substantial increase in the capability of agricultural land in the province.
Summary
The available data and published research indicate that the total amount of cropland area in Ontario has been roughly constant or has increased slightly over the past 50 years. These findings are consistent with earlier work by Frankena and Scheffman (1980) and also with more recent research by Labbé et al. (2007). In addition, advances in technology and management practices and investments in tile drainage have increased the capability of this farm-land for food production substantially. Frequently quoted estimates of loss in farmland area, in our judgement, are less informative measures of the 15. The term “tile drainage” has been carried over from an earlier era. Current practice involves
burying a system of interconnected plastic pipes under farmland to collect excess water.
16. Details of data collection and calculations are reported in Wang (2015).
Table 11
Estimates of provincial and regional cumulative tile drainage area Hectares Southern Region 882,554 Western Region 517,502 Central Region 70,934 Eastern Region 175,634 Ontario total 1,646,624
Notes: Tile Drainage area data were recorded up to 2012, with continuing updates. Tile drainage rec-ords were collected from sources of GIS, GPS, Tile Drainage Record, and other sources.
Ontario total excludes northern region. Refer to text for boundary definitions for regions. Source: OMAFRA, 2010b.
adequacy of the supply of agricultural land in Ontario and may have had an undue influence on popular perceptions of trends. An additional factor that may have influenced public perceptions is that an increasingly urbanized population in Ontario has less direct contact with rural landscapes outside the Golden Horseshoe region. What they might perceive regarding trends in agricultural land area where they live is not indicative of the situation for the province as a whole.
2. Provincial land use policy
analysis framework
Frankena and Scheffman (1980) found, for the 1951–1980 time period, that rural land use policy in Ontario exhibited a limited appreciation for the potential contributions of economic analysis, and that a trend was evident toward increased centralized control of land use. We document and review major changes in land use policy since 1980 and confirm their findings for the post-1980 period. Land use policies have become even more centralized and restrictive since 1980. Yet most Ontario land use policies lack cost-benefit analysis or implementation analysis to justify rationales and implementation. Land use policy has relied heavily on physical attributes assessment. More specifically, prime agricultural land, which is designated based on the CLI system, has been increasingly used as the stated rationale for land use policy and as the criterion for selecting land to be protected, indicating an implicit reliance on a theory of absolute, rather than comparative advantage.
To develop a conceptual framework to guide this aspect of our analysis, we summarize the elements of the economic theory of government policy, drawing on elements of the theories of market and non-market failure. In addition, we explain some implications of the economic calculation debate and the economic theory of comparative advantage which are relevant for the economic analysis of land use policy in Ontario.
With this framework in hand, we proceed in Section 3 to identify the major changes in rural land use policy that have occurred in Ontario since 1980 and document the stated rationales for these policy changes—the stated purposes and objectives. We then characterize changes in the assignment of powers and authorities, particularly in the distribution of power and author-ity between the provincial government and the municipal levels of govern-ment. We also describe the evidence, if any, that was offered in support of the stated rationales for each major policy change. We go on to compare the stated rationales for policy changes to the categories of market failure and discuss the available evidence for the stated policy rationales. We identify possible non-market failures associated with the policy changes.
Background
The report of the Niagara Escarpment Task Force states that:
The most common means used so far to preserve Escarpment land is public purchase. But it is highly questionable whether a program based on this method could preserve the whole Escarpment. Cost alone would seem to rule out this possibility. The Task Force has es-timated that purchasing only the relatively small area adjacent to the Escarpment face would cost more than $3 billion—half the province’s total budget. (Niagara Escarpment Task Force, 1972)
Following the publication of the report, in 1973, John White, then the Treasurer of Ontario, made a statement at the second reading of the Niagara Escarpment Plan:
The question has been asked about acquiring, by purchase, all of the lands. In fact, in my view and the view of my colleagues, this is com-pletely unnecessary. With the strong planning framework which the government now accepts, the purchase of all this land is simply not es-sential, we can conserve through planning designation for the benefit of all our people. (White, 2004)
This turned out to be a pivotal moment in land use policy in Ontario. Previously, the provincial strategy for protection of what today might be called environmentally sensitive land was to purchase that land, in an open mar-ket transaction, from current private land owners, and to apply parkland or wilderness land management policies to these newly acquired government lands. These purchases were financed either from provincial tax revenues or from donations. The approval and implementation of the Niagara Escarpment Plan, however, introduced a new policy approach, involving designation and planning, while the actual title of the lands in question remained nomin-ally with the original private owners. The stated rationale for this change in policy was that the old approach, while effective, was more costly than the new approach. From a more holistic economic and distributional perspective however, the claim that the planning and designation approach was less costly sidestepped the question of “Less costly for whom?” Planning and designa-tion reduces costs for taxpayers and beneficiaries of these land protecdesigna-tion actions. However, the use of designation and planning increased costs for land owners, compared to the previous approach.
Market failure rationales for intervention
in rural land markets
The economic theory of government policy requires that a market failure must be identified if a policy is to have an economic justification. Market failures represent inefficient use of resources. Policy, potentially, can reduce those inefficiencies. In the absence of a documented market failure, however, there is no economic rationale for policy action. Wolf (1979) argued that the presence of market failure is a necessary but not sufficient condition for government policy, and developed a theory of non-market or policy failure as an analogue to the theory of market failure. The theory of non-market failure suggests that, sometimes, the policy cure is worse than the market failure disease.
Frankena and Scheffman (1980) began their examination of policies by identifying potential market failures in rural land markets. The four main categories of market failure that have been prominent in the rural land use policy context are public goods, externalities, excessive discounting, and uninsurable risk.
Public goods
According to Samuelson (1954), public goods are non-rival in consumption and it is either expensive or difficult to exclude people who have not contrib-uted to their provision from consuming them. Non-rivalrousness requires that the consumption of a good by one person does not reduce its availabil-ity to others. Public goods lead to inefficiency in several ways, but, generally, the main concern is under-provision. First, difficulties in exclusion create an incentive to free ride, which, if it becomes the dominant strategy, can lead to excessive demand. Second, the non-rival nature of consumption means that the marginal cost of providing a public good for one more person is zero. So the efficiency condition of setting marginal cost equal to marginal revenue requires that public goods be made available at a zero price. The standard model for efficient financing for public goods, then, is to use general tax rev-enues to pay for a public good and then to make that good available at no cost.17
Barlowe (1986) and others have argued that open space is a public good. Rural land, including farmland, provides scenic amenity services. These 17. In practice, textbook writers and others often off