Temi di Discussione
(Working Papers)
A public guarantee of a minimum return
to defined contribution pension scheme members
by Giuseppe Grande and Ignazio Visco
762
Temi di discussione
(Working papers)
A public guarantee of a minimum return
to defined contribution pension scheme members
by Giuseppe Grande and Ignazio Visco
The purpose of the Temi di discussione series is to promote the circulation of working
papers prepared within the Bank of Italy or presented in Bank seminars by outside economists with the aim of stimulating comments and suggestions.
The views expressed in the articles are those of the authors and do not involve the responsibility of the Bank.
Editorial Board: ALFONSO ROSOLIA, MARCELLO PERICOLI, UGO ALBERTAZZI, DANIELA MARCONI,
ANDREA NERI, GIULIO NICOLETTI, PAOLO PINOTTI, MARZIA ROMANELLI, ENRICO SETTE, FABRIZIO VENDITTI.
A PUBLIC GUARANTEE OF A MINIMUM RETURN TO DEFINED CONTRIBUTION PENSION SCHEME MEMBERS
by Giuseppe Grande* and Ignazio Visco*
Abstract
The recent financial crisis has clearly demonstrated the exposure of defined contribution (DC) pension scheme members to extreme financial market risks. This paper argues that the government might offer DC plan members a minimum return guarantee, funded by risk-based premia. Option pricing formulas show that the guarantee could be quite expensive, but public provision could reduce the costs borne by workers. Such an arrangement would be sustainable for the government and would give workers an acceptable benefit/contribution ratio in worst-case scenarios, while still allowing them to reap the advantages of occupational or individual funded pension schemes.
JEL Classification: D10, G23, H55, J14.
Keywords: defined contribution pension schemes, financial market tail risks, return
guarantees, exchange option, Modigliani’s Treasury CFDB swap.
CONTENTS
1. Introduction... 5
2. Mixed defined benefit pension schemes ... 6
3. Defined contribution pension schemes with forms of financial protection ... 8
4. A public minimum return guarantee for defined contribution schemes ... 9
5. Long-run growth in GDP and share prices: a comparison... 12
6. The advantages for the worker of a government-guaranteed minimum return ... 14
7. The risks of a guarantee fund... 16
8. An assessment of the premium payable by the pension scheme members... 20
9. Why should the guarantee be provided by the government? ... 27
10. Conclusions... 29
Appendix A: The data used in the estimates of guarantee fund’s maximum outlays... 30
Appendix B: The method of estimating the option value ... 31
Appendix C: The value of the option with a lump-sum investment ... 32
References... 33
_______________________________________
* Bank of Italy. The corresponding author is Giuseppe Grande: [email protected] (address: Via Nazionale, 91 – 00184 Roma – Italy; tel.: +390647922643; fax: +390647923720).
1. Introduction1
In a typical defined contribution (DC) pension scheme the investment risk is borne entirely by the plan member. This basic characteristic of DC schemes has long been acknowledged and underscored both by researchers on social security systems and by experts of economic policy authorities.2 Involving as it does the transfer of financial risks from firms or from the public sector to workers, this feature should be a concern for government authorities. In fact, sample surveys reveal a low level of financial education among consumers, even in countries where pension funds have been in existence the longest.3 It is also likely that exposure to investment risk goes some way to explain the low levels of membership and contributions to these schemes in a number of countries.4
The management of financial investment risks is a rather complex task, even for specialized intermediaries. This is because the prices of financial assets are subject to what are known as tail risks, in other words to the tendency to generate extreme losses with a greater frequency than what “chance” would be expected to generate in normal conditions. A clear demonstration of how vulnerable any pension scheme based on the accumulation of financial assets is to stock exchange downturns was seen in the recent financial crisis. For the United States, for instance, there is evidence that in 2008 many 401(k) participants nearing retirement (aged 56–65) had very high exposures to equities and suffered large reductions in their account balances (on the order of 25 per cent).5 Somewhat more reassuring is the evidence provided by Gustman, Steinmeier and Tabatabai (2009) using data from the Health and Retirement Study. Rather low stock market holdings and substantial reliance on defined benefit (DB) plans as primary pension are likely to have muted the impact of the financial crisis on the wealth of US households in which at least one member is approaching retirement. Nevertheless, there is little dispute that future generations of retirees will rely on DC plans much more than current generations. Moreover, as Coile and Levine (2009) stress, severe financial turbulences are typically associated with weak labour markets and if older job seekers have difficulty finding work, they may retire earlier than expected (rather than delaying retirement), resulting in lower pension income.
1
We are greatly indebted to Hideki Konishi, Filippo Taddei and Juan Yermo for very helpful discussions. We are grateful for useful comments from Henk J. Brouwer, Riccardo Cesari, Nicolas A. Cuche-Curti, Antonio Di Cesare, Lorenzo Forni, Maura Francese, Daniele Franco, Andrea Gerali, Laurence J. Kotlikoff, Giuseppe Marotta, Sandro Momigliano, Joana Pereira, Tommaso Perez, Antonio Rossetti, Paolo Sestito, Mauricio Soto, Daniele Terlizzese, Anita Tuladhar, Roberto Violi and seminar participants at the Bank of Italy, the Center for Advanced Research in Finance of the University of Tokyo, the CeRP 10th Anniversary Conference (Collegio Carlo Alberto, Moncalieri) and the conference on “Risk Sharing in Defined Contribution Pension Schemes” held at the University of Exeter on 7-8 January 2010. The views expressed herein are those of the authors and do not necessarily reflect those of the Bank of Italy. The authors are solely responsible for any errors.
2
See, for example, Diamond (1977), Bodie (1990), Fornero (1999), Blake (2000), Campbell and Feldstein (2001), Orszag and Stiglitz (2001), the Group of Ten (2005) and the Pensions Commission (2005).
3
See OECD (2005), and Lusardi and Mitchell (2007). For an analysis of some of the evidence in Italy, see Cesari, Grande and Panetta (2008).
4
For a discussion of the low level of contributions to pension funds and the high degree of exposure to financial risks of members of DC pension funds, see Visco (2009).
5
See VanDerhei (2009). Changes in account balances reflect not only investment returns but also contributions, which increase the rate of accumulation. For cross-country evidence on the impact of the crisis on pension funds, see Antolín and Stewart (2009).
The objective of avoiding or reducing workers’ exposure to financial risks is one of the reasons for the development of mixed pension schemes, such as “hybrid” DB funds or DC funds with forms of protection of returns. Moreover, in some countries, public authorities provide rate of return guarantees. In the wake of a dramatic financial crisis, it is vital to consider whether the forms of protection from fluctuations in the prices of financial assets now available to DC plan members can actually provide an effective shield against extreme investment risks. This calls for greater use of intergenerational risk sharing (Bütler, 2009) and, as with the unresolved problem of aggregate longevity risk,6 possible forms of public intervention (Visco, 2009).
This paper assesses the hypothesis of the government providing DC plan members with the guarantee of a minimum return. The guarantee would be compulsory, but each plan member could choose among different levels of minimum return depending on the maximum loss that he or she would be willing to bear. DC plan members should pay risk-based premia to a guarantee fund, which would be able to prefund its activity.
Two aspects should be highlighted to place things in proper perspective. First, our proposal is not only fully consistent with the private provision of occupational or individual funded pension schemes, but is designed to strengthen the DC pillar of retirement systems, as it would allow governments not to leave workers alone to deal with extreme financial market risks. Second, the advantage of introducing a public minimum return guarantee depends critically on the design of the overall retirement arrangements; it is less relevant for countries where public pensions represent the bulk of retirement income.
We start by briefly examining the main characteristics of mixed DB pension schemes (Section 2) and mixed DC schemes (Section 3). Section 4 presents the guarantee mechanism. Section 5 shows some statistics illustrating the long-term relationship between GDP growth and trends in financial markets. Then the paper analyzes the benefits and risks of the proposed guarantee scheme (Sections 6 and 7, respectively). Section 8 addresses the issue of how to determine the market value of the guarantee, and Section 9 summarizes the reasons why government intervention might be necessary. Section 10 concludes.
2. Mixed defined benefit pension schemes
Several DB pension schemes aim to shelter members from investment risks, but establish some relationship between contributions paid in and benefits (a typical characteristic of DC funds) in order to favour fund solvency.
Three notable examples of these mixed pension schemes (also known as “hybrid”) are: (1) cash balance plans, which in the past decade have expanded significantly in the United States; (2) collective pension schemes in the Netherlands; and (3) the centralized DB pension fund proposed in the first half of this decade by Franco Modigliani and his co-authors.
CASH BALANCE PLANS. To all effects and purposes, these are DB schemes, in which the investment risk is borne entirely by the pension fund sponsor (typically the employer). Like all other defined-benefit plans cash balance plans are guaranteed,
6
within certain limits, by the Pension Benefit Guaranty Corporation. What sets them apart from the others is the fact that the amount of pension benefits does not depend on parameters such as pay or length of service but on two other variables: the contributions paid in and a predetermined capitalization rate (which can be fixed or variable). In fact, in a cash balance plan, the contributions paid in by the worker (directly, or by the employer on his behalf) are capitalized at a previously set rate, which in turn can be indexed to another variable (for example, the yield on 1-month US Treasury bonds). The benefit the worker receives at retirement will therefore depend on the total amount of contributions and this capitalization rate. Members’ contributions to cash balance plans are invested on financial markets by the employer; it is therefore the employer who is responsible for all the entire investment risk and return.7
COLLECTIVE PENSION SCHEMES IN THE NETHERLANDS. Dutch collective pension schemes have a mechanism of intergenerational risk-sharing. Through a combination of increases in contributions and cuts in indexation of pension benefits, funding deficits are shared among currently employed people, pensioners and future generations. The benefits of this and other mechanisms of intergenerational solidarity that characterize Dutch collective pension schemes have to be assessed against the costs of restrictions of individual choices and possible labor market distortions.8
THE MODEL OF MODIGLIANI ET AL.The model for a pension system proposed by Modigliani and his co-authors arose primarily from the concern that workers should not be left alone to cope with investment risks.9 According to the proposal, the fulcrum of the retirement system should be a centralized and fully funded scheme, that is financed by mandatory contributions and that offers defined benefits (contributory funded defined benefit scheme, CFDB scheme). In this system, the workers (and their employers) pay in contributions to the fund, which credits them to individual accounts. These payments are managed on a collective basis (by government or by private intermediaries delegated for this purpose); once a year (or in any event periodically), the pension fund effects a swap with the Treasury, whereby the earnings accrued in the year through the management of the portfolio are swapped with those that would have been generated if the return on the portfolio’s management had been equal to a previously determined amount (5 percent, in Modigliani and Muralidhar’s proposal of 2004). This swap assures all workers that the contributions to the CFDB fund are capitalized at a fixed rate and that the investment risk will be borne entirely by government.10
7
The cash balance accounts differ from typical DB funds in other ways too, such as the procedure for paying out the pensions, which in cash balance accounts can take the form of a lump sum rather than an annuity.
8
An example of how a Dutch collective pension fund would deal with a negative asset shock is provided by Bonenkamp, van de Ven and Westerhout (2007). For a general discussion of the costs and benefits of this type of pension schemes, see van der Lecq and Steenbeek (2007).
9
See Modigliani, Muralidhar and Ceprini (2000), Modigliani and Muralidhar (2004), and references therein.
10
Another advantage of the CFDB fund is that the pooled management of the contributions of all workers reduces the cost of managing the portfolio; also, workers with the same pension contributions and similar in all other respects are guaranteed similar rates of return.
3. Defined contribution pension schemes with forms of financial protection
DC pension funds may offer members either relative rate guarantees or fixed rate guarantees.11 In the case of the former, the guaranteed return is tied to an index. A well-known example is Chile, where the guarantee is linked to the average return earned by all pension fund management companies. These forms of guarantee typically do not provide a hedge against generalized adverse conditions in financial markets. Fixed rate guarantees may take the form of a flat rate (such as 2.5 percent per year) or a minimum rate. In the case of the flat rate, the DC pension fund becomes a mixed DB pension scheme, like a cash balance plan. In what follows, therefore, we focus on minimum return guarantees.
Minimum return guarantees may take three basic forms: (1) they can be based on financial market instruments, as where portfolio choices are circumscribed to fixed-income securities (in particular those indexed to consumer prices) or derivatives options contracts are subscribed; (2) they can be provided by third parties, such as an insurance company or the pension fund sponsor; (3) they can be based on a reserve fund (at the level of the individual fund or groups of funds) or on other forms of mutual risk transfer.12 The reserve funds, in particular, enable the financial results to be spread out over time: in years of high returns part of these are placed in the reserve fund, to be drawn on in years when the returns fall below a given threshold.
It must be stressed that these forms of protection always entail costs, unless the pension fund sponsor or another entity provides a subsidy. These costs may take the form of fees and premiums (for derivatives and insurance policies) or lower returns (when the accumulated amount is invested mainly in low-risk securities with intrinsically low returns or when the smoothing of returns over time penalizes some cohorts). If these lower net returns are not offset by higher contributions during the accumulation phase, they will result in smaller pensions. In other words, lower net returns always imply less consumption either during work life or in retirement or both.
Minimum return guarantees based on financial market instruments or on mutual assistance schemes have two major drawbacks. First, as mentioned, they may entail considerable costs. Second, and more important, they may not be able to insure against simultaneous, extreme, systemic shocks to a range of portfolio asset classes. In such adverse contingencies, it is very likely that the terms and conditions of the guarantees would be renegotiated.
These concerns are consistent with recent evidence on the functioning of minimum return guarantees. Turner and Rajnes (2009) analyze the cases of some pension funds in the United States13 and in some other countries during the last two major stock market declines (in 2000-2003 and 2007-2009). They find that guarantee schemes in which the minimum return is set at a low rate, such as return of principal, seem to be able to withstand adverse financial market conditions. The results differ somewhat for minimum return guarantees above the risk-free rate, which tend to be expensive and to be maintained through subsidies by the provider. Moreover, over the
11
See Turner and Rajnes (2001, 2003, 2009) and Pennacchi (2002).
12
The latter case is considered by Boeri, Bovenberg, Coeuré and Roberts (2006).
13
Funds sponsored by state governments (for instance, Indiana, Louisiana, Montana, Ohio and Oregon) or non-profit organizations.
last decade expensive minimum return guarantees have often been changed as required, possibly by lowering the minimum return, denying the guarantee to new members, going over to a flat rate guarantee, or eliminating the guarantee outright.
4. A public minimum return guarantee for defined contribution schemes
How can the government insure participants in a defined contribution pension scheme against financial market tail risks, i.e. against very large declines in financial asset prices that are very rare but that can drastically reduce the value of a worker’s accumulated pension fund assets? One way would be to provide a minimum return guarantee that protects future pensioners against any sharp curtailment of the amount accumulated. The minimum return should be set at a level that will (1) generate expenditure commitments for the government that can be financed from an ad hoc fund and that in any case are sustainable and (2) ensure each worker has an acceptable pension income in relation to the contributions paid in over his working life and his propensity to take investment risks.
One solution that appears reasonable is to make the guarantee compulsory and to offer DC plan members a set of options on the level of minimum return. Moreover, DC plan members should pay a risk-based premium for the guarantee, proportional to both the volatility of the portfolio and the level of minimum return.
Three reference choices for the minimum return are as follows: (i) a zero percent rate, which would ensure the return of contributions in nominal terms; (ii) the inflation rate, which would ensure the return of contributions in real terms; and (iii) the nominal growth rate of GDP. The latter choice resembles those adopted in the so-called notional pay-as-you-go public pension systems of some countries (for instance, Italy and Sweden).
In order to ensure the sustainability of the public insurance scheme, the guaranteed minimum return should not be greater than the nominal growth rate of GDP.14 Minimum returns lower than the nominal GDP growth rate would be feasible, as plan members might want to exchange lower levels of coverage for lower premia. Therefore, provided that plan members would pay risk-based premia for the guarantee, any level of minimum return between nil and the nominal GDP growth rate could be appropriate, depending on DC plan members’ willingness to bear investment risks. The rest of this section lays out how the government insurance programme would work.
The government would guarantee DC plan participants that upon retirement they would receive a final accumulated amount not lower than a “notional” amount given by the level that would have been reached if the contributions had been capitalized year by year at the guaranteed minimum return (e.g., the nominal growth rate of GDP):
T T
T G A W max , (1) 14In case of positive population growth, a minimum return equal to the growth rate of GDP per capita would likely ensure the stability of the long-run ratio between the total assets of pension schemes and GDP.
where WT is the final amount to which the pension fund participant is entitled at the
time of retirement and after T years of contribution, GT is the final amount of the notional fund and AT the final amount of the pension fund.
The final amount of the notional fund would be calculated as follows:
1 1 1 p p a e e i i e e e e e T cw g G (2)where T is the number of years of contribution, ep is the participant’s age at
retirement, ea is his age at the time of enrolment in the pension fund, e is his current age, ce is the percentage contribution rate, we is gross earnings and gi is the guaranteed minimum return in the year in which the participant was i years old.15
The final amount of the pension fund can be expressed as:
1 1 1 p p a e e i i e e e e e T c w A (3)where i is the average rate of return earned by the DC plan on its portfolio of financial assets when the participant was i years old.
The guarantee, therefore, gives prospective retirees the right to enter into a swap of notional funds for pension funds with the government. If the guarantee is exercised, it implies a net transfer of resources from the government to the prospective retiree equal to the difference between the final amount of the notional fund and that of the pension fund:
0 , 1 1 max 0 , max 1 1 1 p p p a e e i i e e i i e e e e e T T A c w g G . (4)In order to pay out this insurance cover, the Treasury could institute a special “guarantee fund”, which would finance the operation by running down reserves or by issuing government-guaranteed securities. The profits would come from the premiums paid by DC plan participants to cover the costs of the guarantee and from income on financial operations.
The transfer of resources from the guarantee fund to the prospective retiree could take two different forms, depending on whether or not there is a transfer of assets from the pension fund to the guarantee fund:16
15
As argued above, three possible levels of minimum return are nil, the inflation rate and the nominal GDP growth rate. The guarantee might also be applied to only a part of the contributions (for example, those paid by the worker or, in the Italian case, the severance pay provisions allocated to the pension fund).
16
The two streams of payments may be either settled separately or netted. If they are netted, only one party (in this case, the guarantee fund) makes a payment, the net of the two streams, to the other. See Chance (2003).
Figure 1
Stylized financial statements of the guarantee fund
for defined contribution pension schemes (1)
BALANCE SHEET
Assets Liabilities and net equity
financial assets government-guaranteed securities
(deficit) retained profits
(net loss for the year)
net profit for the year INCOME STATEMENT Expenses Revenues net outlays generated by swaps premiums paid by DC plan members interest expense interest, dividends and other proceeds
on proprietary securities valuation losses on proprietary securities valuation gains on proprietary securities net profit for the
year
(net loss for the year) (1) The items “deficit” and “net loss for the year” appear in parentheses to indicate that they are alternative to the items “retained profits” and “net profit for the year”, respectively.
- without transfer of assets, the guarantee fund only pays prospective retirees the difference between the final amounts of the notional funds and the pension funds (equation 4);
- with transfer of assets, the guarantee fund takes over the assets of prospective retirees (whose market value is given by equation 3) and pays them the full amount of their notional funds (equation 2); in this case the reserve fund has to finance much larger outlays and acquires the assets that the prospective retirees had accumulated with the pension funds.
In both cases, the stylized financial statements of the guarantee fund would be those presented in Figure 1. The income statement shows, under expenses, the net outlays generated by the swaps,17 interest payments on government securities and valuation losses on proprietary securities. Under revenues, it would show premiums paid by DC plan participants, income on financial operations and valuation gains on the securities portfolio.
The balance sheet shows the sources of financing of the fund. Payments to prospective retirees would be financed by running down reserves or by proceeds from issues of government-guaranteed securities. Profits would be generated by the
17
Net outlays are defined as the difference between the notional funds and the market value of the assets accumulated into the pension funds, regardless of whether the swap entails a transfer of assets or not.
build-up of premiums paid by pension plan participants benefiting from the guarantee and by investment of those premiums in financial assets, as well as by income and capital gains on the financial assets.18 An assessment of the level of the premiums that workers would have to pay is provided in Section 8.
5. Long-run growth in GDP and share prices: a comparison
For the sustainability of the guarantee fund, the most demanding option is a minimum return equal to the nominal growth rate of GDP. In that case, the public insurance scheme described above has two main factors of risk: the nominal growth rate of the economy and the returns of the financial markets. Before examining the advantages and costs of this form of guarantee for the workers, as well as the risks for the government, let us look at some empirical regularities in the relative performance of GDP and financial asset prices. Our analysis of portfolio returns focuses on equities, for which long time series are more available.
Some statistics on the long-run relation between GDP rates and equity returns are presented in Table 1. Panel (a) of the table considers data on the United States covering 80 years, from 1929 to 2008. For four long time horizons (10, 20, 30 and 40 years), the table shows the years in which the average growth rate of GDP was higher than the average rate of return on equities for at least one of the four horizons. The table highlights that, for long time horizons, the cases in which nominal GDP outpaces the stock index:
— are not very frequent. This happens in 20 of the 70 years for the 10-year horizon, 11 of 60 for the 20-year horizon and never for the 30- and 40-year horizons (for which 50 and 40 observations, respectively, are available);19
— are rarer, the longer the investment horizon;
— show some degree of persistence. In the 80 years examined, the cases in which the growth rate of GDP exceeds that of share prices are concentrated in two sub-periods: the years just after the Second World War and the 1970s-early 1980s.
Panel (b) of the table compares data for 10-year periods starting from 1970 for 15 countries. The main results are:
— the relative performance of GDP and equities shows marked similarity across countries. Almost everywhere the GDP growth rate exceeds that of equity prices in the 1970s, while the opposite occurs in the two subsequent decades;
— for the current decade, the data now available indicate that in all 15 countries the equity indices have gained less than GDP, owing to the collapse of the stock markets in 2008.
Broadly similar results (not reported) are obtained from a comparison of GDP growth with a portfolio consisting entirely of bonds and with a portfolio divided
18
Initially the fund’s reserves will be very low, because workers will have been paying premiums only for a short period. In case the guarantee is triggered, the fund will run a deficit. With the passage of time, outpayments of notional funds will presumably cease, and, thanks also to income and valuation gains on the financial assets acquired with the premiums paid by plan members or with swaps (if there is a transfer of assets), the guarantee fund would begin to show a profit and make good the deficits (since at a certain point it would also be able to begin set aside reserves).
19
As the time series begins in 1929, the rates of return on periods of 10, 20, 30 and 40 years are available starting from 1939, 1949, 1959 and 1969, respectively.
Table 1
A comparison of long-run growth rates in nominal GDP and equity indexes (1)
(excess of the growth rate of GDP over that of share prices, in percentage points and on an annual basis)
Panel (a): Years in which the long-run annual growth rate in nominal GDP exceeded that of the stock price index in the US between 1929 and 2008 (2)
Year 42 43 44 45 46 47 48 49 71 73 74 75 76 77 78 79 80 81 82 83 84 85 08 10-year growth rates 1.62 6.80 3.38 3.50 6.32 2.06 4.37 2.15 0.17 2.87 6.92 4.77 3.13 6.18 6.04 3.84 2.47 4.97 3.40 6.80 20-year growth rates 0.55 0.01 0.16 1.73 1.45 0.81 2.56 0.87 1.07 1.66 0.95
30-year growth rates 40-year growth rates
Panel (b): 15 advanced countries since 1970 (3)
Australia Belgium Canada Denmark France Germany Ireland Italy Japan Netherlands Spain Sweden Switzerland UK US
GDP [a] 1970-1979 13.0 10.4 12.6 11.7 12.6 7.9 17.6 17.0 12.3 10.7 17.9 11.0 6.2 14.9 9.6 1980-1989 11.0 6.4 8.6 7.9 9.1 4.9 11.3 13.6 6.1 4.2 12.3 9.9 5.6 9.7 7.6 1990-2000 5.0 4.2 4.5 4.3 3.5 4.2 10.2 5.7 2.0 5.4 7.2 4.9 2.9 5.6 5.3 2001-2007 7.1 4.1 5.1 3.8 3.9 2.3 8.5 3.7 0.4 4.4 7.3 4.4 3.0 5.2 4.9 2001-2008 7.3 3.9 5.0 3.7 3.8 2.4 7.2 3.5 0.1 4.4 6.9 4.2 3.1 4.9 4.7 1970-2000 9.6 6.9 8.4 7.9 8.2 5.6 12.9 11.8 6.5 6.7 12.2 8.4 4.8 9.9 7.6 1970-2008 9.1 6.3 7.6 7.0 7.3 4.9 11.7 10.0 5.2 6.2 11.1 7.5 4.5 8.8 7.0 Equity [b] 1970-1979 5.5 6.6 10.0 9.6 8.3 2.6 13.6 0.7 12.4 5.2 -0.4 6.9 2.5 11.7 6.7 1980-1989 16.9 19.9 11.7 23.6 22.3 16.8 22.5 25.5 20.5 19.6 28.2 30.7 10.4 22.3 16.1 1990-2000 10.7 10.2 10.0 10.0 12.1 9.9 14.2 10.3 -6.2 18.0 13.3 15.2 15.6 12.7 14.4 2001-2007 13.1 8.3 9.0 9.6 4.4 4.7 5.0 3.2 3.0 2.5 10.5 5.3 3.4 4.7 1.5 2001-2008 5.4 -2.7 3.0 0.2 -2.6 -2.1 -8.5 -4.8 -3.8 -7.3 3.5 -1.6 -2.1 -0.5 -4.7 1970-2000 10.8 12.0 10.5 14.0 14.0 9.5 16.4 11.4 7.8 14.0 12.7 17.0 9.4 15.2 12.3 1970-2008 9.7 8.8 8.9 11.0 10.4 7.0 10.8 7.9 5.3 9.3 10.7 12.9 6.9 11.8 8.6 GDP vs. equity [a-b] 1970-1979 7.5 3.8 2.6 2.1 4.3 5.3 4.0 16.3 -0.1 5.5 18.3 4.1 3.7 3.2 2.9 1980-1989 -5.9 -13.5 -3.1 -15.7 -13.2 -11.9 -11.2 -11.9 -14.4 -15.4 -15.9 -20.8 -4.8 -12.6 -8.5 1990-2000 -5.7 -6.0 -5.5 -5.7 -8.6 -5.7 -4.0 -4.6 8.2 -12.6 -6.1 -10.3 -12.7 -7.1 -9.1 2001-2007 -6.0 -4.2 -3.9 -5.8 -0.5 -2.4 3.5 0.5 -2.6 1.9 -3.2 -0.9 -0.4 0.4 3.4 2001-2008 1.9 6.7 2.0 3.5 6.4 4.5 15.6 8.3 4.0 11.7 3.4 5.8 5.2 5.3 9.4 1970-2000 -1.2 -5.1 -2.1 -6.1 -5.8 -3.9 -3.5 0.4 -1.3 -7.3 -0.5 -8.6 -4.6 -5.3 -4.7 1970-2008 -0.6 -2.5 -1.3 -4.0 -3.1 -2.1 0.9 2.1 -0.2 -3.1 0.3 -5.4 -2.5 -3.0 -1.6
Sources: Based on Bureau of Economic Analysis, Bloomberg, OECD.Stat (http://stats.oecd.org/Index.aspx), Thomson Financial Datastream, Shiller (2005) and Dimson, Marsh and Staunton (2002).
(1) Equity indexes all incorporate reinvested dividends. – (2) Dashed vertical lines mark discontinuities in the sequence of years. – (3) Equity returns are only available for 10-year periods starting from 1970. For Belgium, Canada, Germany, Ireland, Italy, Japan, Spain, Switzerland and the UK, GDP growth rates are available since 1971.
equally between equities and bonds (the comparison is limited to the three sub-periods 1970-79, 1980-89 and 1990-2000).
Summing up, this section provides some evidence on the risk that over long-term horizons financial market returns turn out to be lower than the nominal growth rate of GDP. On the basis of past experience and available statistics, that risk has two main characteristics: (i) it is relatively low and tends to diminish as the investment horizon lengthens; (ii) it is, however, also poorly diversifiable, as it is highly concentrated in time and tends to affect many geographical areas simultaneously.
6. The advantages for the worker of a government-guaranteed minimum return
In the insurance scheme presented in Section 4, the guarantee would be compulsory, but plan members could opt among different levels of minimum return, ranging from zero to the nominal GDP growth rate. Such a guarantee scheme would offer several advantages to DC plan members.
In the first place, the contributions of each member during his working life would be capitalized at a rate that is at least equal to the level consistent with the maximum amount of risk that the worker is willing to bear (e.g., a rate that provides a final balance not lower than cumulative contributions adjusted for consumer price inflation). In this sense, a noteworthy case is a minimum return equal to nominal GDP growth, where for amounts saved under the DC plan during the accumulation period workers would not be exposed to inflation shocks or real shocks affecting single industries or groups of workers and would also be sheltered from the risk of becoming poorer in relation to the rest of the economy. A nominal GDP guarantee would also provide cover against protracted periods of unsatisfactory financial market returns (like the 1940s or 1970s), when the diversification of investments over financial asset classes and geographical areas does not significantly reduce risks (see Section 5).
Second, for workers, DC plans with a government-guaranteed minimum return would be better than either mixed DB plans or DC plans with financial protection (see Sections 2 and 3, respectively). Compared with mixed DB plans, DC schemes with a guaranteed minimum return give members the chance to benefit when the financial markets are performing well. If, at the end of the savings period, the return on the pension fund is greater than the accumulated growth of nominal GDP, the worker has the right to the sum accrued in the pension fund, whereas mixed DB plans have a pre-determined capitalization rate for the contributions, and any surplus financial market returns go to the entities providing the guarantee.20 Compared with DC plans with investment risk protection based on financial market instruments or on mutual assistance schemes, a publicly guaranteed minimum return may be less costly and more effective in addressing extreme financial risks (see also Section 9).
Lastly, the guarantee scheme presented in this paper would have the advantage of maintaining a high degree of flexibility in DC retirement schemes, above all in
20
The asymmetry of returns received by members of DC plans with a guaranteed minimum return (i.e. the fact that they benefit from positive trends in the financial markets without being exposed to the risk of falling asset prices) creates the risk of opportunistic behaviour by DC plan members. This is discussed in the next section.
terms of differentiating accumulation plans according to members’ risk preferences and to different options for disbursing pension benefits.21
It must be made very clear that all these advantages would not be free. As we mentioned in Section 4, workers should pay a fee that takes account both of the riskiness of the portfolio and of the level of the minimum return (for an estimate of the market value of such a fee, see Section 8). This implies that the advantage of a public minimum return guarantee for defined contribution pension scheme members depends critically on the broader retirement system, and specifically on the relative size of defined contribution schemes within that system, the riskiness of the other components, whether enrollment in private DC schemes is mandatory or voluntary, and the standards of pension fund investment regulation. Therefore, possible applications of the guarantee scheme set out in this paper would have to be adapted to the specific characteristics of the arrangements applying in any one jurisdiction. It should also be pointed out that the variability of the cost of the guarantee implies that the guarantees that are more valuable are also those less affordable for low-income workers.
It is also worth noting that the guarantee would only apply to the accumulation phase, leaving open the question of how to deal with longevity and other risks and ensure that retirement wealth is properly decumulated.22 In order to shield workers from investment and longevity risks during the payout phase, the minimum return guarantee should be combined with other options, such as postponing retirement or purchasing deferred annuities.
The guarantee might apply to both mandatory and voluntary DC pension schemes. Workers who voluntarily join a DC pension scheme and have a high propensity to take financial risks might always choose the 0 percent minimum return guarantee, in order to keep insurance premia as low as possible.
Another issue relates to the length of the contribution period. Since the latter is not known in advance, at least in voluntary systems, it could be possible to introduce a default length of the guarantee depending on the age of the worker at enrolment. That should be coupled with an additional charge if the worker exits earlier or a rebate if he remains in the fund longer.
Finally, the introduction of a compulsory choice among different levels of guaranteed minimum return might add a further layer of complexity to decisions about retirement, which typically turn out to be very difficult for workers. This fact might call for the introduction of a default option in the guarantee scheme. Any default option for the guarantee should be coordinated with possible default options for the portfolio. If there is no default option for the portfolio, the default guarantee could be a guarantee of repayment of contributions paid in in real terms (e.g., a 2.5 per cent guarantee). If there is a default option for the investment line, the default guarantee would depend on the latter. If the default portfolio were very low-risk, then
21
This insurance scheme may be compared to the innovative retirement system proposed by Kotlikoff (2008). Kotlikoff advocates replacing mixed retirement systems (including public and private pensions) with a personal account system characterized by: (1) compulsory contributions (with government matching contributions for the poor); (2) compulsory annuitization in real terms at retirement; (3) collective investment in a global, market-weighted index fund of stocks and bonds, subject to a guarantee of at least a zero real return on one's cumulative contributions.
22
On these issues see, e.g., Fornero and Luciano (2004), Visco (2007, 2009) and Guazzarotti and Tommasino (2008).
the default guarantee should be the 0 percent rate. If the default portfolio were a balanced portfolio, the default level of the guaranteed minimum return could be higher.
7. The risks of a guarantee fund
A guarantee fund exposes the government to two risks in particular: the uncertain sustainability of the insurance scheme and the possibility of opportunistic behaviour by the insured. Specific problems also arise in relation to the transition period and the governance of the guarantee fund. The discussion that follows focuses on a minimum return equal to the nominal growth rate of GDP, which implies the largest expected outlays for the guarantee fund.
SUSTAINABILITY OF THE GOVERNMENT GUARANTEE SCHEME. As regards the sustainability of the insurance scheme,23 the first risk factor is financial market trends: the greater the volatility of the return on the pension fund portfolio, the greater the likelihood that the guarantee will be triggered and the greater the government’s potential outlay. The second risk factor is the rate of GDP growth, which has direct and indirect effects working through the growth in gross earnings. The higher the rate of GDP growth, the higher the probability that the guarantee will be triggered and, in that case, the larger the net outlays of the guarantee fund.24
In order to assess the sustainability of the government guarantee scheme, it is worth observing that, in the long term, the returns on financial assets tend to be at least equal to the nominal rate of growth of the economy (see the evidence in Section 5). Moreover, as a government-backed entity, the guarantee fund would be able to finance the swaps with prospective retirees by issuing very long-term bonds at low interest rates.
A broad indication of how long it takes for the guarantee fund to recover the net outlays originated by the swaps can be gained from long time series on the United States. As we saw in Panel (a) of Table 1 in Section 5, over the period 1929-2008 there were some years in which, for accumulation periods of 10 and 20 years, nominal GDP outpaced the stock market. Those years are considered in Figure 2, which shows, for each of the two investment horizons, the distribution of the number of years it took for the share price index to regain the level of nominal GDP after the swap was executed.25 The estimated recovery periods do not exceed 6 and 3 years for the 10- and 20-year horizons, respectively. If one also takes into account possible funding costs incurred by the guarantee fund (proxied by the annual nominal growth
23
The guarantee fund’s outlay produced by the swap with pension fund members would be positively correlated with three variables (see equation 4 above): (i) the rate of GDP growth; (ii) gross earnings; and (iii) the percentage contribution rate. It would be negatively correlated with: (iv) the return on the DC plan. In the event the swaps were to be funded by issuing state-backed securities, the overall cost of the guarantee would also be affected by the rate of interest on these securities.
24
The size of the outlays is also affected by the contribution rates: even a variation of just a few tenths of a percentage point may have a significant impact, if applied to the entire amount of annual earnings.
25
The indicator shown in Figure 2 does not take into account contributions, which have an impact on the time to recovery, while it does take into account very few cases of a second drop of the share price index below the value of the guarantee. With respect to the cases shown in Panel (a) of Table 1, the left-hand panel of Figure 2 does not include 2008, for which post-shock returns are not yet available.
Figure 2
Indicator of the time to recover net outlays of swaps (1)
Swaps at the end of a 10-year accumulation period Swaps at the end of a 20-year accumulation period
0 1 2 3 4 5 6 7 1 2 3 4 5 6 7 8 9 10 11 12 13 14
years from swap
num ber of case s 0 1 2 3 4 5 6 1 2 3 4 5 6 7
years from swap
num ber of case s 0 2 4 6 1 2 3 4 5 6 7
recovery of the net outlay that had to be funded when the swap was executed
recovery of the net outlay, if the latter is capitalized year by year at the nominal growth rate in GDP
Sources: Based on Bureau of Economic Analysis and Bloomberg data.
(1) Data refer to the United States and cover 80 years, from 1929 to 2008. The two panels relate to 10-year or 20-year accumulation periods and show the distribution of the number of years after the swap in which the share price index was below the value it should have had in order for the guarantee not to be exercised. Two different hypotheses are made on the amount that has to be recovered: only the net outlay at the time of the swap and the net outlay capitalized year by year at the nominal growth rate of GDP.
rate of GDP), the recovery period naturally lengthens, reaching a maximum of 14 and 7 years for the 10- and 20-year horizons, respectively.26
The indicator reported in Figure 2 suggests that the time that is necessary to recover the net outlays of the swap is quite variable: it may be as short as one year, but it may also be as long as three years or more. This variability is a very serious risk for workers nearing retirement age, who may not be able or willing to postpone retirement for an indefinite number of years. But that uncertainty could be quite easily managed by the public guarantee fund, which would be a government-backed intermediary with a long-term investment horizon and able to issue very long-term bonds economically.
It will be helpful to estimate the outlays that the guarantee fund would have sustained over the last two decades if an insurance scheme of the kind proposed in this paper had been in place. The last two decades represent a tough test for such a fund. As shown in Section 5, in 2008 the financial crisis made nominal GDP outpace equity indexes over long-term investment horizons for the first time since the early eighties. Another period of dismal performance of stock markets in all advanced economies was right at the turn of the century, due to the bursting of the high-tech bubble. The last two decades also cover the most challenging test one can think of, that of the Japanese stock market. Since the major crash that occurred in 1990, share price indices in Japan have not yet fully recovered their end-1989 level and even in the middle of ’00s (before the last crisis) they were still considerably lower than that level.
26
If funding costs are proxied by the interest rate on long-term US government bonds (data drawn from Shiller, 2005), the maximum length of the recovery period is equal to 9 and 8 years for the 10- and 20-year horizons, respectively.
Figure 3 shows some estimates of the maximum outlays of the guarantee fund for the United States and Japan (Appendix A details the assumptions underlying the calculations), positing that the guarantee fund settles the net amount due in cash (equation 4), with no transfer of assets. The calculations provide an upper bound, as they are based on an extremely unfavourable hypothesis: all workers who retired in a given year had enrolled into a DC pension plan fully invested in equities and had made the worst choice as to the year of enrolment. For instance, with the benefit of hindsight, for a US worker who retired in 2008 the worst choice would have been to join a DC plan in 1996 and keep the money invested in an equity portfolio throughout the 13-year accumulation period. Figure 3 shows that if all US workers retiring in 2008 had made that choice, the estimated outlay for the guarantee fund would have amounted to 0.4-0.5 percent of 2009 GDP. For Japanese workers retiring in 2008 the worst choice would have been to join a DC plan in 1983 and hold a domestic equity portfolio for 26 years. If all Japanese workers retiring in 2008 had made that choice, in that year the guarantee fund would have transferred to prospective retirees a net amount of resources equal to about 0.7 percent of 2009 GDP. Note that these estimates assume that each year all prospective retirees were enrolled in a DC pension plan. This is an extreme assumption. In the United States, for instance, in 2008 only one senior worker out of two was enrolled in a DC plan (either occupational or individual; see Copeland, 2008).
Overall, the estimates reported in Figure 3 indicate that in worst-case scenarios the annual swap outlays of the guarantee fund might be as high as 0.7 percent of GDP. Figure 3 also shows an estimate of the cumulative annual interest expenses of the guarantee fund had it funded the maximum swap outlays by issuing 10-year government-backed bonds. Over the last two decades, the overall interest expenses would have amounted to 0.05 percent of the 2009 GDP in Japan and 0.03 percent in the United States.
The calculations shown in Figure 3 indicate that the swap outlays of the guarantee fund would likely be concentrated during periods of cyclical downturns and prolonged decline in stock market indices. This highlights the importance of prefunding the swaps by accumulating reserves. Prefunding would also shield the insurance scheme from political pressures.
If there were also a transfer of assets from the pension schemes to the guarantee fund, the swap outlays would be much larger and the guarantee fund would likely have higher leverage, i.e. a higher level of debt for given reserves. Higher leverage might allow the guarantee fund to more quickly recoup swap outlays. On the other hand, the transfer of assets would make the management of the swaps more complex and would increase both the solvency risk of the guarantee fund and other possible disadvantages entailed by size (e.g., the risk of suggestions to use reserves for purposes different from that of providing the guarantee).
In any case, the guarantee fund’s size compared with the size of the main investment markets should be monitored to make sure that financial asset prices are not excessively influenced by the fund’s portfolio choices. Figure 4 compares the total assets of pension funds with the size of the domestic bond and equity markets in three countries where retirement saving schemes have long been developed. While it would be necessary to take into account the geographical diversification of pension fund holdings, this simple comparison suggests that the guarantee fund may get large enough to have a substantial price impact on some financial assets.
Figure 3
Estimate of the maximum outlays of the guarantee fund for the United States
and Japan if the minimum return guarantee scheme had been in place (1)
(as a percent of the GDP of the following year)
United States Japan
0.0 0.1 0.2 0.3 0.4 0.5 1990199119921993199419951996199719981999200020012002200320042005200620072008
outlays interest expenses
1 990 - 1 year 1996 - 13 years 1 994 - 1 year 1999 - 2 year s 1999 - 3 y ear s 19 97 - 6 year s 1998 - 6 year s 1998 - 7 y ear s 1998 - 8 y ear s 0.0 0.1 0.2 0.3 0.4 0.5 0.6 0.7 0.8 198219831984198519861987198819891990199119921993199419951996199719981999200020012002200320042005200620072008
outlays interest expenses
1987 - 4 y ear s 1987 - 5 y ear s 19 85 - 8 year s 1986 - 8 year s 1987 - 8 year s 1987 - 9 year s 1986 - 11 y ear s 1984 - 1 4 y ear s 1984 - 15 y ear s 1 996 - 5 y ear s 1984 - 18 y ear s 1982 - 21 years 1984 - 20 year s 1985 - 20 y ear s 1983 - 26 years
Sources: Based on national data and Bloomberg, OECD, Shiller (2005) and Thomson Datastream data.
(1) For each country, estimate of the maximum annual outlays (and cumulated interest expenses) of the guarantee fund had the minimum return guarantee scheme been in place (as a percent of the GDP of the year following the one shown on the horizontal axis). It is assumed that the guarantee fund settles the net amount due in cash with no transfer of assets. The maximum outlays are estimated under the extremely unfavourable assumption that, in each year, all workers who retired in that year: (i) had previously joined a DC pension plan, kept their balances invested in 100 percent domestic equity portfolios and opted for a nominal GDP guarantee; (ii) had all joined the plans in the worst year in terms of the return of the stock market index relative to nominal GDP over the accumulation period. For each year in which there are outlays of the guarantee fund, the graph also reports the hypothetical year in which that cohort of new retirees joined the plans and the length of the accumulation period in years. The annual contribution rate is set equal to 12 percent and the annual number of new retirees is estimated on the basis of the number of workers who were 60-64 years old. Due to data availability, the counterfactual analysis is carried out for any possible accumulation period starting from the early nineties for the United States and the early eighties for Japan. For a description of the data, see Appendix A.
THE TRANSITION PERIOD. The countercyclicality of swap net outlays calls for special attention during the transition period. It would be better to limit the size of interventions until the guarantee fund had built up a certain level of reserves. That could be done by establishing that the guarantee only applies to accumulation periods longer than a certain number of years (say, fifteen), to be shortened gradually as premia accrue. The time of activation of the guarantee might also be varied depending on the riskiness of the portfolio and the level of the guarantee.
RISKS OF OPPORTUNISTIC BEHAVIOUR BY THE INSURED OR THE ASSET MANAGER. The existence of a government-guaranteed minimum return could encourage DC plan members to over-expose themselves to financial risks. This risk could be a significant one especially for workers who, as they near retirement, are dissatisfied with the results achieved by their pension fund. A return guarantee might also affect the incentives of portfolio managers. Opportunistic portfolio choices could be discouraged in several ways. First, the guarantee scheme should be made compulsory, especially if members have to pay regular premiums. Second, the guarantee might be applied only if the period of participation in the DC scheme is longer than some threshold duration (say, ten years). These two conditions would reduce adverse selection effects. Third, a ceiling on the percentage of risky securities in a pension fund’s portfolio could be set. Fourth, the allocation of securities within a portfolio
Figure 4
Pension fund holdings compared with the size of domestic market, 2005
(pension fund total assets/market capitalization)
0 0.2 0.4 0.6 0.8 1 1.2 1.4 1.6 1.8
Switzerland United Kingdom United States
PF total assets/equity market size PF total assets/bond market size
could be required to have an individual “life cycle”; that is, as retirement approaches, the portfolio would be redistributed away from risky securities to safer assets (e.g. from shares to government securities). Fifth, other prudential criteria could be tightened, such as those meant to ensure the diversification of risk within the portfolio and the quality of eligible portfolio assets. Finally, following Lachance and Mitchell (2003a, 2003b), the minimum return guarantee could be applied to a predefined standard portfolio (e.g. monetary, balanced, growth), rather than to the portfolio actually held by the prospective retiree. In brief, risks of opportunistic behaviour by DC plan members or portfolio managers could be mitigated by sound regulation of workers’ options and pension fund investments.
MANAGEMENT OF THE GUARANTEE FUND. Specific problems concerning the government guarantee fund could arise from the management of the financial assets portfolio. A solution could be to entrust the management to specialized intermediaries, appointed under transparent and competitive procedures. The investment objective could be a long-term return at least equal to that on government securities (or the rate guaranteed with the swap), plus a spread of one or two percentage points in order to recoup the net outlays entailed in the swap. Voting rights at the meetings of shareholders of listed companies should be adequately regulated. In brief, the guarantee fund should put in place governance mechanisms and investment controls to ensure sound management and better insulate both governance and asset management from undue political influence. A way to achieve this would be to follow the international best practices that have been identified by the OECD and other bodies for public pension reserve funds (Yermo, 2008).
8. An assessment of the premium payable by the pension scheme members
The final amount to which the member is entitled at the time of retirement (equation 1) can be rewritten as:
,0
max T T
T
T A G A
The second term on the right-hand side of equation (5) is the payment generated by a put option whose strike price is GT. Consequently, at retirement the worker is entitled to the amount accumulated with the pension fund (AT),
supplemented by the payment generated by the put option. In each year t the worker holds the portfolio of financial assets accumulated with the pension fund up to that time (At) and the European put option offered to him by the government. Denoting
the value of the option at time t by ft, the total value of the position accrued by the
member at that date is:
t t
t A f
W . (6)
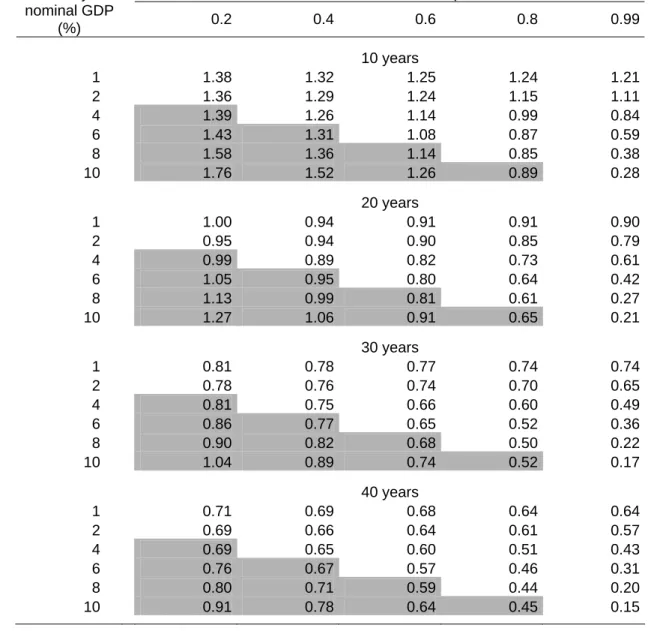
Option value theory makes it possible to determine the price ft of this option. Table 2
shows the results obtained with this purely financial approach.27 To take proper account of the possibility of large drops in share prices, these are assumed to follow a jump-diffusion process. Moreover, the parameters of the process, which we take from Di Cesare (2005), are inferred from option prices over a period of high stock market volatility.28 In this way we guard against the risk of underestimating the costs of the nominal GDP guarantee. The cost estimates shown in Table 2 should provide an upper bound on the market value of the guarantee, based on historical data on option prices.
Three different types of guarantee are considered in the simulations: two of them guarantee the repayment of the contributions paid in, in nominal and real terms (minimum rates of return of 0 and 2.5 percent respectively).29 The third type of guarantee is that discussed in Section 4, in which the minimum rate of return of the pension fund is not predetermined but put equal to the nominal GDP growth rate in each year.30 As regards the riskiness of the portfolio, four investment strategies are considered: (i) 100% equities; (ii) 50% equities and 50% government securities; (iii) 100% government securities; and (iv) a simple life-cycle strategy, under which the portfolio is initially invested 100% in equities and then, in the last ten years of the accumulation period, gradually shifts, on a linear basis, into government securities
27
The fair value of the option is based on risk-neutral valuation. The methodology, and the underlying hypotheses, are presented in Appendix B. The solution can be obtained numerically, as the use of closed formulas à la Black and Scholes is hindered by the presence of periodic investments (see, for example, Zurita, 1994, and Pennacchi, 1999). For a thorough analysis of the main determinants of the cost of guaranteeing a minimum rate of return for a pension fund, see Lachance and Mitchell (2003a, 2003b).
28
The jump-diffusion process is driven by three parameters: continuous volatility, the expected number of jumps per year, and the average jump size (see Appendix B). They are based on the prices of the options on S&P 500 futures contracts listed on the Chicago Mercantile Exchange (Di Cesare, 2005). The estimation period runs from August 2000 to July 2002 and is characterized by quite high share price volatility, associated with the collapse of the high-tech bubble, a recession, 9/11, and accounting frauds.
29
In regimes of low inflation a rate of return of 2.5 percent is sufficient to ensure repayment of the principal in real terms.
30
It is important to note that, owing to the assumption of risk neutral valuation required to determine the price of the option, for all the risky assets, including nominal GDP, the rate of return expected by investors coincides with the risk-free interest rate. This means that no assumption is ever made in the simulations regarding the equity premium, the term premium or expected nominal GDP growth. On the other hand, the assumptions regarding the volatilities of the various stochastic processes considered and their correlations are of crucial importance.
Table 2
Cost Estimates of Minimum Return Guarantees for Defined Contribution Pension Schemes (1) Panel (a): annual charges as a percentage of total assets
Years with Individual Account Minimum Rate of Return 0 percent
(i.e. return of the principal)
2.5 percent
(i.e. about long-run inflation)
Yearly nominal GDP growth rate (2) I. Portfolio invested 100% in equities
with jumps (3) without jumps (3)
10 1.47 2.39 3.04 2.57
20 0.68 1.46 2.14 1.82
30 0.41 1.07 1.77 1.48
40 0.26 0.83 1.54 1.27
II. Portfolio invested 50% in equities and 50% in 10-year Treasury bonds
10 0.35 0.97 1.54
20 0.11 0.54 1.13
30 0.05 0.37 0.95
40 0.02 0.26 0.81
III. Portfolio invested 100% in 10-year Treasury bonds
10 0.00 0.00 0.44
20 0.00 0.00 0.32
30 0.00 0.00 0.27
40 0.00 0.00 0.23
IV. Life-cycle investing (4)
10 0.08 0.52 0.93
20 0.09 0.56 1.24
30 0.10 0.59 1.22
40 0.03 0.34 1.20
Source: Authors’ calculations (see Appendix B).
(1) Estimate of the cost of a European put option with the maturity shown in the first column. Estimates are based on Monte Carlo simulations (10,000 trials) and are carried out for four different portfolios. As for the definition of minimum return, three different formulas are considered: two fixed-rate guarantees (0 and 2.5 percent per annum) and a guarantee yielding the nominal GDP growth rate each year. The methodology and underlying hypotheses are presented in Appendix B. - (2) The volatility of the nominal GDP growth rate is set equal to 2 percent per annum; the correlation between the GDP growth rate and stock returns is set equal to 0.4. – (3) For the case of a nominal GDP guarantee on a portfolio invested all in equity, the table also shows the cost of the guarantee if share prices do not follow a jump process. – (4) The portfolio is initially invested in equities and then linearly switches into bonds in the 10 years prior to retirement.
Table 2 (cont.)
Cost Estimates of Minimum Return Guarantees for Defined Contribution Pension Schemes (1) Panel (b): annual charges as a percentage of lifetime contributions
Years with Individual Account Minimum Rate of Return 0 percent
(i.e. return of the principal)
2.5 percent
(i.e. about long-run inflation)
Yearly nominal GDP growth rate (2) I. Portfolio invested 100% in equities
10 11.40 18.48 23.49
20 9.04 19.25 28.30
30 7.69 19.98 33.12
40 6.39 20.05 37.17
II. Portfolio invested 50% in equities and 50% in 10-year Treasury bonds
10 2.68 7.42 11.81
20 1.45 7.12 14.74
30 0.84 6.83 17.45
40 0.48 6.22 19.27
III. Portfolio invested 100% in 10-year Treasury bonds
10 0.00 0.00 3.33
20 0.00 0.00 4.12
30 0.00 0.00 4.89
40 0.00 0.00 5.53
IV. Life-cycle investing (3)
10 1.89 12.37 28.71
20 1.77 10.40 22.85
30 1.34 7.76 16.26
40 0.22 2.65 7.16
Source: Authors’ calculations (see Appendix B).
(1) Estimate of the cost of a European put option with the maturity shown in the first column. Estimates are based on Monte Carlo simulations (10,000 trials) and are carried out for four different portfolios. As for the definition of minimum return, three different formulas are considered: two fixed-rate guarantees (0 and 2.5 percent per annum) and a guarantee yielding the nominal GDP growth rate each year. The methodology and underlying hypotheses are presented in Appendix B. - (2) The volatility of the nominal GDP growth rate is set equal to 2 percent per annum; the correlation between the GDP growth rate and stock returns is set equal to 0.4. – (3) The portfolio is initially invested in equities and then linearly switches into bonds in the 10 years prior to retirement.
until, at the time of retirement, the equity share is nil.31 Lastly, four different investment durations are considered (10, 20, 30 and 40 years). GDP volatility is taken to be 2 percent, while the correlation between GDP and the pension fund portfolio is assumed to be 0.4.32 The cost of the option is calculated on an annual basis and both as a percentage of the assets under management (Panel a of Table 2) and as a percentage of lifetime contributions (Panel b). The second measure provides an indication of the affordability of the guarantee, in terms of its incidence on DC plan members’ disposable income.
The estimates show that the type of guarantee provided has a substantial effect on the cost of the option. If we consider a 40-year accumulation period and a balanced portfolio divided equally between equities and 10-year government bonds, the cost of the option is very low if the option guarantees only the repayment of the contributions paid in; it rises to 0.26 percent of assets under management (6.22 percent of contributions) when the option guarantees an annual nominal rate of return of 2.5 percent and 0.81 percent (19.27 percent) when it guarantees the nominal GDP growth rate.
Another factor that has a considerable influence on the cost of the option (measured in terms of assets or contributions) is the volatility of the portfolio. If the portfolio is fully invested in equities, even just guaranteeing repayment of the contributions paid in requires, over a 40-year time horizon, an annual premium equal to 0.26 percent of the assets under management, which rises to 1.54 percent if the strike price of the option is linked to the GDP growth rate (6.39 and 37.17 percent, respectively, in terms of contributions). Conversely, the cost of the option falls drastically if the percentage of equities in the portfolio is reduced to zero; it is nil in the case of repayment of the capital paid in (in nominal and real terms), and even where the amount guaranteed is linked to the nominal GDP growth rate it is still barely above 0.20 percent of total assets (5.53 percent of contributions). A life-cycle strategy tends to be less expensive (in terms of total assets) than the balanced strategy (50% equities and 50% securities) for the 10-year maturity and more expensive for the longer durations (because of the larger weight of the period in which the portfolio is fully invested in equities).
The presence of jumps in share prices implies quite a sizable increase in the cost of the guarantee, although its incidence tends to diminish as the accumulation period lengthens. This is shown in the last column of Table 2.a. For a portfolio fully invested in equities, the annual surcharge due to expected jumps in share prices is about 0.4 percent of assets under management for a 10-year time horizon and 0.2 percent for longer horizons.
Another variable that has a significant influence on the value of the guarantee is the duration of the accumulation period. If costs are measured as a percentage of assets under management, the option becomes less expensive as the investment horizon lengthens; the relation is markedly non-linear for relatively short retirement
31
The example of life-cycle investing is taken from Blake, Cairns and Dowd (2008).
32
The historical data on nominal GDP provide estimates of its volatility that are very low. On the basis of quarterly data for the United States covering the period from 1988:Q1 to 2008:Q4, it can be estimated that the volatility of nominal GDP is of the order of 1 percent on an annual basis. The correlation between nominal GDP and the S&P 500 index (with dividends reinvested) would not exceed 0.4.