Abstract
A variety of Internet traffic characterization and source models already exist. Since the origin of the analyzed data differs, a comparison of the reported traffic characteristics is difficult. In this paper, we analyze an IP packet trace and relate the trace data to the user access speed recorded at the same time. The obtained characteristics are contrasted with a second data set measured within an ADSL field trial. This second data set represents a limit in Internet usage, since, the high speed access was provided free of charge. This comparison leads to some inter-esting insights showing whether and how the access speed influences the Internet user behav-ior and thus the generated source traffic. The derived Internet traffic characterization is a first step to a generalized parametric Internet traffic model.
University of Würzburg
Institute of Computer Science
Research Report Series
The Dependence of Internet User
Traffic Characteristics on Access Speed
Norbert Vicari*, Stefan Köhler*
and Joachim Charzinski°
*Department of Distributed Systems, University of Würzburg, Am Hubland, D-97074 Würzburg, Germany Tel.: +49 931 888 6652 Fax. +49 931 888 6632 vicari|[email protected]
°Siemens AG, ICN M RP 11, Hofmannstr. 51, D-81359 München, Germany
Tel. +49 89 722 46803 Fax. +49 89 722 26877 [email protected]
1 Introduction
Today the Internet covers and integrates many different applications. In the next few years not only best-effort data traffic, but also time-critical applications demanding QoS as well as rate guarantees for data traffic will have to be supported. For dimensioning of networks, access routers and development of new QoS mechanisms more accurate and realistic source models of Internet user traffic are required. Many studies deal with backbone Internet traffic character-ization, revealing interesting facets like Long-Range Dependence or multi-fractal behavior [1, 2, 3, 4, 5]. Since these models are based on a traffic stream consisting on many superimposed traffic sources, scaling is a demanding task.
As the variety of applications for traffic models increases, e.g. with different access speeds and new technologies, also the diversity of models themselves increases. Thus, generalized para-metric source models for Internet traffic are a fundamental prerequisite for the success of future dimensioning and planning tasks.
Generalized parametric source models could be derived from client-based Internet traffic traces. But it is not clear, how to compare different models, e.g. [6, 7, 9], since the traces are based on different network topologies and measurement setups. One step towards a general-ized model would be to compare the statistics of users accessing the Internet with different modem speeds by evaluating a single trace.
The key for obtaining packet level characteristics of IP traffic which can be related to the access speed is a parallel measurement of the session logfile of a dial-in router and the packet trace measured on the connection between the dial-in router and the Internet.
Internet user behavior and traffic generation is influenced not only by technical aspects, that is, access speed, but also by environmental aspects, that is, charging and availability. Thus we contrast the first data set with a second measurement, representing “unlimited” Internet access with respect to data rate, availability and charging.
The paper is organized as follows: In the next Section the measurement configuration of the analyzed data sets is described. Section 3 gives the characteristic of the session behavior and Section 4 describes the characteristics of the TCP (HTTP) connections. Section 5 concludes the paper.
2 Measurement Settings and Trace Descriptions
The first measurement was done during 2 weeks in February and March 1999 in the computing center of the University of Würzburg. About 6000 students and staff members are subscribed to the in Internet access of the university. The access is implemented by three Ascend dial-in routers, enabldial-ing simultaneously 240 access ldial-ines. All ldial-ines facilitate digital ISDN access at 64kbps, while 192 lines also facilitate analog modem access at speeds up to 56kbps. The dial-in routers are connected by a 10Mbps ethernet bus to the German Research Network (DFN) and the Internet.
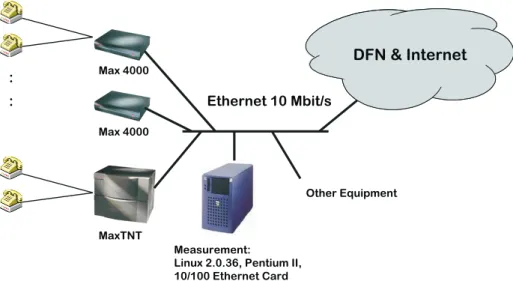
Figure 1 depicts the measurement configuration. Basic access data were logged by the routers, mainly the session start time, session duration, negotiated up- and downlink speed, data vol-ume and the dynamically assigned IP address. In order to ensure privacy, all records allowing conclusions to single users were deleted from the logfile.
To obtain detailed information of the user behavior, a sniffer measurement with the tool TCP-Dump [11] running on a Linux PC was made. All IP packet headers to and from the dial-in routers were logged. The analysis of this trace was performed with the help of several perl
scripts and the tool TCPTrace [12]. The IP and TCP (if applicable) header information contains among others the time stamp, source- and destination address including port number and the protocol used (TCP, UDP,...).
Aligning the router logfile and the TCPDump trace allows to securely discern sessions, even in the case of fast IP address reuse. All traffic characteristics contained in a packet trace could be related to the dial-in speed of the modem used.
During the measurement period approximately 62000 sessions were logged, the total data vol-ume sums up to 82 GB. Figure 2 shows on the left side the number of users during the mea-surement period. A periodic usage pattern in dependence of the daytime is observed. On the right side of Figure 2 the user activity for 24 hours is depicted. Obviously the users adopt to the phone tariff of the German Telekom AG by increasing activity at 6 p.m and 9 p.m, that is, the starting time of cheaper phone tariffs.The identical user behavior was observed also in an 180 days measurement [10] at the University of Stuttgart, Germany in 1997.
The pie chart in Figure 3 shows the percentage of modem classes in the trace. The main part of the users access the internet with a speed of 28 kbps to 33.6 kbps. One third of the sessions are using connections with up to date technology, that is ISDN (64kbps) or 56 kbps modems. Note that the later class of modem connect asymmetrically, upstream with 33.6 kbps and down-stream - depending on the quality of the line - between 40 kbps and 56 kbps. Only 7% of the sessions stem from slow 9.6 kbps and 14.4 kbps modems. Since the characteristics of the
Figure 1: Measurement environment.
Max 4000
MaxTNT Max 4000
Ethernet 10 Mbit/s
Measurement:
Linux 2.0.36, Pentium II, 10/100 Ethernet Card Other Equipment : : DFN & Internet 0 4 8 12 16 20 24 0 10 20 30 40 50 60 MA X T N T U s a g e Wednesday, 24.2.99 Tariff-Limits
28 kbps, 31.3 kbps and 33.6 kbps connections do not differ significantly, we will integrate the data in a class denoted by 30 kbps modems.
The second trace was collected from May to December 1998 during an ADSL field trial. The PCs of 100 students were connected to the university’s backbone in Münster, Germany. The downstream rate was 2.5 Mbps and the upstream rate was configured to 384 kbps. The Internet service was provided completely free of charge and the computers were connected to the Inter-net permanently, that is, no dial-up procedure was required. The users were observed with a modified version of TCPDump on a 10 Mbps ethernet bus cyclically in 15 groups for one week. In total 14 million IP packet headers belonging to HTTP, covering 480000 TCP connec-tions, were collected. Since for this always-on lines no dial-up information could be collected, “sessions” were detected implicitly using an activity timeout of 20 minutes.
3 Session Characteristics
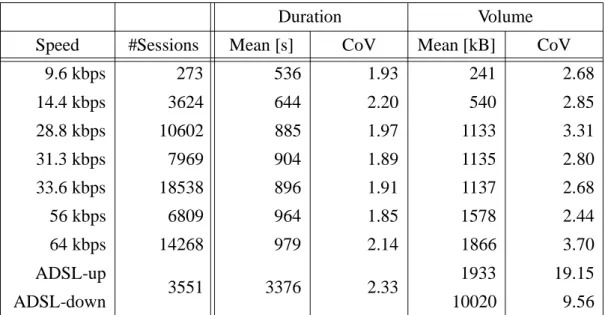
The session characterization stands on top of all hierachical modeling approaches. In the fol-lowing we will look at the distribution of the session duration and volume. Table 1 shows the average session volume and duration in dependence of the modem speed.
Duration Volume
Speed #Sessions Mean [s] CoV Mean [kB] CoV
9.6 kbps 273 536 1.93 241 2.68 14.4 kbps 3624 644 2.20 540 2.85 28.8 kbps 10602 885 1.97 1133 3.31 31.3 kbps 7969 904 1.89 1135 2.80 33.6 kbps 18538 896 1.91 1137 2.68 56 kbps 6809 964 1.85 1578 2.44 64 kbps 14268 979 2.14 1866 3.70 ADSL-up 3551 3376 2.33 1933 19.15 ADSL-down 10020 9.56
Table 1: Average and variation of session volume and duration. Figure 3: Percentage of modem classes in the measurement.
23% 11% 30% 13% 17% 6% < 1% 64kbps 56kbps 33.6kbps 31.2kbps 28.8kbps 14.4kbps 9.6kbps
While the average session duration of the dial-up modems increases only slightly with the access speed the data volume increases proportionally to the modem speed. The coefficient of variation (CoV) is nearly independent of the modem speed
The session duration of the ADSL connections is significantly larger than that of dial-up modems, which is originated from the free access. The data volume also increases, but less than expected by the access speedup and extended connection duration. The high bandwidth and session duration of ADSL connections causes also very high variations in the data volume transmitted in the sessions.
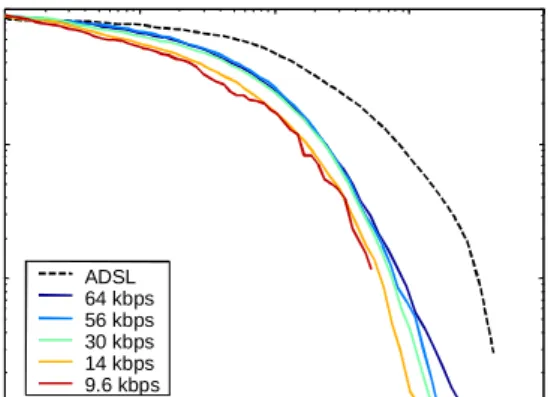
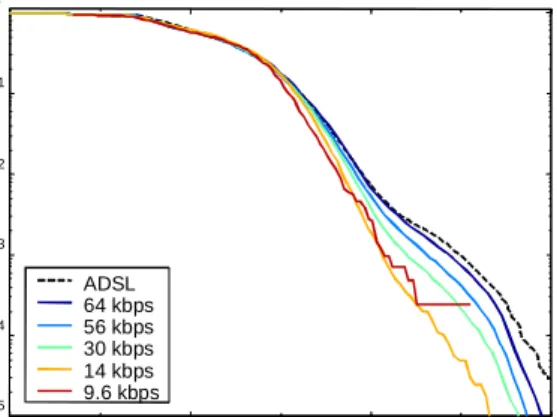
The session duration distribution is depicted in Figure 4. On the right hand side of the figure the complementary cumulative probability distribution function (CCPDF) shows in double logarithmic plotting that the shape of the distribution is identical for all modem speeds. On the left hand side the probability density function (PDF) shows two peeks, which initiates to sepa-rately characterize short sessions. While a first accumulation of dial-up sessions is observed at a duration of 60 seconds, the peak for ADSL connections is observed at 10 seconds. This is explained by the fact, that a simple check for e-mail could be done very quickly if no dial-in procedure is required, that is, for ADSL modems. About 30% of the sessions do not last longer than 100s.
Besides the session duration the data volume transferred is used for the characterization of ses-sions. The up- and downstream volume distribution is shown in Figure 5. For all modem
Figure 4: Session duration distribution.
10-1 100 101 102 103 104 105 0 0.02 0.04 0.06 0.08 0.1 0.12 session duration [s] PD F ADSL 64 kbps 56 kbps 30 kbps 14 kbps 101 102 103 104 105 10-3 10-2 10-1 100 session duration [s] CCP DF ADSL 64 kbps 56 kbps 30 kbps 14 kbps 9.6 kbps
Figure 5: Session up- and downstream volume distribution.
104 106 108 1010 10-4 10-3 10-2 10-1 100
downstream volume [bit]
CCP D F ADSL 64 kbps 56 kbps 30 kbps 14 kbps 9.6 kbps 104 106 108 1010 10-4 10-3 10-2 10-1 100
upstream volume [bit]
CCP D F ADSL 64 kbps 56 kbps 30 kbps 14 kbps 9.6 kbps
speeds - including ADSL connections - the curves exhibit a similar shape, while the data amount increases with the modem speed. The tail of the distributions decays linearly in double logarithmic representation, which may be an indication of the distributions being heavy-tailed. The ratio of down- and upstream session volume ranges from 4 to 7.
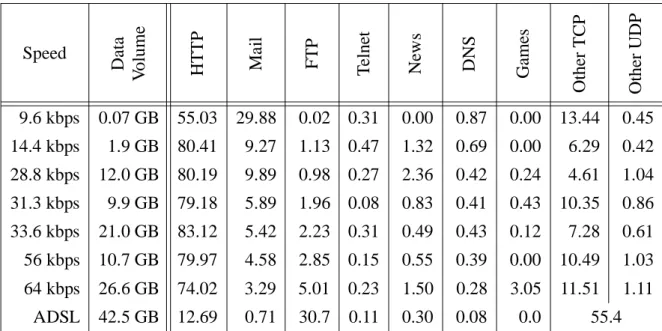
It can be observed that services (applications) used during a session influence strongly the behavior of the traffic-stream. E.g., in [8] two applications cause the complete correlation of an IP trace. Thus, we list the volume percentage of the services used in our measurement in Table 2. In the first trace, 80% of the traffic is caused by HTTP. Mail is the preferred application of users with slow 9.6kbps modems. The percentage of Mail reduces with increasing modem speed, while services like FTP or Games are utilized more often. About 10% of the TCP port numbers are used to rarely to show up in this statistic and/or could not be assigned to known services. Since the unidentified UDP port numbers take at most one percent of the traffic vol-ume, it could be assumed that the application Real Audio is yet not attractive to modem users. The second trace (ADSL) exhibits a completely different picture. The main part of the traffic is caused by FTP and a video on demand application (denoted in Table 2 as ’other TCP/UDP’). Part of the FTP traffic was also related to this video application, since the video server was partiallay maintained via FTP.
Speed Data V o lume HT T P Ma il FT P Te ln et New s DNS Games Other T CP Other UDP 9.6 kbps 0.07 GB 55.03 29.88 0.02 0.31 0.00 0.87 0.00 13.44 0.45 14.4 kbps 1.9 GB 80.41 9.27 1.13 0.47 1.32 0.69 0.00 6.29 0.42 28.8 kbps 12.0 GB 80.19 9.89 0.98 0.27 2.36 0.42 0.24 4.61 1.04 31.3 kbps 9.9 GB 79.18 5.89 1.96 0.08 0.83 0.41 0.43 10.35 0.86 33.6 kbps 21.0 GB 83.12 5.42 2.23 0.31 0.49 0.43 0.12 7.28 0.61 56 kbps 10.7 GB 79.97 4.58 2.85 0.15 0.55 0.39 0.00 10.49 1.03 64 kbps 26.6 GB 74.02 3.29 5.01 0.23 1.50 0.28 3.05 11.51 1.11 ADSL 42.5 GB 12.69 0.71 30.7 0.11 0.30 0.08 0.0 55.4 Table 2: Volume percentage of services.
Figure 6: Average data volume per service (HTTP, Mail, FTP) and session. HTTP Mail FTP Other 0 200 400 600 800 1000 1200 1400 1600 av er ag e data v ol ume per s e s s io n [k B ] service 9.6 kbps 14 kbps 30 kbps 56 kbps 64 kbps ADSL > 3000 > 6600
The statistic in Table 2 could be somewhat misleading, since one might think that ISDN users read less Mail than users with slower modems or ADSL users are surfing less than users with dial-up modems. Figure 6 shows the average data volume per session for the services HTTP, Mail, FTP, and other. While the data volume of HTTP and FTP increase with modem speed, the volume of Mail is independent of modem speed. The reason for this property is that with the exception of mailing lists, the usage of mail also implies to write and send mails. This lim-its the volume of mail independently of modem speed. As explained before, the high FTP and “other TCP/UDP” usage of ADSL users is related to additional offered services, that is, video on demand.
As indicated in Figure 4, around 30% of the sessions last less than 100s. Comparing the ser-vices used in these sessions with the average of all sessions the role of HTTP and Mail are found to be exchanged. Mail volume ranges from 80% to 50% in these short sessions. This results from the fact that users check mail or download mail and then read mail off-line. This could also imply the first peak in the session duration distribution.
4 TCP (HTTP) Connection Characteristics
Since 80% of the traced traffic volume of dial-in modems are HTTP-connections we concen-trate in the following on characteristics of HTTP-connections.As shown in Figure 2 the user activity changes in dependence of the daytime and the tariff structure of the German Telekom AG. Figure 7 depicts the TCP-connection data rate in upstream (left side) and downstream (right side) direction. The largest data rate for dial-in modems is obtained between midnight and 8 a.m, while the data rate of ADSL connections is reduced only during the local business hours. For dial-in modems, the obtained data rate does not increase during the maximum activ-ity period, even when the backbone load of the bearer DFN network [13] decreases in the evening. Nevertheless, the modem speed is reflected in the obtained data rate, but the gain for ADSL modems is less than expected by the 2.5 Mbps downstream rate. Further discrimination of the connection destinations in conjunction with a data rate analysis could give valuable hints for network bottleneck detection.
The TCP-connection volume distribution depicted in Figure 8 (left hand side) exhibits a simi-lar shape for all access speeds. Also the shape of the volume distribution in up- and down-stream direction is similar, showing a heavy tailed decay over four orders of magnitude. The downstream volume is about one order of magnitude larger than the upstream volume. The volume increases only slightly with the access speed.
Figure 7: TCP-connection data rate in dependence of daytime.
0 4 8 12 16 20 24 0 5 10 15 20 25 30 35 40 av er age dow ns tr eam d a ta ra te [k bps ] daytime [h] 9.6 kbps 14 kbps 30 kbps 56 kbps 64 kbps ADSL 0 4 8 12 16 20 24 0 1 2 3 4 5 6 7 8 9 10 av er a g e ups tr eam data ra te [k bps ] daytime [h] 9.6 kbps 14 kbps 30 kbps 56 kbps 64 kbps ADSL
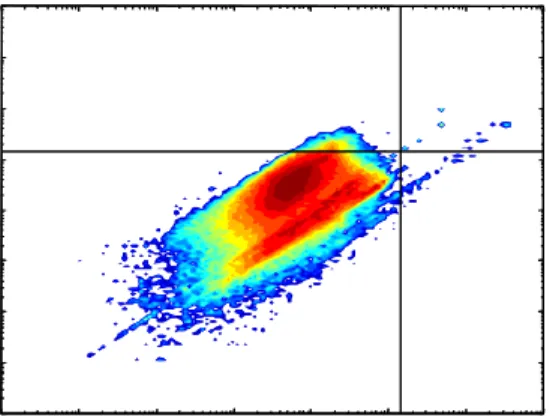
The shape of the data rate distributions, as plotted in Figure 9 is independent of the access speed but differs for up- and downstream direction. In general the downstream rate is one order of magnitude larger than the upstream rate, which follows directly from the TCP-connection volume distribution. Some connections reach upstream data rates that are 10 times higher than the modem speed. This could happen if a connection setup is requested with a SYN-packet and refused with a Reset-packet. In this case, the modem speed does not effect the measurement. The throughput of TCP-connections depends on a closed-loop control cycle. Therefore, the up-and downstream data rate is correlated. Figure 10 shows the correlation of up- up-and downstream data rates for 14 kbps resp. ADSL access speed. The figures for the remaining modem speeds are omitted since no additional information is contained. The range of up- and downstream ratio is similar for all modem speeds, but of course the faster modems capture a wider range of data rates.
If up- and downstream data rate are highly correlated, the plot in Figure 10 would be a diago-nal line. The fact, that the up- and downstream rate ratio varies mainly over 2 orders of magni-tude is investigated in Figure 11, where the rate ratio is rendered over the downstream data volume. Again, the figures look similar for all investigated modem speeds, but for faster modems also some larger connections are measured. For small downstream data volume the upstream rate is higher than the downstream rate. For large connections a limit is reached at 1/ 50, since two data packets of 1500 Bytes could be acknowledged with one packet of 60 Bytes.
Figure 8: TCP-connection volume distribution. 102 104 106 108 10-5 10-4 10-3 10-2 10-1 100
upstream TCP connection volume [bit]
CCP D F ADSL 64 kbps 56 kbps 30 kbps 14 kbps 9.6 kbps 102 104 106 108 10-5 10-4 10-3 10-2 10-1 100
downstream TCP connection volume [bit]
CCP D F ADSL 64 kbps 56 kbps 30 kbps 14 kbps 9.6 kbps
Figure 9: TCP data rate distribution. 102 103 104 105 106 10-5 10-4 10-3 10-2 10-1 102 103 104 105 106 10-5 10-4 10-3 10-2 10-1 100
upstream TCP data rate [bps]
CCP D F ADSL 64 kbps 56 kbps 30 kbps 14 kbps 9.6 kbps 102 103 104 105 106 10-5 10-4 10-3 10-2 10-1 102 103 104 105 106 10-5 10-4 10-3 10-2 10-1 100
downstream TCP data rate [bps]
CCP DF ADSL 64 kbps 56 kbps 30 kbps 14 kbps 9.6 kbps
This also implies that for fast transmission of HTTP data, where about 50% of the downstream connection volumes are less than 3000 Bytes, a symmetric connection is required.
5 Conclusion and Outlook
In this paper we presented an analysis of an IP packet trace measured at the dial-in access of the computing center of the University of Würzburg. By evaluating the packet trace in con-junction with the accounting data, we were able to relate the access speed and the packet data, in order to measure the user behavior in dependence of access speed. The dial-in trace was compared to data collected during an ADSL field trial. The intention of the approach was to identify general properties of internet traffic and dependencies of the subscriber behavior and the access speed. Results of this form the basics for developing a generalized Internet user model, which becomes increasingly important in presence of the variety of future access tech-nologies, which range from slow wireless IP access to high-speed HDSL connections.
We identified several general properties of Internet traffic that are almost independent on the access speed. Among them are the session duration, the shape of the up- and downstream ses-sion volume, the shape of the TCP-connection volume and the TCP connection data rate. The correlation of up- and downstream data rate is influenced only marginally by the access speed.
Figure 10: TCP data rate correlation for 14.4kbps (left) and ADSL (right).
upstream data rate [bps]
dow ns tr eam dat a rate [bps ] 10-1 100
upstream data rate [bps]
dow ns tr eam dat a rate [bps ] 10-1 100 101 102 103 104 105 106 10-1 100 101 102 101 102 103 104 105 106 10-1 100 101 102 103 104 105 106 107
upstream data rate [bps]
dow ns tr eam dat a rate [bps ] 10-1 100 101 102 103
upstream data rate [bps]
dow ns tr eam dat a rate [bps ] 10-1 100 101 102 103 104 105 106 10-1 100 101 102 103 104 105 104 105 106 10-1 100 101 102 103 104 105 106 107
Figure 11: TCP data rate ratio in dependence of downstream data volume for 14.4kbps(left) and ADSL (right).
downstream data volume [Byte]
ups tr eam / dow ns tr eam ra te ra ti o 102 104 106 108 10-2 10-1 100 101 102
downstream data volume [Byte]
ups tr eam / dow ns tr eam ra te ra ti o 102 104 106 10
downstream data volume [Byte]
ups tr eam / dow ns tr eam ra te ra ti o 102 104 106 108 10-2 10-1 100 101 102
The traffic volume and the obtained data rates were found to increase proportionally to the access speed. With respect to interactive applications the raise of traffic volume and rate is less than the corresponding increase in modem speed. Also the services utilized change in depen-dence of the access speed. Nevertheless, the similar shape of the distributions should be helpful when developing a parametrized Internet traffic model.
Acknowledgments
The authors would like to thank Prof. Tran-Gia for the fruitful discussions during the evalua-tion and interpretaevalua-tion of the results. Further the cooperaevalua-tion of the computing center of the University of Würzburg is highly appreciated.
References
1. M. E. Crovella and A. Bestavros. Self-Similarity in World Wide Web Traffic: Evidence and
Possible Causes. Proceedings of the 1996 ACM SIGMETRICS International Conference
on Measurement and Modeling of Computer Systems, May 1996, Philadelphia, PA, USA. 2. W. E. Leland, W. Willinger, M. S. Taqqu and D. V. Willson. On the Self-Similar Nature of
Ethernet Traffic. Proceedings of the ACM SIGCOMM’93, September 1993, San
Fran-cisco, CA, USA.
3. P. Karlsson and A. Arvidsson. The Characteristics of WWW Traffic and the Relevance to
ATM. May 1997, Temporary Document COST 257(97)21, COST 257 Management
Com-mittee Meeting, Helsinki, Finland.
4. S. Molnar and A. Vidacs. On Modeling and Shaping Self-Similar ATM Traffic. Proceed-ings of the 15th International Teletraffic Congress, June 1997, Washington, D.C., USA. 5. B. A. Mah. An Empirical Model of HTTP Network Traffic. Proceedings of the IEEE
INFO-COM '97, April 1997, Kobe, Japan.
6. C. R. Cunha, A. Bestavros and M. E. Crovella. Characteristics of WWW Client-based
Traces. June 1995, Technical Report TR-95-010, Boston University Computer Science
Department.
7. N. Vicari. Models of WWW-Traffic: a Comparison of Pareto and Logarithmic Histogram
Models. April 1998, Proceedings of the 5th Polish Teletraffic Symposium / Project
COPERNICUS 1463 ATMiN - Closing Seminar, Warsaw, Poland.
8. V. Bolotin, J. Coombs-Reyes, D. Heyman, Y. Levi and D. Liu. IP Traffic Characterization
for Planning and Control. Proceedings of the ITC 16, June 1999, Edinburgh, UK.
9. H.-K. Choi and J. O. Limb. A Behavioral Model of Web Traffic. 7th International Confer-ence on Network Protocols (ICNP’99), October 1999, Toronto, Canada.
10. J. Färber, S. Bodamer and J. Charzinski. Measurement and Modelling of Internet Traffic at
Access Networks. Proceedings of the EUNICE '98 - Open European Summer School on
Network Management and Operation. August 1998, München, Germany. 11. TCPDUMP, available via http://ftp.ee.lbl.gov/.
12. TCPTRACE, available via http://jarok.cs.ohiou.edu/software/tcptrace/tcptrace.html. 13. DFN. B-Win Statistics. http://www-win.rrze.uni-erlangen.de/cgi-bin/auswahl-linkstat.pl.