JoAnn Rudd Alvarez, MA
[email protected] biostat.mc.vanderbilt.edu/JoAnnAlvarez
Department of Biostatistics Division of Cancer Biostatistics Center for Quantitative Sciences Vanderbilt University School of Medicine
2014 February 13
Epidemiology Community of Practice Tennessee Department of Health
Overview
1 Introduction
2 Demonstration
3 Getting started
4 knitr: Integrating R into a reproducible workflow
5 Resources
Introduction
R
Statistical programming language Software environment
Developed by Ihaka and Gentleman, R Development Core Team
Appeared in 1993
Decendent of S, influenced by C
http://www.r-project.org
Introduction
Capabilities of R Data management Analysis
Computation comparable to MATLAB Graphics
Introduction
Characteristics of R Command line Functions, objects
Data stuctures: (rectangular) data frame, list, vector, matrix
Introduction
Advantages of R Freely available
Can easily write your own functions Intuitive to use
Flexible
Fast implementation of new methods Users have access to source code
Introduction
Disadvantages of R
Contributed packages should be used with caution
Limited capacity for working with very large datasets. Data must fit into RAM
Demonstration
Demo to illustrate
Basic variable assignment and some structures Reading in a text file
Data manipulation: subsets, re-categorizing variables Calculate non-parametric survival estimates
Examine the stucture of R objects Extract individual items from R objects
Getting started
Installing R
cran.r-project.org
Windows intallation:
cran.r-project.org/bin/windows/base/
Getting started
Editing your R code
You can use your favorite text editor/IDE (integrated development environment) or use the one that is built-in.
R’s editor very basic
R Studio More features like highlighting and matching brackets
Easy to use
Includes a built-in terminal Freely available at
http://www.rstudio.com/ide/download/
Textmate Available only on Mac
Even more features and funcitonality
Kind of a hybrid between GUI and high-powered editors
Freely available at http://macromates.com
Getting started
Reading and writing files
Functions read.table(), read.csv(), read.fwf() Do not have to specify details as in SAS Example:
myData <- read.table(file = "filename.csv", header = TRUE, sep = ",")
Can read other types of files with foreign package
Getting started
Installing and using packages
All R functions and datasets are in packages.
CRANcran.r-project.org, bioconductor
Install: install.packages(”Hmisc”) Load: library(Hmisc)
Update: update.packages()
See all currently loaded packages: SessionInfo()
Getting started
Using the R documentation apropos()
help()
Reproducible research
Combines R code and LATEXmarkup into one report document
Enables raw output, tables, graphics, and report text to be dynamically updated
knitr
Example report made in knitr
Aim 1 analyses for microhematuria R03
Dan Barocas, PI Tatsuki Koyama and JoAnn Alvarez, Department of Biostatistics
February 10, 2014
Contents
1 Written summary 1
2 Demographic and univariate association tables 3
3 Model results 11
4 Mechanism of gender disparity in cystoscopy use in microhematuria work up 13
5 Raw model output 15
5.1Saw urologist . . . .15
5.2Procedure . . . .15
5.3Imaging . . . .16
5.4Complete evaluation . . . .17
5.5Workup quality (ordinal). . . .18
6 Supplementary material 20 6.1Check of proportional odds assumption for workup intensity . . . .20
1Written summary
Research aim:Determine the association between race and receipt of a timely and complete evaluation of hematuria in a nation-wide 5% sample of Medicare patients. We hypothesize that African-Americans with hematuria receive sub-optimal workup of hematuria compared to Whites, and that controlling for socio-economic status will attenuate the racial differences. Data considerations:Data from areas other than the fifty US states or the District of Columbia were excluded. There were 21 such observations.
Variable definitions:Patients were considered to have a cancer diagnosis if they had any of the following diagnoses: pca.cis, renal.ca.cis, bladder.ca.cis, other.ca.cis, prostate.benign, renal.benign, bladder.benign, other.benign. Race was categorized as black, white, Hispanic, Asian, or other. Pa-tients whose race was listed as “unknown” in the data were treated as having missing information on race, rather than including them in the “other” category. Anticoagulant use indicates chronic use of anticoagulant medication. Income is the median household income in the patient’s county. Region is a four-category variable indicating one whetherthe patient? provider? facility?was in the
1
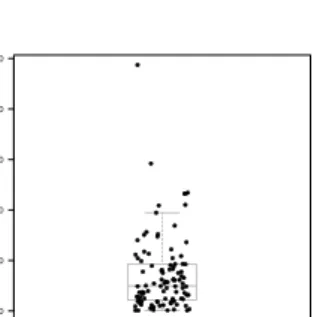
knitr Example
example.Rnw \documentclass{article} \begin{document} <<echo=FALSE>>= data <- rexp(100, 1/7) meandata <- mean(data) @\noindent The mean of the data was \Sexpr{round(meandata, 2)}. <<echo=FALSE>>= boxplot(data, boxwex = 0.5,
border = "gray", las = 1, outline = FALSE, ylim = c(0, max(data))) stripchart(data, method = "jitter",
pch = 19, vertical = TRUE, add = TRUE) @ \end{document} knit(“example.Rnw”)
→
→
→
example.tex \documentclass{article} \usepackage{graphicx, color} \begin{document}\noindent The mean of the data was 7.12.
\begin{knitrout}
\definecolor{shadecolor}{rgb}{0.969, 0.969, 0.969}\color{fgcolor}\begin{figure}[]
\includegraphics[width=\maxwidth]{figure/unnamed-chunk-2} \caption[This is my figure caption]{This is my figure caption\label{fig:unnamed-chunk-2}} \end{figure}
\end{knitrout} \end{document}
Simple knitr Example
0 10 20 30 40 50 ● ● ● ● ● ● ● ● ● ● ● ● ● ● ● ●● ● ● ● ● ● ● ● ● ● ● ● ●● ● ● ● ● ● ● ● ● ● ● ● ● ● ● ● ● ● ● ● ● ● ● ● ● ● ● ● ● ● ● ● ● ● ● ● ● ● ● ● ● ● ● ● ● ● ● ● ● ● ● ● ● ● ● ● ● ● ● ● ● ● ● ● ● ● ● ● ● ● ●Figure 1: This is my figure caption
The mean of the data was 7.12.
1
Resources for learning R
R resources
Terri Scott’s teaching materialshttp://biostat.mc.
vanderbilt.edu/wiki/Main/TheresaScott
Robert Meunchen’sR for SAS and SPSS Users
http://r4stats.com/books/r4sas-spss/
Robert Meunchen’s
https://science.nature.nps.gov/im/datamgmt/ statistics/R/documents/R_for_SAS_SPSS_users.pdf
Resources for learning R
More resources
Nashville R Users Group
http://www.meetup.com/Nashville-R-Users-Group/
UCLA’s website: http://www.ats.ucla.edu/stat/r/
R manuals http://cran.r-project.org/manuals.html
http://cran.r-project.org/doc/manuals/r-patched/ R-intro.pdf
Vanderbilt Department of Biostatistics wiki
http://biostat.mc.vanderbilt.edu/wiki/Main/RS