A.Riedijk R.J. van de Velde I.D. Pleizier T. C. Hoogerwerf R.J.A. van Lammeren W.H.M. Baltussen J. Jansen P. Wynia J.H. van Uum R. van Wilgenburg
Vrije Universiteit, Amsterdam, 2006
Virtual Netherlands
Geo-visualizations for interactive spatial
planning and decision-making:
From Wow to Impact
C
OLOFONTITLE
Virtual Netherlands. Geo-visualizations for interactive spatial planning and decision-making: From Wow to impact. Definition study.
AUTHORS
Arda Riedijk, Spatial Information Labaratory (SPINlab), VU Amsterdam.
Rob van de Velde, Spatial Information Labaratory (SPINlab), VU Amsterdam and GIS Competence Centre, Dienst Landelijk Gebied.
Irene Pleizier, Spatial Information Labaratory (SPINlab), VU Amsterdam.
Rosan van Wilgenburg, Spatial Information Labaratory (SPINlab), VU Amsterdam. Tessa Hoogerwerf, Omgevingswetenschappen, Wageningen Universiteit.
Ron van Lammeren, Omgevingswetenschappen, Wageningen Universiteit. Willy Baltussen, Landbouw Economisch Instituut.
Jan Jansen, Nieuwland. Peter Wynia, Nieuwland.
Joost van Uum, Dienst Landelijk Gebied.
CONTACT
Vrije Universiteit Amsterdam
Faculteit der Economische Wetenschappen en Bedrijfskunde
Afdeling Ruimtelijke Economie/ Spatial Information Labaratory (SPINlab) De Boelelaan 1105
1081 HV Amsterdam The Netherlands Phone: +31 20 5986099
Email: [email protected], [email protected] Website: http://www.feweb.vu.nl/gis
Cover design by Irene Pleizier, SPINlab: Interactive geo-visualization representing development of Meerstad in the Province of Groningen.
This definition study is partly financed by the BSIK program Space for Geo-Information within the project RGI-003: Virtual NL. For more information about the program Space for Geo-information please consult www.rgi.nl.
M
ANAGEMENT SUMMARY RESEARCH GOALS (CHAPTER 1)Due to the increasing complexity of spatial planning issues and the increasing demand of emancipated citizens for taking part in designing and deciding on spatial plans, a quality boost is needed in communication processes between governmental actors and citizens about land use. Geo-visualizations that can be created, presented and exchanged by all actors easily, such as the intuitive platform Google Earth, can very well contribute to an improved understanding, commitment and interest of participating actors in spatial transitions. However, scientific knowledge on the effects on decision and policy procedures is very limited and is characterized by fragmented case studies. Furthermore, practical examples are very fragmented. This research is written to respond to the demand for better insight into the meaning of geo-visualization in learning and working processes. This study is part of the joint research project Virtual Netherlands (Virtual NL), which focuses on the outcome of using geo-visualizations: what could geo-visualizations mean for specific planning phases and the involvement of actors? In this study therefore, an exploration has been made of scientific concepts and insights, research methods and techniques, best practices and user needs and infrastructural requirements, in order to define knowledge gaps and future research needs. The results of this study form the background and motivation for Virtual NL.
SCIENTIFIC CONCEPTS AND RESEARCH METHODS (CHAPTER 2 AND CHAPTER 3)
Contemporary socio-political issues that directly relate to the increasing use and development of, and need for geo-visualizations in participatory spatial planning can be summarised in four key concepts:
1. Governance: balancing between complexity and simplicity
The expected increased use and development of web based interactive geo-visualizations in spatial planning issues is a logical move forward in dealing with the complexity of spatial developments; geo-visualizations simplify spatial settings in a realistic way and make spatial scenarios understandable for lay people.
2. Interactivity: balancing between process and results
Web based interactive geo-visualizations are good supportive tools for generating, sharing and reflecting on different interpretations among actors and will subsequently contribute to achieving better process goals and in the end to achieving better project results and a broadly carried acceptance of the spatial transition.
3. Information society: balancing between transparency and commitment
The democratic, accessible and bottom-up character of the Internet will support wider commitment and mutual understanding in spatial planning processes due to a combination of text and images on an interactive web based interface. Transparency in spatial planning therefore is highly valued but often not yet taken for granted.
4. Social learning: balancing between learning by doing and institutionalisation
Scarce presence of and experience with web based interactive geo-visualization tools limit substantial use of such tools among actors, therefore a knowledge transfer point containing best practices, guidelines and experiences in combination with hands-on training sessions in pilot areas can benefit the knowledge dissemination.
Existing research on the effects of visualizations teaches us that the aim of using geo-visualizations is to influence the participatory spatial planning process in a positive way. This positive effect could be on the actors who are going to reflect on the proposed plans as well as on the process itself. Geo-visualizations are expected to have a positive influence on the actors’ willingness to make compromises as well as on the acceptance of the final plans. Moreover, geo-visualizations are expected to contribute to better communication and
understanding among actors. Supposedly, the level of detail of a geo-visualization is very important in order to accomplish these effects.
Also in terms of the spatial planning and decision-making process in general, geo-visualizations are expected to have a positive influence; factors that seem to determine this are among others the total speed of the process, the increase in the number of participating actors, the increase in knowledge exchange, the quality and content of the plan, the satisfaction of the actors and the change in organisation of the planning and decision process. Moreover, it seems that a combination of low-tech (such as maps, face-to-face meetings, scale models, sketches) and high-tech (such as the Internet and various visualization tools) methods is most appropriate to have actors express their views and opinions.
Taken as a whole, literature review shows that structured research on well-defined geo-visualization effects on both actors and process has not been performed yet. Most articles come up with a wide variety of expectations, recommendations and case study-based advantages and disadvantages of geo-visualizations but they miss a coherent structure. Furthermore, the reviewed articles lack a well-defined method to measure and analyse the effects mentioned. The current status of research makes it difficult, but challenging, to further investigate geo-visualization effects on the planning process.
In chapter 3 therefore, several research methods and approaches are described that seem useful to study geo-visualization effects. Each of these methods and approaches has its advantages and disadvantages. The main strength lies in the combination of these methods and approaches to study the geo-visualization effects from a broad perspective.
Future research should focus on two main research lines: First of all, the effect of geo-visualization on actors is an important issue, because this automatically affects the whole planning process. In particular, the level of detail in geo-visualization is an issue, due to the opposite arguments that are made in literature (planning and decision contexts). Secondly, the potential of geo-visualization to increase the speed with which people gather and process information needs to be studied (learning contexts). Knowledge about this potential is important to get insight in the people’s knowledge on and experience with complex spatial issues. For both research topics, a combination of research methods will be required: (web) surveys, questionnaires, assessments, observations and interviews to study the effectiveness of geo-visualizations that vary in level of detail for specific tasks.
BEST PRACTICES AND USER NEEDS (CHAPTER 4)
Geo-visualization tools are becoming more flexible and accessible for the general public as well as for professionals. While current use of geo-visualization is still restricted to serve as a mean to illustrate, visualise and present we are noticing a shift towards more interactive and participatory use of geo-visualizations. This shift is found in various initiatives and ideas from different actors dealing with geographic information such as Dienst Landelijk Gebied,
StichtingDe Nieuwe Kaart van Nederland, Rijkswaterstaat, the city of Helmond, the Nederlandse
Aardolie Maatschappij and the Project bureau Nieuwe Hollandse Waterlinie. An interactive
geo-visualization tool that aims at improving communication between stakeholders and at improving the spatial planning process in general should meet a number of criteria in order for end-users to be tempted to react and to start a creative process, these criteria include: intuitiveness, to be used on standard pc’s, presenting a transparent picture of both integrated and detailed information, offering an interface to navigate from different angles and to explore different scenario’s, presenting a challenging design and appealing to a common fascination of end-users. In sum, geo-visualizations in spatial planning are supposed to:
• Summarize, structure and present spatial plans;
• Enhance accessibility of plans and alternatives;
• Enhance comprehension and insight of the effects of spatial measures;
• Encourage lively discussion and active reflection;
• Discover new ideas, solutions and design defaults on time;
• Support the decision making process;
INFRASTRUCTURAL REQUIREMENTS (CHAPTER 5)
Looking at the requirements of the different phases in the geo-visualization process one can conclude that, at the moment, many public sector organisations will lack the required technical resources and knowledge for setting up their own geo-visualization environment. This is an area in which the project Virtual Netherlands could play a significant role; providing both centralized facilities (Knowledge Transfer Point) and decentralized components (such as start-up packages for stakeholders to setup their own geo-visualization infrastructure). One of the envisioned project results of Virtual Netherlands is the establishment of a ‘Knowledge Transfer Point’ (KTP). This KTP aims at collecting, sharing and passing knowledge on deployment of geo-visualization tools to be brought into action for spatial transition processes. As a centralized facility, the KTP could provide:
• Knowledge dissemination about geo-visualization in spatial planning and plan implementation;
• Agreements about the interpretation and use of the geo-visualization according to the Participatory Spatial Planning (PSP) framework;
• Standards related to these agreements;
• Policy that supports the role of geo-visualization in PSP (a reasonable next step). With regard to the (technical) requirements of a spatial infrastructure, the KTP can provide technical guidelines, ICT tools and manuals on the design and realization of an interactive geo-visualization platform. In the form of start-up packages, the KTP can assist in al phases of the geo-visualization process. These packages can consist of datasets that, because of their metadata, can easily be transformed into geo-visualizations. Furthermore, tools for upload and download of geo-spatial data to and from a geo-visualization platform (like Google Earth) are needed. Also, a web platform and/or a Google Earth based web service - meant for various smaller governments that will lack the required technical resources for setting up a geo-spatial web architecture on their own - could belong to the possibilities.
KNOWLEDGE GAPS AND FURTHER RESEARCH (CHAPTER 6)
This study has shown that available research is limited. There is a need for better insight into the importance of new communication and visualization tools such as Google Earth. Therefore the project consortium argues for a communicative approach - both in practice and in research - to geo-visualization, to respond to the need for transparency of policy and implementation in spatial issues. ‘Virtual NL’ according to the authors represents a way of communicating about spatial plans and scenario’s: visual (or broader: sensual), accessible, open for interpretation, intuitive, and stimulating. The initiatives taken so far as regards to geo-visualizations in participatory spatial planning are promising; the authors therefore stress the need for further research on the effectiveness of geo-visualizations in interactive planning and decision-making.
Some critical questions need to be answered to fulfil the ‘white spots’ in scientific knowledge and to promote practical skills and experience. Two research lines are promoted, focussing on planning and decision contexts and on learning contexts. A set of research questions has been formulated that could guide future research within these two research lines. The questions are divided into five clusters: infrastructure, methodologies, cognition, social learning and policy & implementation.
T
ABLE OFC
ONTENTS1 GEO-VISUALIZATION FOR INTERACTIVE SPATIAL PLANNING...9
1.1 Introduction... 9
1.2 Research goals and methods... 10
1.3 Empirical and scientific motivation for this study ... 11
1.4 Outline ... 12
2 VISUALIZATIONS IN A CHANGING SOCIO-POLITICAL CONTEXT...13
2.1 Introduction... 13
2.2 From government towards governance ... 13
2.3 Evaluating interactivity in spatial planning... 14
2.4 The meaning of geo-visualizations for participatory spatial planning ... 16
2.4.1 Images and interaction: needs and challenges... 16
2.4.2 ICT providing increased opportunities to achieve involvement... 20
2.5 Drawbacks... 21
2.6 Conclusion... 22
3 GEO-VISUALIZATION AND INTERACTION: WHAT IS KNOWN?...25
3.1 Introduction... 25
3.2 Geo-visualization effects in literature ... 25
3.2.1 Geo-visualization effects on actors ... 25
3.2.2 Geo-visualization effects on the process... 28
3.2.3 Integration ... 29
3.3 Research methods: new challenges ... 29
3.4 Discussion and Conclusions ... 31
4 PRACTICE, EXPERIENCES, AND EXPECTATIONS...33
4.1 Introduction... 33
4.2 Geo-visualization: trends and future ... 33
4.3 Best geo-visualization practices... 35
4.3.1 Experimenting with geo-visualizations for Land and Water Management... 35
4.3.2 Geo-visualizations and participatory planning: learning by doing in five European regions... 36
4.3.3 Virtual reality in civil engineering... 38
4.3.4 Landscape impact visualization in Dutch oil and gas industry ... 38
4.3.5 Helmond Virtuocity: Virtual participation platform in real-time 3D on the Internet... 39
4.3.6 Stichting ‘De Nieuwe Kaart van Nederland’ ... 40
4.3.7 Project bureau De Nieuwe Hollandse Waterlinie ... 41
4.4 Dreams and expectations... 42
4.5 Conclusion... 43
5 INFRASTRUCTURAL REQUIREMENTS FOR INTERACTIVE GEO-VISUALIZATIONS...45
5.1 Introduction... 45
5.2 Components of a spatial data infrastructure... 45
5.3 Requirements of geo-visualization in a spatial data infrastructure ... 45
5.4 Benefits of a spatial data infrastructure for geo-visualization... 49
6 CONCLUSION...51
6.1 Integration ... 51
6.2 Lessons learned: the importance of geo-visualizations ... 51
6.3 Research agenda ... 52
7 REFERENCES...55
ANNEXES...59
Annex I Respondents ... 61
1 GEO
-
VISUALIZATION FOR INTERACTIVE SPATIAL PLANNING 1.1 INTRODUCTIONGlobeAssistant about Google Earth: ”Don’t bother trying to find an address, but fly directly to your hotel location to pick your ocean view hotel room, or fly to the neighbourhood where you’ll be buying your new house. Just click on the image and additional information will pop-up; reservations, houses on-sale, whatever you wish to add to it (van der Heijden, 2005).”
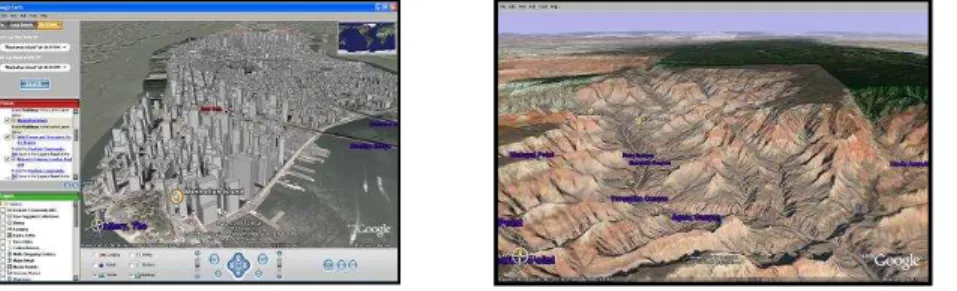
With Google Earth it is possible to present and exchange geo-information within a large user group. Why not use this potential to inform, present, discuss and interact about spatial plans? This study elaborates upon the possibilities of interactive use of three-dimensional (3D) geographic information (or geo-visualizations) in spatial transitions, keeping in mind the great potential of Google Earth as a medium to communicate.
Every plan concerning the development of public space – whether it is city, nature, countryside or water related – asks for involvement of and communication between government, private actors and civil society. In this study we will call this involvement and communication ‘interactivity’. Not only does interactivity contribute to a publicly carried spatial development, it also clearly exposes interest differences out of which solutions and compromises can be derived. More and more, interactive processes will be supported by geo-visualization techniques with which future spatial scenario’s can become visible and more imaginable for actors. A geo-visualization pictures a certain area of concern, by ‘flying’ over the area the user can choose to see and experience changes in land development and can even manipulate this development to his or her own taste. Geo-visualizations are developed to excite people: they are supposed to stimulate people’s creativity and involvement and to invite them to give information and to get informed.
This study is written within the framework of the ‘Space for Geo-Information’ program. This program funds several projects, among others Virtual Netherlands (Virtual NL). Virtual NL is a joint project with participants from 2 universities, 2 private companies and 2 (semi)governmental institutions. Virtual NL is inspired by the growing information, communication and participation need in geospatial developments. The project partners have the ambition of becoming the interactive platform where politicians, citizens, companies and civil organizations can present and exchange visualized information concerning spatial issues. In this study we focus on the exploration of state of the art studies and on defining knowledge gaps on the interface of geo-informatics, governance, communication and interaction. The fundaments lain in this research are being developed in ‘interaction’. A consortium existing of users, scientists, process experts and technical specialists will take care of a valid definition of above mentioned knowledge need.
1.2 RESEARCH GOALS AND METHODS
This study aims at defining research objectives and –questions. By doing this, we will underpin extensive research on the effects of usage of geo-visualization tools on interactive spatial planning processes between government and society. Furthermore, we will present some important state of the art developments that according to us illustrate the relevance of geo-visualization tools for spatial planning. By combining existing theory and our aspirations concerning geo-visualization, both scientific and societal information needs will become visible. We first elicit two concepts that will be used frequently in this study: Interactive Spatial
Planning and Geo-visualizations.
The terms ‘Interactive’ and ‘participatory’ in this study are often used as one and the same, when we use these terms we refer to Dalal & Dent (1993) who see interactive planning as one of the different levels1 of participation that are possible. Interactive planning is defined by Dalal en Dent (1993: 108):
“People participate in joint analysis, which leads to action plans and the formation of new local institutions or the strengthening of existing ones. It tends to involve interdisciplinary methodologies that seek multiple perspectives and make use of systematic and structured learning processes. These groups take control over local decisions, and so people have a stake in maintaining structures or practices.”
A geo-visualization is an interactive, virtual representation of one or more existing or future spatial scenarios. An important characteristic of geo-visualizations is that one can look at spatial data in several ways and from various angles; this strengthens insight into spatial information and increases generation of new ideas (Kraak, 2004). We distinguish 2D and 3D geo-visualizations: 2D maps can be simply visualised on a computer screen or even printed out and handed out as leaflets. 3D Scenes on the other hand offer a more surrounding and immersive environment to navigate through. In 3D geo-visualization, a regular solid scale model is combined with GIS approaches; the 3D effect of a scale model for visualising the future situation and the interactivity and adaptability of the GIS component are brought together. This combination is called VRGIS -Virtual Reality GIS (Hacklay, 2001). In sum, the meaning of geo-visualization as used in this study is derived from Kraak (2003) and is defined as follows:
“Geo-visualizations are visual geospatial displays designed to explore data and through that exploration to generate hypotheses, develop problem solutions and construct knowledge. Maps and other linked graphics play a key role in this process.”
With respect to policy and planning procedures this study will focus on five aspects:
• Defining scientific concepts and insights about the effects of geo-visualization tools in policy processes and citizen-government interactions;
• Defining research methods and techniques to measure the effects of geo-visualization on interactive policy processes;
• Defining best practices and user needs concerning practical geo-visualization tools;
• Defining infrastructural and system demands for governments who wish to use geo-visualization tools;
• Defining knowledge gaps and research questions for future research.
To be able to formulate valid research questions in the final chapter, we aim at presenting a complete overview of information needs in terms of scientific needs as well as user needs. To achieve this we gathered a transdisciplinary research team, each member focussing on a certain aspect of this study. Desktop research on existing disciplines such as GIS, policy
1 These different levels of participation are described as: passive participation, participation in information gathering, participation by consultation, participation for material incentives, functional participation, interactive participation and self-mobilisation (Dalal & Dent, 1993:108).
science, cognition science, and communication science is conducted. Furthermore, a set of interviews is taken with people from practice with technical, process or visioning skills. In the first and second annex, a list of respondents is inserted as well as the interview guide. These interviews serve to broaden our understanding of the expected effects of geo-visualization in participatory processes. Also, outcomes of this study were tested during the Mansholt debate in The Hague with the board of directors of the Ministry of Nature, Agriculture and Food Quality.
In connecting as much as possible with the user groups, our research team strongly holds to an action-oriented approach; our objective is to define the benefits and information needs of geo-visualization in participatory planning in accordance with respondents in order to support developments in geo-visualization and participatory planning.
1.3 EMPIRICAL AND SCIENTIFIC MOTIVATION FOR THIS STUDY
Due to the increasing complexity of spatial planning issues and the increasing demand of emancipated citizens for taking part in designing and deciding on spatial plans, a quality boost is needed in communication processes between governmental actors and citizens about land use. Geo-visualizations (see definition) that can be created, presented and exchanged by all actors easily, can very well contribute to an improved understanding, commitment and interest of participating actors in spatial transitions. However, scientific knowledge on the effects on decision and policy procedures is very limited and is characterized by fragmented case studies. This makes it hard to compare usable cases; this in turn seems to be caused by relatively high costs of geo-visualization tools and the low accessibility for large user groups. As we will see, the recent launch of Google Earth will expectedly overcome this barrier by offering a total new decade of access to geo-information. Yet another constraining factor concerns the limited knowledge and experience among policy makers, planners, architects and process managers in dealing with geo-visualization tools. This leads to a demand for better insight into the meaning of geo-visualization in learning and working processes. Furthermore, research on geo-visualizations is very often written primarily from a technical perspective emphasising technical tool requirements or characteristics. The project consortium tries to fill this gap by focussing more on the outcome of using geo-visualizations, what could geo-visualizations mean for specific planning phases and the involvement of actors?
In sum, the motivation for promoting use of geo-visualization in participatory planning processes is expected to yield the following knowledge and results:
• Improvement and more consistent tuning of diverse horizontal and vertical policy chains (among others in spatial planning, area-based policy, external safety, revitalising agriculture, etc.);
• Commitment, interaction and social support (and with that the opportunity to successfully implement policy) can increase vastly due to better communication channels that are more accessible and that appeal or trigger imagination;
• Better communication (through geo-visualization and through the results of the Virtual NL project) diminishes the chance at expensive and often irreversible planning mistakes;
• Better communication fits very well within the policy framework promoted by the national government and cabinet, which is called ‘Programma Andere Overheid’ or ‘Towards Governance’, a program that stimulates government-citizen interaction.
1.4 OUTLINE
In the following chapters we will explore both theory and practice. Chapter 2 offers a contextual frame where we’ll touch upon issues that represent the social and scientific context in which this project will take place. This chapter helps us to formulate our research questions more profoundly. Chapter 3 deals thoroughly with what is already researched and what should be further examined about the effects of geo-visualizations on spatial planning processes. Chapter 4 will offer a practical insight of best practices, challenges and user needs. Chapter 5 then offers a technical guide for the implementation of the project; this chapter deals with the issues that should be taken care of when using an interactive web based infrastructure. Lastly, Chapter 6 will present lessons learned and knowledge gaps. Furthermore, the chapter will present the guiding ideas about the research methods to be applied to study the effects of geo-visualizations on participatory spatial planning.
2
V
ISUALIZATIONS IN A CHANGING SOCIO-
POLITICAL CONTEXT 2.1 INTRODUCTIONIn this chapter, social oriented developments are studied which are relevant in relation to the increasing use of geo-visualizations. Three developments will be correspondingly discussed in the following paragraphs: a) political changes in spatial planning, b) interactivity in spatial planning and c) the social tendency to communicate by graphics instead of written text. Based on these developments, a contextual frame will be presented with which the following chapters can be understood.
2.2 FROM GOVERNMENT TOWARDS GOVERNANCE
Tasks and roles of governments are changing. To conceptualise the complex relations and policy processes that characterise modern spatial planning, political and social scientists often refer to the terms ‘multi-actor and multi-level governance’. This refers to situations where public policy takes places in different layers (municipal, provincial to national and European) in interaction with different governments and other actors. This situation differs strongly from a situation where the central government makes the plans and decisions. Governance is described as a means of policy making and governing in which governmental organisations and non-governmental organisations participate in mixed public and private networks; policy making no longer is done by a central dictated plan but by an open, complex and interactive process where several public and private actors participate and look for solutions that suite them all. The government in this respect does not function as a regulator solely but is increasingly taking the role as a facilitator of local and regional initiatives (see Arts & Leroy, 2003; Kooiman, 2003; Aarts & van Woerkum, 1999).
In her book ‘Laveren tussen regio’s en regels’ Boonstra (2004) has analysed policy changes and developments within three Dutch regions where ‘integrated area-based rural policy’- projects are implemented. This regional, multi-actor and multi-level approach to rural problems however is characterized by a diminishing steering capacity of governmental actors. Not just the complexity of rural problems themselves seems to be an important causal factor. Various social scientific theories point in this respect to underlying societal factors such as changing relationships, fading borders, new networks and arrangements, new social movements and emancipated citizens within post-modern society. Key concepts are globalisation, individualisation, information and communication technology and the so-called risk society, which have severe consequences on such policy developments (see Giddens, 1990; Beck, 1992; Castells, 1996).
Boonstra describes how an integrated area-based rural approach offers opportunities for a way out of complex rural problems, she emphasises the learning process it entails. This learning process should result in a greater involvement of rural citizens, mobilisation of their knowledge and experiences and coming to creative solutions adjusted to specific regional circumstances. Furthermore, an integrated, interactive approach should help in regaining trust between rural citizens and the government and among rural citizens one another (Boonstra, 2004: 13).
In the changing relationships between government, market and civil society, governmental organisations are not solely governors anymore but increasingly tend to fulfil a facilitating role in order to optimize the public good. Civil actors on the other hand become more and more critical and emancipated in defining their needs and wishes. Spatial planning related issues can be characterized as social dilemmas. A social dilemma occurs when individual interests appear to conflict with more advantageous collective interests. In densely populated countries for example, scarcity of space requires people to choose between natural
environmental interests and housing development interests when towns want to expand and develop houses in river plains. In addition, the growing number of actors involved, an increasing amount of information to be processed, and uncertainties involved contribute to the complexity of land and water management planning (Maarleveld et al, 2005).
In general it can be said that in every facet of today’s society, we get to deal with more dynamic, complex and hard to gauge developments, which makes the search for a ‘one fits all’ solution very problematic. There is a growing need for pluriformity, since societal demands can no longer be resolved unequivocally (Van Woerkum, 2002:5). With that comes the role technology plays in contemporary society; information and communication technology has influenced the relation between people and their world tremendously due to its mediating role in this relation (Pieters & Becker, 2005). The role of ICT in spatial planning will be further discussed in paragraph 2.4.
In this context of changing relationships and unknown risks and challenges, it is utmost important to communicate in a clear, open and transparent way to the society in general and to actors in spatial transitions specifically. The following paragraphs draw a little deeper upon communication and interaction and the role of geo-visualization tools within spatial planning developments.
2.3 EVALUATING INTERACTIVITY IN SPATIAL PLANNING Tell me, I forget.
Show me, I remember. Involve me, I understand. (Old Chinese proverb)
The described context in paragraph 2.2 asks for involvement of a variety of representative actors in a process for spatial development. This means that a great responsibility is placed upon governmental organisations in their new role as facilitators of actor dialogue, their task should be to make actors to better understand problem situations, to develop possible action alternatives and to undertake collective decision-making and action (Maarleveld et al., 2005). Although many national, provincial and regional policy plans proclaim the need for an integrated and interactive approach to spatial issues, it seems rather ambiguous for governmental actors to deal with this kind of pluriformity. A causal factor is that governmental actors on the one hand need to keep to legal instruments and policy frameworks with limited space for creativity, but on the other hand want to take a more reserved role where non-governmental actors have a certain freedom - the governmental credo is to ‘steer on main lines’, or ‘sturen op hoofdlijnen’ but in practice the government seems to be too much occupied with regulatory details.
In the governmental quest for a new policy culture, a few characteristics are mentioned by Aarts and Van Woerkum (2002). Firstly, this new culture attaches importance to local differences meaning that every issue has its own contextual characteristics. Secondly, because of complexity of spatial issues there’s a need for flexible solutions rather than fixed goals. Thirdly, more attention is paid to relational issues and processes; gaining trust and mutual understanding in a common task. The rationale behind these three facets is that a focus on this so-called pluriformity makes networks more able to deal much more flexible with spatial developments. In this new policy culture the quality of the process becomes increasingly important, this leads to a bigger attention to process goals such as:
• How do actors come to understand each other’s views, interpretations, and preferences?
• Do they actually understand each other?
• How do participating actors perceive the creative atmosphere in the process?
• How do participating actors perceive the created mutual understanding (Aarts and Van Woerkum, 2002:41)?
In an interactive process citizens are encouraged to play a more active role in spatial transitions. This does not mean that citizens only criticize existing plans, but that they deliver
ideas to contribute to the planning process. In that sense, citizens are a source of knowledge
and they become responsible for the interactive process (Edelenbos and Monnikhof, 2001). Involvement of citizens will raise when they have the feeling that their (different) opinions are acknowledged in the process and when they are taken serious. The opposite, when citizens’ opinions are not acknowledged, will cause aggression and confrontation (Aarts and Van Woerkum, 2002). The effects of stimulating interactivity on spatial planning and decision process are summarized by Edelenbos and Monnikhof (2001). Interactive processes are supposed to increase:
• Social support for spatial transitions;
• Quality of decisions;
• Speed of decisions;
• Position and reputation of politicians;
• Representation of different participants.
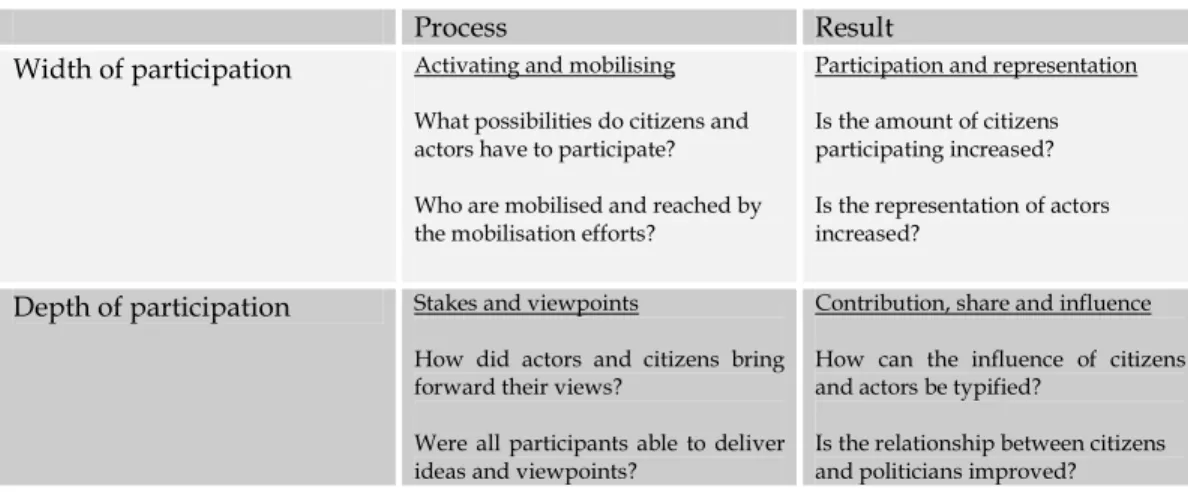
A clear overview of the elements to evaluate participation in interactive processes is given by Edelenbos and Monnikhof (2001). When relating to the effects of the use of geo-visualizations, this scheme can function as a useful tool to evaluate the effectiveness of geo-visualizations:
Table 1 Elements to evaluate participation in interactive processes (Edelenbos and Monnikhof, 2001)
Efforts to enhance actor dialogue and involvement are often characterized as social learning processes. Social learning is a social scientific term identifying the learning processes that are taking place between participative systems like groups, networks, organisations and communities, in surroundings that are new, unexpected, insecure, conflictuous and hard to predict (Wildemeersch et al., 1997). This means that the parties involved slowly develop overlapping – or at least complementary – goals, insights, interests and starting points (Röling, 2002), and also build mutual trust and feelings of dependence and responsibility. Social learning is about the development of different perspectives on reality through interaction with others. According to Leeuwis (2003:5) there are four tasks that are of great importance from the point of view of social learning:
• Making the invisible visible;
• Organising comparisons between different contexts; • Setting up experiments;
• Facilitating exploration.
In our opinion, geo-visualizations belong to the variety of communicative methods that exist to support social learning. In this respect we regard the increased use of geo-visualization as a
Process Result
Width of participation Activating and mobilising What possibilities do citizens and actors have to participate? Who are mobilised and reached by the mobilisation efforts?
Participation and representation Is the amount of citizens participating increased? Is the representation of actors increased?
Depth of participation Stakes and viewpoints
How did actors and citizens bring forward their views?
Were all participants able to deliver ideas and viewpoints?
Contribution, share and influence How can the influence of citizens and actors be typified?
Is the relationship between citizens and politicians improved?
communication tool that continues to be developed in order to contribute to spatial planning and decision processes. Until so far, geo-visualizations as discussed in the former paragraph have been used in various experimental settings, but it is unclear what the effects on planning and decision processes exactly are. In chapter 3 we will speculate upon the expected effects and present a literature review on existing knowledge on this subject. Before getting there, we devote a paragraph to a more philosophical exploration of the power of imaging.
2.4 THE MEANING OF GEO-VISUALIZATIONS FOR PARTICIPATORY SPATIAL PLANNING
The picture is worth a thousand words. (Old Chinese proverb)
The power of imaging is all about improving communication between actors in interactive processes, we here present some major needs and challenges derived from literature and practice to benefit optimally from the use of geo-visualizations.
2.4.1 Images and interaction: needs and challenges
Speculating about the effects of geo-visualization in spatial planning and design processes the project consortium quickly realised that the power of geo-visualization lies in the image itself. ‘Seeing is believing’ can be put forward as the legitimization of geo-visualization. By seeing direct consequences of an intervention in a certain area in a virtual image, actors might all interpret the change differently, however they do use the same language to communicate with, namely the image itself. The same argument is used by King et al. (1989), who suggest that visualization is the key to effective public interaction because it is the only common language to which all participants within the same cultural context - technical and non-technical - can relate. In urban planning, a number of authors have studied the cognitive effect of 3D images in the planning process. Traditional 2D models are known to demand a great effort: the viewer first builds a conceptual model of the image before it can be analysed, which according to Bulmer (2001) “can be an arduous task for even the most dexterous mind”. 3D Models on the other hand can stimulate spatial reality and allow the viewer to more quickly recognize and understand changes in elevation (Bulmer, 2001: 7). Langenorf (1992, cited in Bulmer, 2001) has formulated three premises on which use of visualizations in urban planning are based:
• To understand nearly any subject or consequence it is necessary to consider it from multiple viewpoints, using a variety of information;
• Understanding complex information about urban planning and urban design may be greatly extended if the information is visualised;
• Visualization aids communication with others (Langenorf, 1992, cited in Bulmer, 2001). Geo-visualizations make it possible to explore a spatial environment by simply navigating through the area. This makes it much easier for participants without any planning experience to relate the visualized information to the real world (Maarleveld et al., 2005:5). In cognition science four types of functions of media used for visualization of spatial information have been described (Maarleveld et al., 2005): The function of demonstration refers to using media to give a realistic picture. The function of putting into context should support the user to put the detailed information against a bigger (spatial) context and may help the user to identify and position the given information. The function of construction is related to the creation of complex mental models by the user in order to understand information units and relationships. Graphs, diagrams or abstract layers are suited for this function. The function of
motivation lastly refers to media intending to arouse the user interest and attention. This can
be achieved by for example animations and interactive objects.
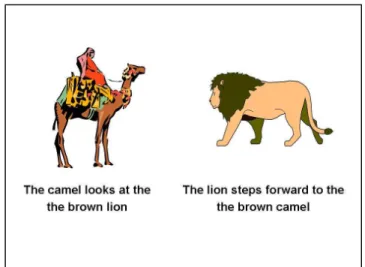
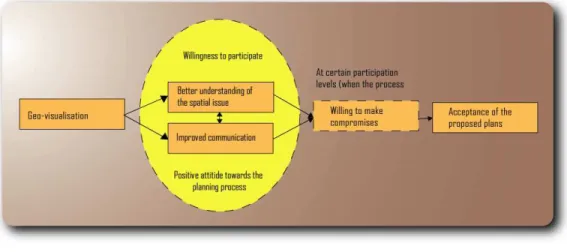
Figure 3 The power of images proved (PSPE, 2005b)
The three premises and four functions mentioned above refer to the effects one wishes to achieve in a spatial planning process. However, an important question is in which planning phases geo-visualizations would best fit. And furthermore, in what kinds of interactive setting geo-visualizations will show full advantage. Therefore we will first make some remarks about the nature of spatial planning. According to Van den Brink (2005), the starting point in every planning process is that there is a spatial problem that must be solved. Problem identification is then followed by the determination of the planning objectives. The next step is to develop scenarios that show alterative futures. These alternatives will be evaluated and decided upon by the relevant authorities. In each step there is room for public interaction. Also, in each step of the process different geo-visualization tools can be used, depending on the specific situation. In other words: geo-visualization is about creating an understandable message that is able to stimulate the dialogue. “It goes without saying that later in the process more detailed data and information will be needed. A systematic analysis of the relation between
planning process and public participation is therefore necessary,” according to Van den Brink
(2005).
A first step in defining the use and benefits of geo-visualizations in interactive processes has been made by Bulmer (2001), this author distinguishes different types of visual communication (simulating, experiencing and communicating) and user interaction (passive and active) in urban planning processes to support the public at large and particular interest
groups. The direct benefits for particular planning phases however are not given in this model.
Table 2 Different types of visual communication and user interaction (Bulmer, 2001:8)
Passive Active
Simulating Modelling: e.g. simulation on the desktop
Modelling and changing: e.g. immersive Virtual Reality models of cities
Experiencing Observing: e.g. exploring maps, designs Engaging and changing: e.g. immersive & web based worlds
Communicating Displaying: e.g. reading web sites Delivering: e.g. making decisions about services
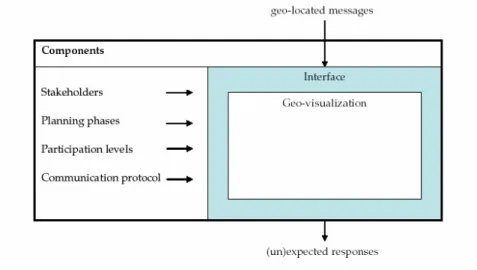
An effort to structure the construction and use of geo-visualizations for participatory spatial planning processes is initiated by Hoogerwerf et al. (2006). The authors will develop a conceptual framework by integrating the theoretical fields of spatial planning, participatory planning and communication. This framework will be based on the view that geo-visualizations should be adjusted to the specific planning issue and context in order to communicate spatial information effectively and efficiently to all actors via these geo-visualizations (Kingston, Carver et al., 2000; Al-Kodmany, 2002; Bishop and Rohrmann, 2003). The intention is that such a framework could in the future result in one of more theories on how to use geo-visualizations to communicate spatial information and spatial transitions to both professionals and lay people. The authors describe several criteria for the effectiveness of geo-visualizations divided into six components: actors, planning phases, participation levels, communication protocol, interfaces, and geo-visualizations. A brief summary and a visual representation of the tentative framework is given below:
Figure 4 Visual representation of the conceptual framework (Hoogerwerf et al., 2006)
In terms of the actors-component, criteria of geo-visualizations are:
• Geo-visualizations need to be able to express the preferences, visions and interpretations of the different groups of actors;
• Geo-visualizations need to make explicit differences and similarities between these preferences of different actors;
• Geo-visualizations need to facilitate the ease of annotating the process to allow actors to comment on value judgments, opinions definition and choice of alternative courses of action, interrupts, negotiations etc.;
• As actors are involved at different participation levels, the content and the graphic variables of the visualization will be affected;
• Geo-visualizations need to be understandable to different actors which work with different ontology’s to communicate;
• Geo-visualizations need to be as accessible as possible to prevent that inexperienced actors will be intimidated by the geo-visualizations;
In terms of the planning phases-component, geo-visualizations should support the different activities specific for planning routines. This means that the information, which is typically used as input for or produced as output of the activity, is visualised and processed appropriately:
• In the phase of problem recognition, the geo-visualization should facilitate the analysis of opportunities and threats of different natures;
• In the phase of problem diagnosis, the geo-visualization should facilitate the determination of cause-effect relationships, including non-physical elements;
• In the design phase, the geo-visualization should facilitate the creation of different scenario’s or solutions to the problems, the storage and retrieval of different versions and the possibility to leap back and forward between different scale levels;
• In the evaluation phase, the geo-visualization should facilitate the comparison between different scenario’s;
• In the authorization phase the geo-visualization should reflect the influence of the information which was provided for by different actors;
• Some activities occur in every planning phase, geo visualizations should support activities like voting, recollecting data from the past and the integration of different types of media (land-use maps, photo’s or video’s).
In terms of the participation levels-component, there are five levels of participation: informing, consulting, advising, co-producing and co-deciding. The input actors will give needs to be facilitated by geo-visualizations in every level of participation. Furthermore, a geo-visualization should make clear the relation between the actors and their behaviour to create a social framework since not all actors are involved during the whole length of the process.
In terms of the communication protocol-component, the authors describe several communicative settings varying from actors being at the same place at the same time (e.g. a meeting) to actors being at a different place at a different time (e.g. an Internet forum). These protocols impose several conditions to geo-visualizations:
• Geo-visualizations can support different time protocols by allowing users to anchor or annotate arguments to places in the geo-visualization and to visualise the arguments made about particular places (argumentation maps);
• Same place protocols can be supported by geo-visualizations, which can be displayed on single large display devices with which the actors can interact simultaneously. An important disadvantage is that these big and heavy devices however are not moveable;
• Different time, different place protocols require geo-visualizations that support the use of email lists, Internet discussion groups and plan reviews via websites.
The interfaces-component of the framework describes the devices, which facilitate various forms of interaction between actors and geo-visualizations. These devices provide the opportunity to give feedback on the proposed visualizations. Conditions imposed to geo-visualizations by interfaces are:
• A geo-visualization can be displayed and interacted with via different interfaces. Each interface will facilitate one or more forms of interaction. The forms of interaction are: navigation, selection-manipulation-elaboration-explanation, immersive experiences, interaction with simulation model, and interaction with other actors.
• Ideally geo-visualizations should facilitate the form of interaction, which maximizes the engagement of the targeted actors. Most likely, however, the selection of the interface will be restricted by practical conditions, such as the availability of the hard- and software with which the interface can be constructed.
In terms of the geo-visualizations–component, Hoogerwerf et al. (2006) describe the knowledge deficits in the field of the effectiveness of geo-visualizations. This is due to what Slocum et al. (2001) describe as the broad range of users that need to perform a broad range of tasks with geo-visualizations (Slocum et al., 2001). Another difficulty is the broad variety of cognitive issues that are involved when 3D geo-visualizations are used as communication tools (Bill, Dransch et al., 1999; Dransch, 2000; Fairbairn, 2001; Yun, Yufen et al., 2004). A participatory spatial planning process imposes specific conditions to geo-visualizations, as described in the previous components, related to both these issues. Lammeren en Hoogerwerf (2003) state that geo-visualizations can support interaction in the 3D virtual environment (orientation, movement, navigation, explanation, elaboration and manipulation) and
interactionof the 3D virtual environment (the user is able to define the settings of the viewer
(interface) mode that could influence the way the 3D environment is experienced by the user). Interaction also deals with the ability for users to give feedback on proposed transitions via text messages, a forum, or voting systems. In current viewers of applications for geo-visualizations, some of these interaction methods are included. However, there is no overview available about the interaction methods that are required for users in specific planning phases or participation levels when they are performing a certain task in the planning process.
Two important features of geo-visualizations seem to be the degree of detail or realism in the represented objects and the intelligence of objects. The level of detail greatly influences the perception, opinion and decision on proposed spatial transitions of the landscape (Sheppard, 2001; Al- Kodmany, 2002). Therefore Hoogerwerf et al. (2006) argue that research on how to adapt the level of detail of geo-visualizations to the users as well as to the tasks they have to perform is extremely important. Furthermore, the intelligence of geo-visualizations is an important feature. Intelligence refers to the extent to which objects in the virtual environment have a certain behaviour that corresponds with objects’ behaviour in the real world. An example of object intelligence is the way users are allowed to interact with the environment and its individual objects. Some geo-visualizations provide users the opportunity to select and manipulate the position of appearance of objects, and therefore are able to give feedback on the proposed transitions or propose themselves alternative transitions. It seems necessary to research which specific intelligence is required in geo-visualization for specific actors and planning tasks (Hoogerwerf et al., 2006).
2.4.2 ICT providing increased opportunities to achieve involvement
The Internet is playing a tremendously crucial role in today’s society. Recent statistical research shows that in 2005 nearly 80 percent of Dutch households have access to the Internet. Of this Internet use, one third is on the account of young people in the age of 12 to 25. Also, governmental services are increasingly offered online (CBS, 2006). A random exploration of Dutch spatial issues on the Internet will give many informative websites about national, provincial or municipal spatial transitions. Moreover, in election periods citizens’ are encouraged to use the Internet to define their voting choice or participate in online referenda. This tendency is also called e-democracy: democracy via the Internet. At least three possibilities for e-democracy are to be distinguished: representative (elections), consultative (referenda) and participatory (discussion) (Pieters & Becker, 2005). One will also find some municipalities presenting their local land use plans (‘bestemmingsplannen’) online, however very few of them offer interfaces for bringing reactions to these plans online. In an interview, Arend Ligtenberg – researcher geo-informatics at Alterra – says in this respect:
“Interactive websites hardly exist, and such websites combined with geo-visualizations are even rarer. Often there is a possibility to react by email but not with the aim to participate in design or decision. Furthermore, the official authorities are not yet equipped for this, one does not know how to deal with
From literature we can learn that the expectations of the Internet are high. According to Doyle, Dodge and Smith (1998), GIS and other related technologies through public participation can be seen as a precursor to the role the World Wide Web could take as a distribution mechanism within any process where consultation may be required. “Virtual Reality now embraces a variety of systems from the totally immersive, centralized, single user tools with which it began, to the entirely decentralized, remote and anonymous technologies spawned by the
net,” says Daniel Bulmer in the Online Planning Journal (2002). It is exactly the anonymous
character of the web that Bulmer finds most promising. Traditional methods of public participation quite often involve a confrontational atmosphere that can discourage participation. Also the restricted time and the actual geographic location can restrict the possibility of widespread attendance. In participation over the Internet, barriers like time, location and confrontation fade (Bulmer, 2001). Not only written participation should be facilitated on the Internet; geo-visualizations play a very important role in communicating with the public. Geo-visualizations transform abstract information into easily understandable graphics and above all geo-visualizations should be used to visualise people’s perceptions in order for these perceptions to become dynamic and interactive and more meaningful (Al-Kodmany, 2001).
In sum, the Internet is regarded among scholars as a very suitable tool to organize, to present, to communicate and to interact about spatial information. It is supposed to make spatial planning more democratic, more accessible and more bottom-up. What seems to be missing however is a true web based interactive platform in which geospatial information is visualised to achieve better participation, better process results and in the end a better spatial transition. In this regard, the recent launch of Google Earth on the Internet is received among researchers and policy makers as very promising. As illustrated in the journal ‘GIS Development’ (Gupta, 2005):
“[…] Google had simply given access with Google Earth. Access to geographic information in a fairly
democratic way in the hands of everyone (having Internet), without discriminating on the basis of who
is who – government, staff, academician, student, NGO, private sector, defence staff, etc. It has made any restrictive regime – of withholding geographic information – a big joke.”
The lessons learned in this paragraph are twofold. Firstly, geo-visualization tools on the Internet are expected to yield many benefits in terms of communication and participation, however little research on the true effectiveness is available. Secondly, increasing development and usage of such tools, like Google Earth, illustrate the popularity, usability and accessibility of such tools, it is however obvious that widespread use of the geo-visualization tools in spatial planning is not yet institutionalised.
2.5 DRAWBACKS
In the former paragraphs we have seen that geo-visualizations will expectedly play an increasing role in policy developments, communication and interaction among government and society, and in the use of information technologies. There are however some issues to consider when discussing the effectiveness of geo-visualizations, issues which need to be taken into account while doing research or while planning interactive processes. These issues will be touched upon briefly.
In terms of discussing the technical requirements of users of geo-visualizations, it is important to realise that users do not know what they require because the technology is opening up new opportunities and possibilities, which generate new requirements all the time. The fact is that citizens may have no requirements because they don’t have a clear idea of what the technology may offer them. They have needs, or hopes, regarding an improvement of their quality of life rather than requirements or opportunities for particular technologies (Intelcities, 2004). A central asset in this discussion is also the way in which
online services are divided across social groups and their respective levels of income: “Online developments may be technically possible, but the socio-economic structure of such services should lend
itself to equal access”(Intelcities, 2004). Furthermore, we should not take for granted that actors
are stimulated by the anonymity of the Internet: research by Leeuwis et al. (1997: 23) has shown that during an experiment (held in 1996) to increase citizen participation by using an Internet forum the participants of the debate were very eager to know the background of the people. It seems also important to make a distinction between comments and opinions made personally and comments and opinions made on behalf of the organisation (Leeuwis et al., 1997: 83). From a technical as well as a psychological perspective we can conclude that special attention in an open debate supported by the Internet should be given to 1) accessibility of the technology, 2) skills to use the technology and 3) the representation of social actors on the Internet.
In terms of the assumed discursive power of visualization, it is according to Van Herzele (2005) often overlooked that the use of maps (GIS) are in fact a product of a particular mode of thought in geography. In her book, Van Herzele argues that maps are practices of knowledge-power, they actually are not so value neutral. As an abstraction of reality, cartographic ‘facts’ bring some aspects to the forefront and leave other aspects in the background. As such, through selecting and emphasising, they may have some political effect. Furthermore, one should take into account the risk of putting to much detail in a GIS image. GIS users are tempted to add more parameters to the system to reflect more information in a cartographic image. As a consequence, the indicator system won’t fulfil its main function any more: simplifying communication. An indicator system full of details is only meaningful to experts and not to the community itself. What Van Herzele is saying is that planners should not only rely on GIS images in planning processes. GIS can serve as a proactive way of assessing the effects of possible options of spatial development from multiple perspectives by means of GIS based simulations, however these multiple perspectives originate from people who express different identities. Van Herzele (2005) says in this respect:
“Planners need to go beyond the identification of interests and preferences and should attempt to discover why people come to make their claims. Attention should be paid not only to the ways in which issues are discussed, but also to the substantive issues in question, as well as to the cultural identities that influence people’s ways of giving meaning, value and expression.”
To summarize, there are two aspects of applying geo-visualizations that planners need to be aware of in interactive processes:
1. Internet based interactive processes could exclude certain interest groups from participating due to technological and psychological barriers, therefore attention needs to be paid to: accessibility, skills and representation of social actors.
2. Geo-visualizations are not value neutral; care should be taken not to reduce possible alternatives because of fixed images. Geo-visualizations require flexibility and interactivity to expose underlying cultural identities of actors.
2.6 CONCLUSION
In this chapter we touched upon some societal issues that directly relate to the increasing use and development of, and need for geo-visualizations in participatory spatial planning. By trying to bridge communication science, policy science, spatial science, cognitive science and geo-information science it becomes clear that a lot of work has been done already. However, there is still a lot of work to be done. By means of conclusions, four key concepts derived from this chapter will be given.
Governance: balancing between complexity and simplicity
The expected increased use and development of web based interactive geo-visualizations in spatial planning issues is a logical move forward in dealing with the complexity of spatial developments; geo-visualizations simplify spatial settings in a realistic way and make spatial scenarios understandable for lay people.
Interactivity: balancing between process and results
Web based interactive geo-visualizations are good supportive tools for generating, sharing and reflecting on different interpretations among actors and will subsequently contribute to achieving better process goals and in the end to achieving better project results and a broadly carried acceptance of the spatial transition.
Information society: balancing between transparency and commitment (or social carrying capacity) The democratic, accessible and bottom-up character of the Internet will support wider commitment and mutual understanding in spatial planning processes due to a combination of text and images on an interactive web based interface. Transparency in spatial planning therefore is highly valued but often not yet taken for granted.
Social learning: balancing between learning by doing and institutionalisation
Scarce presence of and experience with web based interactive geo-visualization tools limit substantial use of such tools among actors, therefore a knowledge transfer point containing best practices, guidelines and experiences in combination with hands-on training sessions in pilot areas can benefit the knowledge dissemination.
In the following chapter, a scientific exploration of the effectiveness of geo-visualizations in interactive spatial planning processes is given.
3
G
EO-V
ISUALIZATION ANDI
NTERACTION:
WHAT IS KNOWN?
3.1 INTRODUCTIONThis chapter gives an overview of expected effects of geo-visualizations on the participatory spatial planning process and the actors that are involved in this process. By means of a literature study, the available knowledge about these effects will be described. Several research methods and techniques from scientific literature will be distinguished and described. Moreover, this chapter will focus on promising research methods to study specific effects of geo-visualizations in the future.
3.2 GEO-VISUALIZATION EFFECTS IN LITERATURE
The aim of using geo-visualizations is to influence participatory spatial planning and decision-making processes in a positive way. This positive effect that geo-visualizations have or are expected to have could be on the process itself as well as on the actors who are going to reflect on the proposed plans. The effects on the planning process itself can of course not be seen separated from the effects on the actors as these actors are part of the planning process itself. However, for the description in this chapter they are taken apart. Several effects of geo-visualizations, which are expected or demonstrated in case studies described in literature, will be described in this paragraph. In scientific literature, a huge number of papers can be found in which geo-visualizations are studied in or for participatory spatial planning. Most of these papers focus on progress or outcome of the planning issue, or solely on the technical aspects of the constructed geo-visualizations. Only a limited number of papers pay attention to effects that geo-visualizations have had on the process and/or the actors involved in the process. And within this limited number of papers, the type of geo-visualizations that is used varies enormously. In this paragraph, scientific literature is reviewed to gain knowledge about what is already known in scientific literature about the effects of geo-visualizations. The literature that is reviewed is carefully selected, based on the geo-visualization types that were used. This paragraph will only deal with recent studies that used visualizations that are static or dynamic two-dimensional or three-dimensional visual representations of geo-data and have a link with participatory spatial planning. In paragraph 3.2.1, we will focus on the effects that geo-visualizations are expected to have on the actors; paragraph 3.2.2 describes the expected effects on the whole participatory spatial planning process. By doing this, knowledge deficits will become clear.
3.2.1 Geo-visualization effects on actors
One of the goals of using geo-visualizations in the spatial planning process is to improve the communication between the actors in the planning process, resulting in a plan that is widely accepted by most actors participating in the process. In literature is assumed that geo-visualizations will improve the communication in the process (Haklay, 2001; Harrison and Haklay, 2002; Manoharan et al., 2001) and therefore create widespread knowledge about the plans. It is not so easy to simply list the effects of the use of geo-visualizations in the planning process because there are multiple cause and effect relationships. The one effect will cause another and so on.
In literature is suggested that, in particular 3D, geo-visualizations are more effective and efficient for actors of the planning process to recognize the area under study and understand proposed spatial changes rather than with 2D static maps (Al-Kodmany, 2001; Sarjakoski, 1998). The improved understanding of the proposed plans leads to several side effects. For example, another effect of geo-visualization is that the citizens or actors become more involved in the planning process. This is due to the fact that the actors can respond to the plan (by Internet) and get the feeling that they are actually contributing to the process (Al-Kodmany, 2002). This will cause them to have a positive attitude towards the planning process. This