Document downloaded from:
http://hdl.handle.net/10459.1/65978
The final publication is available at:
https://doi.org/10.1071/AN17070
Copyright
1
Carcass lean-yield effects on the fatty acid and amino acid composition of Duroc pork and its1
technological quality after vacuum-ageing
2
Running head: Carcass leanness effects on pork meat quality
3
J. Álvarez-RodríguezA, R. Ros-FreixedesB, S. GolA, E. Henríquez-RodríguezA, R.N. PenaA, Ll.BoschC, J.
4
EstanyA, F.VilaróD and M. TorA,E
5
ADepartment of Animal Science, University of Lleida-Agrotecnio Center, Universitat de Lleida. Spain
6
B
Present address: The Roslin Institute and Royal (Dick) School of Veterinary Studies, The
7
University of Edinburgh. United Kingdom
8
CDepartment of Chemical and Agricultural Engineering and Agrifood Technology, Universitat de Girona.
9
Spain
10
DScientific-Technical Services DATCEM, Universitat de Lleida. Spain
11
ECorresponding author. Email [email protected]
12
Abstract
13
Eighty purebred Duroc castrated male pigs slaughtered at 210 days of age were used to evaluate the
14
effect of lean-yield (European Union carcass grading based on lean content; or R, O and P classes) on the
15
fatty acid and amino acid composition of raw pork (day 1 post-mortem), and technological meat quality
16
after vacuum ageing up to 4, 6 and 8 days.
17
A strong relationship between slaughter weight and carcass lean-yield was observed. Carcasses graded
18
as having a lower lean yield were fatter with higher intramuscular fat (IMF) concentration, and
19
differences in proportions of fatty acids with increased MUFA and decreased PUFA percentage, but
20
without adverse effect on ultimate pH, drip loss or colour attributes. There were no effects of carcass
21
lean-yield on amino acid composition of raw pork, with valine being the limiting amino acid relative to
22
lysineby about 30-35%. Vacuum ageing did not reduce the shear force of raw pork which may not be
23
indicative of cooked pork response. The lipid oxidation had an inverse relationship with the PUFA
24
content of each pork class, and it did not increase due to vacuum ageing up to 8 days. Meat fatness did
25
not affect its amino acid balance and technological quality (colour, drip loss, shear force and lipid
26
stability) but modified IMF composition.
27
Additional keywords: nutritive evaluation; pigs; amino acids; intramuscular fat.
2
Introduction29
The Duroc swine breed has been largely used as a purebred or in sire lines to produce pigs intended for
30
dry-cured and premium pork products, since it has a greater ability to accumulate intramuscular fat
31
(IMF) than other common breeds in European Union such as Pietrain (Latorre et al. 2009).
32
A higher content of IMF improves the organoleptic characteristics of pork products (Fonseca et al.
33
2015). High levels of subcutaneous fat involve higher production costs and worsen the commercial
34
grading of carcasses (Čandek-Potokar & Škrlep 2012). Thus, backfat content should be controlled
35
without penalizing excessively the IMF characteristics. Therefore, certain breeding programmes tend to
36
standardize carcass characteristics by reducing backfat thickness while maintaining steady IMF and oleic
37
acid contents (Ros-Freixedes et al. 2013). Due to variation in these traits, carcasses in a given population
38
are not equally classified from a commercial view. It has to be taken into account that only some carcass
39
parts (ham and shoulder) are intended for the production of dry cured products and, therefore,
40
selection on primal cuts aiming at production of dry cured products could modify correlated
41
characteristics of the fresh meat from the rest of retail cuts (i.e. loin). In addition, it is now possible to
42
incorporate the use of genetic markers that complement traditional methods of selection of the quality
43
of fat (Estany et al. 2014).
44
After carcass processing, fresh pork may be normally aged for a short period of time to improve meat
45
tenderness, but this practice should not affect negatively other meat attributes such as colour or lipid
46
oxidation. Pork ageing is conducted usually by exposing meat cuts in air or by vacuum packaging. Earlier
47
studies observed 50% reduction of pork meat hardness during the first 2 days and 80-90% reduction of
48
hardness after 4-6 days of vacuum ageing (Dransfield et al. 1981; Rees et al. 2002). However, in these
49
cases the meat came from purebred or hybrid genotypes commonly used in maternal lines (Landrace
50
and Large-White), with usual IMF levels below 30 g/kg.
51
This study investigated the effect of carcass grade (R, O and P classes, where R has the greatest and P
52
the lowest lean content) on the chemical composition (fatty acids and amino acids) of pork with IMF
53
above 30 g/kg, and their colour parameters, drip loss, Warner-Bratzler shear force, and lipid stability
54
after vacuum ageing for one, three, five and seven days.
55
Material and methods
56
Study design
57
A total of 80 barrows with 210 days of age (standard deviation ± 5 days) were selected at random from a
58
purebred Duroc population (Selección Batallé, Riudarenes, Girona). The pigs were raised in two batches
3
(spring-summer 2013 and winter-spring 2014, n=40 per batch, 8 pigs per pen), and they were fed the
60
same diet ad libitum. The ingredients and chemical composition of diet from 180 to 210 days of age are
61
shown in Table 1.
62
On-farm and abattoir measurements
63
The pigs were weighed individually at 180 and 210 days of age. The average daily gain during the last
64
month of the finishing period was calculated by difference between live-weights against time. On the
65
day before slaughter, feed was withdrawn for 12-24 h and the pigs were transported 30 km to a
66
commercial abattoir, where they were kept in lairage for 3 h with full access to water but not to feed.
67
The pigs were stunned using CO2 (88%) (Butina ApS, Holbaek, Denmark), exsanguinated, scalded,
68
skinned, eviscerated, and split down the midline according to standard commercial procedures. The
69
animal management was in compliance with European welfare guidelines (Directive 2010/63/EU).
70
The hot carcasses were individually weighed to calculate the dressing out proportion. Backfat thickness
71
between ribs 12th and 13th assuming rib 15th was the last rib and fat depth at Gluteus medius muscle
72
on the carcass midline (skin included) were measured using an on-line ultrasound automatic scanner
73
(Autofom®, SFK-Technology, Herlev, Denmark). The carcass lean content was estimated using the
74
Spanish officially approved equation based on ultrasound measured variables (BOE, 2011) and carcasses
75
were then graded into standard categories based on European Union scale: R (45-50% lean content,
76
n=18), O (40-45% lean content, n=28) and P (<40% lean content, n=34).The carcasses were genotyped
77
according to Estany et al. (2014) to assess segregation of the single nucleotide polymorphism
78
AY487830:g.2228T>C in the promoter region of the stearoyl-CoA desaturase (SCD) gene, of which the T
79
allele enhances 18∶1/18∶0 and, consequently, the proportion of monounsaturated to saturated fat
80
without affecting total fat content.
81
The carcasses were refrigerated by gradual reduction of their internal temperature: 16 ºC (1st hour
post-82
mortem), 8 ºC (2nd hour), 4 ºC (3rd hour), 2 ºC (4th hour) and 2 ºC (5th hour), and kept at approximately 4
83
ºC until 24 h post-mortem. At 24 h post-mortem, carcass length from the posterior edge of the
84
symphysis pubis to the anterior edge of the first rib was measured. In addition, ultimate pH of meat was
85
measured between ribs 12th and 13th (assuming rib 15th was the last rib) with a pH-meter equipped
86
with a spear-tipped probe (Testo 205, Testo AG, Lenzkirch, Germany). The carcasses were subsequently
87
processed and ham weight was recorded. A section of 5-cm of length (approximately 200 g) of
88
Longissimus thoracis muscle was excised at the 3th-4th last rib area and placed in individual
vacuum-89
packaged plastic bags at 4°C for transportation to laboratory.
90
Three slices were cut from each L. thoracis muscle sample to evaluate fatty acid and amino acid
91
composition of raw pork (1 cm-long), drip loss at 24 h post-mortem (1 cm-long), tenderness and lipid
4
oxidation during ageing for 8 days (3 cm-long). This last thickest slice was divided into 4 homogeneous
93
pieces; the first was used to evaluate colour at day 1 (T1) while the remaining three pieces were
94
vacuum-packaged and stored in the dark at 4 ºC for 4, 6 or 8 days (T1; T4; T6; and T8, respectively). The
95
four piece samples were used for colour measurement before subsequent freezing at -20 ºC until
96
concurrent analyses of tenderness and lipid oxidation. When required, the sliced L. thoracis samples
97
were thawed in the vacuum-packaged bags for 24 h at 4°C, removed from packages, blotted dry for 15
98
min, and weighed. Thawing loss was calculated by dividing the difference in weight between the fresh
99
and thawed samples by the initial fresh weight.
100
Instrumental meat quality analyses
101
The Longissimus thoracis muscle colour was measured on polystyrene white trays after 1 h of blooming
102
the inner surface with a Konica Minolta CM-700d spectrophotometer (Konica Minolta Sensing Inc.,
103
Osaka, Japan) in the CIELAB space (CIE 1986) with a measured area diameter of 8 mm, including specular
104
component and a 0% ultraviolet, standard illuminant D65, which simulates daylight (colour temperature
105
6504 K), observer angle 10º and white calibration. The Commission Internationale de l’Éclairage (CIE)
106
lightness (L*), redness (a*), and yellowness (b*) colour-space values were reported as the average of
107
three randomly selected readings taken on each slice without any covering film, and mean values were
108
used for statistical analysis. Hue angle (H*) was calculated as: H*= tan-1(b*/a*) × 57.29, expressed in
109
degrees, whereas chroma (C*) (colour intensity, also known as saturation index) was calculated as: C*=
110
√ a*2 + b*2. In addition to these parameters, the reflectance spectra were collected from 400 nm to
111
700 nm at every 10 nm. The relative metmyoglobin (MMb) content was estimated through
Kubelka-112
Munk ratio K/S572/525 (Hunt et al. 1991), which decreases when pigment content increases. The K/S
113
values at 572 nm and K/S at 525 nm were calculated by linear interpolation.
114
Drip loss at 24 h post-mortem was determined by centrifugation, according to a modification of the
115
method used by Kristensen & Purslow(2001). Briefly, raw meat samples were weighed, cut carefully
116
with a scalpel to avoid slight water losses, and transferred to centrifugation tubes which allow
117
separating meat from exudate during centrifugation. Centrifugation losses were calculated as the
118
percentage of initial sample weight (approximately 0.1 g).
119
Fatty acid analyses
120
Feed lipids were extracted using a chloroform/methanol/water mixture (2/2/1.8 v/v/v) (Hanson & Olley
121
1963). Feed and meat fatty acid (FA) methyl esters were directly obtained by transesterification using a
122
solution of boron trifluoride 20% in methanol (Rule 1997), followed by 2 h heating at 80ºC,
123
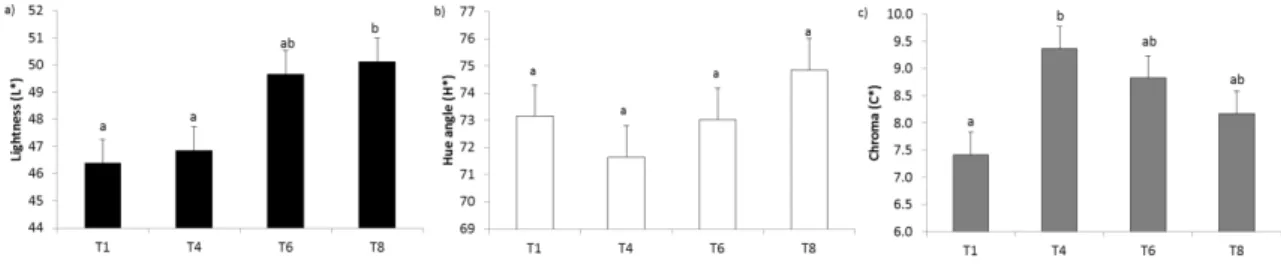
centrifugation at 2,500 rpm during 5 min and collection of the final supernatant. Analysis of FA methyl
124
esters were performed in duplicate by GC with a 30 m x 0.25 mm capillary column (Agilent DB-23,
5
Agilent Technologies, Santa Clara, United States) and a flame ionization detector with helium as the
126
carrier gas at 2 mL/min. The oven temperature program increased from 150-220 °C at 8 °C per min, and
127
the injector and detector temperatures were both 250 °C.
128
The quantification was carried out through area normalization after adding into each sample
1,2,3-129
tripentadecanoylglycerol as internal standard. IMF was calculated as the sum of each individual FA
130
expressed as triglyceride equivalents(AOAC 2000), following the methodology described in Bosch et al.
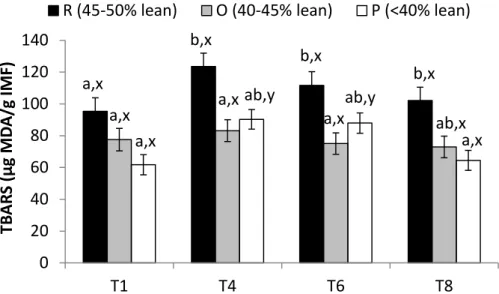
131
(2009). Fatty acid composition was calculated as the percentage of each individual acid relative to total
132
FA and expressed as g per 100 g FA. The proportion of polyunsaturated (PUFA) (C18:2n-6; C18:3n-3;
133
C20:2n-6; C20:3n-6; C20:4n-6; and C22:6n-3), monounsaturated (MUFA) (C16:1n-7; C17:1n-7; C18:1n-9;
134
and C20:1n-9) and saturated (SFA) (C10:0; C12:0; C14:0; C16:0; C17:0; C18:0; and C20:0) fatty acid
135
contents were calculated.
136
Nitrogen and amino acids analysis
137
After colour measurement, the sliced muscle sample was defatted, freeze-dried and pulverized using an
138
electric grinder and used for protein (N x 6.25) analysis by automated Dumas method (AOAC 2000).
139
The amino acids content of the muscle was determined by hydrolysis of samples (50 mg) which was
140
performed by incubating them under nitrogen in 5 mL 6N HCl for 12 h at 110ºC (Colgrave et al. 2008).
141
Hydrolysis tubes were cooled and centrifuged at 3,000 g for 30 min to remove particulate matter.
142
Aliquots of 25 µL of hydrolysate were evaporated under nitrogen steam and re-diluted in 500 µL of
143
water/acetonitrile (20/80 v/v) containing 250 ng/mL of Trans-4-Hydroxy-L-proline-2,3,5-d3 (Hpro-d3)
144
(CDN Isotopes, Sainte Foy La Grande, France).
145
Quantitation of individual amino acids was performed using a method described by Guo et al.(2013)
146
with modifications, as follows. An Ultra-High-Performance Liquid Chromatography (UPLC) Acquity
147
system (Waters, Milford, MA) holding a BEH Amide column (2.1 x 150 mm; 1.7 µm) was used. Solvent A
148
was 10mM ammonium formate in water with 0.15% formic acid; solvent B was ammonium
formate-149
saturated acetonitrile with 0.15% formic acid. The gradient included five steps. Initial conditions were
150
15% A and 85% B maintained for 3 min at 0.5 mL/min. Then, from 15% to 20% A in 3 min; from 20% to
151
24% A in 1.5 min; from 24% to 60% A at 0.6 mL/min in 1.5 min and maintained for 3 min. Then, initial
152
conditions were regained in 2 min. Weak and strong washing solvents were 80% acetonitrile and 20%
153
acetonitrile, respectively. Samples were filtered through a 0.20 µm hydrophilic PTFE membrane prior to
154
injection. The injection volume was 5 µL.
155
Quantitation of amino acids in the hydrolysate was performed by using a Multiple Reaction Monitoring
156
method (MRM) in a Waters TQD mass spectrometer (Micromass MS Technologies, Manchester, UK).
6
Briefly, the system was equipped with an ESI source operated in positive ion mode. The parameters in
158
the source were set as in Guo et al. (2013). Moreover, their MRM transitions were tested successfully in
159
our conditions for Phenylalanine, Leucine, Isoleucine, Methionine, Valine, Proline, Tyrosine, Alanine,
160
Threonine, Glycine, Glutamic acid, Serine, Aspartic acid, Histidine, Arginine, Lysine and Cistine. Cone
161
voltage and collision energy were optimized for each individual amino acid. An additional MRM
162
transition was determined for internal standard, Hprod3, obtaining the following values: 135.1/89;
163
135.1/70.9; precursor/product for quantitation and verification, respectively. Calibration curves were
164
constructed from a commercial amino acid standard mixture (Ref.: AAS19, Sigma-Aldrich, St. Louis, MO)
165
and diluted to a series of appropriate concentrations with water/acetonitrile (20/80 v/v) containing 250
166
ng/mL of Hprod3. Triptophan concentration was not determined because of under these conditions is
167
completely degraded (Fontoulakis & Lahm 1998). The results were processed using QuanLynx software
168
(MassLinx, Waters Corporation, USA). For hydroxyproline quantitation, Hprod3 was used as an internal
169
standard. The other amino acids were quantified from absolute response without internal standard. The
170
amino acids content of muscle are expressed as a proportion of crude protein content. The sums of
171
essential amino acids (EAA) and non-essential amino acids (NEAA) and their ratios out of the total amino
172
acid content were calculated according to the NRC (2012) classification. The following EAA were
173
accounted for: Lysine, Methionine, Threonine, Isoleucine, Valine, Phenylalanine, Leucine and Histidine.
174
The remaining analysed amino acids were considered as NEAA: Cistine, Arginine, Hydroxyproline,
175
Tyrosine, Alanine, Glycine, Glutamic acid, Serine, Proline, and Aspartic acid.Tryptophan concentration
176
was not determined as this would have required alkaline hydrolysis before quantitation.
177
Tenderness and lipid oxidation
178
The L. thoracis muscle samples analysed for tenderness and lipid oxidation were thawed in
vacuum-179
packaged bags for 24 h at 4°C, removed from packages, blotted dry for 20 min, and weighed. Samples
180
were then cut parallel to the long axis of the muscle fibres into rectangular cross-section slices of 10 × 10
181
mm and 30 mm length without cooking. Four slices per L.thoracis muscle sample were sheared
182
perpendicular to the fibre orientation, with a Warner-Bratzler device attached to a texture analyser
TA-183
TX2 (Stable Micro Systems Ltd, Surrey, UK) attached to a PC, and equipped with a 5-kg load cell and a
184
crosshead speed of 2.5 mm/s.
185
Lipid oxidation was assessed by thiobarbituric acid reactive substances (TBARS) analysis, following a
186
modification of the method of Buege & Aust (1978). Meat samples (5 g) were homogenised with 15 ml
187
of distilled water in falcon tubes at 13500 rpm during 15 seconds. Afterwards, 1 ml of the resultant
188
solution was transferred in duplicate to pyrex glass tubes and it was mixed with 2 ml of a solution
189
containing 15% trichloroacetic acid, 0.375% thiobarbituric acid and 1 N HCl.
7
The tubes were homogenized and incubated at 90 °C for 60 min in a water bath to induce colour
191
development. The absorbance at 540 nm was measured with a iEMS Reader MF spectrophotometer
192
(Labsystems Oy, Helsinki, Finland). A standard calibration curve was created with increasing
193
concentrations (from 0 to 100 μl) of malonaldehyde (MDA), which was obtained by hydrolysis of
1,3,3-194
tetraethoxypropane (TEP) in 100 ml of 1 N HCl. The tubes used for the calibrations, including the blank
195
and samples to be analysed, were put through the TBA procedure at the same time. TBARS values are
196
expressed as milligrams of MDA per gram of IMF.
197
Statistical analyses
198
The data were analysed with the Jmp Pro 11 statistical software (SAS Institute, Cary, NC, USA). Growth
199
performance, carcass traits, pH of L. thoracis muscle, centrifugation drip loss, IMF composition, protein
200
and amino acid contents were analysed with a standard least squares linear model including carcass
201
category (R, O and P) and batch (2 levels) as fixed effects. Colour attributes, thawing losses,
Warner-202
Bratzler shear force and TBARS data were analysed with a linear mixed model including, in addition to
203
the afore-mentioned effects of carcass category and batch, the effect of ageing time (T1, T4, T6 and T8)
204
and its interaction with carcass categoryas fixed effects using a repeated-measures analysis of variance.
205
The pig was considered as the random effect. The rest of first order interactions were removed from the
206
final models because they result not significant (P>0.05). To assess the potential role of genotype on
207
chemical composition and technological quality of carcass and meat traits, the SCD genotype effect was
208
also accounted for as a fixed effect in preliminary statistical analyses. . The level of significance was set
209
at 0.05. Differences (P<0.05) between least square means were assessed using the Tukey test. Values
210
are presented as least square means and their standard errors (S.E.). Pearson correlation coefficients
211
between adipose tissue traits and amino acid composition were obtained by using REML estimation
212
method.
213
Results
214
Three SCD genotypes were obtained: CC (n=12), CT (n=42), and TT (n=26). The most frequent SCD
215
genotype in all carcass grades was CT (13/18 in R; 13/28 in O and 16/34 in P carcasses). As expected, the
216
SCD genotype only affected the MUFA and SFA content of the meat (P<0.001) and did not have any
217
interaction with carcass grade or batch (P>0.05). The loin MUFA content increased linearly in CC, CT and
218
TT genotypes (492±4, 502±4 and 516±4 g/kg of fatty acids, respectively; P<0.05) whereas the SFA
219
content was greater in CC and CT compared to TT genotype (406±4 and 399±3 vs. 381±5 g/kg of fatty
220
acids, respectively; P<0.05).
221
Growth performance and carcass traits
222
8
Growth performance and carcass traits are shown in Table 2. Although all the pigs had similar age at
223
slaughter, the realized carcass groups came from pigs with different productive traits. The average daily
224
gain was lower in pigs leading to R (45-50% lean) and O (40-45% lean) carcasses than to P (<40% lean)
225
carcasses (P<0.05), but dressing out did not differ among groups (P>0.05). The ham weight was lower in
226
R and O compared to P carcasses (P<0.05). Backfat thickness at different anatomical locations (Gluteus
227
medius and 3rd-4th last ribs) was the lowest in R carcasses (P<0.05).
228
Technological traits and chemical composition of fresh meat
229
The technological traits and chemical composition of fresh pork (24 h post-mortem) according to carcass
230
lean-yield is detailed in Table 3. No detectable differences were observed in ultimate pH or
231
centrifugation drip losses among carcass groups (P>0.05). The crude protein content of pork was higher
232
while the IMF content was lower in R carcasses than in the rest (P<0.05). The fatty acid composition
233
differed among carcass groups, with R carcasses showing lower MUFA and greater PUFA content than
234
the rest of groups (P<0.05) and with similar SFA content across groups (P>0.05).
235
The amino acid composition of fresh pork according to carcass lean-yield is shown in Table 4. The
236
individual amino acid content was mostly similar among groups (P>0.05) except for a tendency for
237
isoleucine and glycine to be lower in P and R carcasses, respectively (P<0.1). Studied correlations
238
between pork content of isoleucine and glycine with subcutaneous and IMF adipose tissues traits were
239
not significant (P>0.05) except between glycine and pork IMF fat content (r=0.23; P=0.039). The balance
240
of amino acids in the pork was compared with the recommended balance of indispensable amino acids
241
for adults (WHO/FAO/UNU 2007) by expressing the content of relevant amino acids relative to lysine
242
and then calculating the proportion of the recommended amount of each amino acid that was provided
243
when a sample containing the recommended amount of lysine was consumed (Table 5). The balance of
244
indispensable amino acids was less than ideal, with valine being the most limiting by about 30-35%.
245
Colour attributes at different vacuum ageing times
246
None of the CIELab colour attributes differed among carcass groups (P>0.05) (data not shown). Redness
247
index (a*) increased from day 1 (T1) to day 4 of vacuum ageing (T4) (1.72 vs. 2.97±0.20, respectively;
248
P<0.05) and it was kept steady at T6 and T8 (2.87 and 2.73±0.20, respectively; P>0.05). The yellowness
249
index (b*) also increased from T1 to T4 (7.02 vs. 8.64±0.38, respectively; P<0.05) but it decreased
250
slightly at T6 and T8 (8.10 and 7.40±0.38, respectively; P>0.05).
251
Overall lightness (L*) increased at T6 (P<0.05), but hue angle (H*) did not differ among ageing times
252
(P>0.05), and chroma (C*) increased at T4 (P<0.05) and slightly decreased at T8 (Figure 1). The
253
estimated relative content of metmyoglobin based on reflectance spectra did not differ between T1 and
9
T6 (K/S=1.30±0.01; P>0.05), but it increased significantly at T8 (K/S=1.28±0.01, P<0.05). There was no
255
interaction between carcass grade and ageing time on the CIELab colour attributes (lightness, redness,
256
yellowness, hue angle and chroma) (P>0.05).
257
Thawing losses, tenderness and lipid oxidation at different vacuum ageing times
258
Thawing losses during vacuum ageing of pork did not differ significantly among carcass groups
259
(228±10.5, 208±8.5 and 204±8.0 g/kg, in R, O and P, respectively; P>0.05). However, thawing losses
260
were the lowest in T1 and the highest in T8 (Figure 2; P<0.05), whereas the thawing losses in pork aged
261
for T4 and T6 were intermediate (P>0.05).
262
The shear force on thawed raw pork did not differ significantly either among carcass groups (2.45±0.13,
263
2.30±0.11, 2.18±0.10 kg, in R, O and P, respectively; P>0.05) or among ageing times (P>0.05, Figure 2).
264
There was no interaction between carcass grade and ageing time on thawing losses or Warner-Bratzler
265
shear force (P>0.05).
266
The TBARS assay in pork from the different carcass groups according to vacuum ageing times is shown in
267
Figure 3. There was an interaction between carcass grade and ageing time on lipid oxidation (expressed
268
on a pork fat content basis), which was higher in R (45-50% lean) than in the rest of group carcasses
269
from T4 onwards (P<0.05). The lean-yield did not affect lipid oxidation during ageing, except for P group
270
(<40% lean), which showed greatest TBARS values at T4 and T6 (P<0.05).
271
Discussion
272
A normal practice to increase the IMF content is to slaughter pigs at heavier live weights. In this study,
273
purebred Duroc barrows from a selected population were slaughtered at the same age (210 ±5 days) but
274
they were classed into three carcass groups: R (45-50% lean), O (40-45% lean) and P (<40% lean), which
275
derived from the following approximate live weight intervals: 125-130 kg, 130-135 kg and 135-140 kg. A
276
strong relationship between slaughter weight and carcass lean-yield was observed. Since carcass fatness
277
and IMF are correlated, the carcass classes differed also in their IMF content. Carcass class R had an
278
average of 32 g of IMF/kg, carcass class O had an average of 40 g of IMF/kg and carcass class P had an
279
average of 43 g of IMF/kg. Although major differences were observed in carcass traits among groups,
280
the dressing out, ultimate pH and drip loss was not affected by carcass grade.
281
In earlier studies, increasing the slaughter live-weight from 100-105 kg to 125-130 kg in purebred Duroc
282
pigs increased dressing out and back-fat at slaughter whereas drip loss and thawing loss were reduced
283
(Candek-Potokar et al. 1998; Maignel et al. 2007).Similar to the present results, ultimate pH and the
284
value of colour reflectance (L*) were not affected by carcass grade. In those studies, the average daily
10
gain of the pigs did not differ, since greater live weight was achieved by increasing age at slaughter. In
286
the present study, the pigs with the best growth rate (achieving 140 kg at slaughter), did not have
287
increased dressing out, but greatest carcass lipid content (back-fat thickness and IMF) without
288
detrimental effects on drip loss or colour attributes.
289
The highest value for essential amino acid contents was observed for leucine followed by lysine, while
290
the highest value in non-essential amino acid contents was observed for glutamic acid followed by
291
aspartic acid. Hydroxyproline was the amino acid with lowest content. In a previous experiment using
292
carcasses from lean genotypes (all with >50% lean) (Okrouhlá et al. 2008), lysine and secondly leucine
293
represented the greatest content of the essential amino acids, while the proportion of non-essential
294
amino acids were similar to the present results. In agreement with this study, the amino acid contents of
295
the lean pork did not differ among carcass groups, but they found consistent differences in the
296
Semimembranosus muscle.
297
In the present experiment, there were no differences among carcass grades in the amino acid contents
298
of pork. However, a significant positive correlation between the content of total glycine and the IMF of
299
pork was detected. A decrease of free glycine content with carcass weight has been reported in the L.
300
thoracis muscle in previous studies (Usborne et al. 1968). Because glycine produces a sweet taste (Solms
301
1969), these results suggest the hypothesis that the most marbled pork showed a correlated change of
302
taste, especially in meat products where protein hydrolysis occurs.
303
The pork from the studied Duroc barrows had low connective tissue content, based on the association
304
between hydroxyproline content and henceforth collagen content (Colgrave et al. 2008). In fact, the
305
rather low shear force values measured in this study were in agreement with reduced hydroxyproline
306
content.Although the proportion of hydroxyproline in pork was low, earlier studies detected differences
307
in this amino acid content in Longissimus dorsi muscle between clearly contrasting pork (extensive and
308
intensive feeding systems in New Zealand and between light and heavy Singaporean pigs) (Purchas et al.
309
2009). Different concentrations were also observed among genotypes (Duroc, Iberian x Duroc, Landrace
310
x Large-White) in hydroxyproline content in Gluteus medius muscle (Tor et al. 2012).
311
Relative to the amino acid balance recommendations for humans our results showed that valine was the
312
most limiting aminoacid at 66-70% of requirement, indicating that 144-151 g of pork would need to be
313
consumed in order to match 100 g of a sample with the recommended balance of the indispensable
314
amino acids. The next most limiting amino acids were isoleucine and leucine at 75-85%. Our results
315
differ slightly from those of Wilkinson et al. (2014), who found that the first limiting amino acid in pork
316
was leucine followed by valine. However, in that case the samples derived from crossbred genetic lines
317
which were probably leaner than the present genotype. The amount of Duroc pork meat that would
11
need to be consumed to get a satisfactory balance of amino acids to meet human requirements for all
319
amino acids was higher in the P (<40% lean) group, although the amino acid composition did not differ
320
significantly among carcass grades.
321
The objective colour attributes did not differ between lean-yield classes. In addition, vacuum-ageing up
322
to 8 days had not clear deleterious effects on meat colour traits, although the best colour appeal (low
323
hue angle, high redness index and low calculated metmyoglobin content) was shown in vacuum-aged
324
pork for 4 days, in line with results of film-packaged refrigerated pork (Alvarez-Rodriguez et al.
325
2015).Although IMF content has been positively related to tenderness (Jeleníková et al. 2008) our
326
results showed that neither carcass grade nor ageing affected tenderness measured by Warner Bratzler.
327
Similar results were reported by Candek-Potokar et al. (1998) though they did report a reduction in
328
sensory tenderness in heavier Duroc pigs (mostly P graded), which was related to increase in fibre
329
diameter. Using cooked pork loins, Channon et al. (2004) and Juárez et al. (2009) reported that vacuum
330
ageing for 7-14 days significantly improved tenderness based on shear force. These pigs however had
331
lower IMF contents (18-25 g/kg of IMF) than those used in the present experiment (over 30 g/kg of IMF)
332
and this may have attenuated any improvement in Warner Bratzler shear force over the seven days
333
investigated (overall 2.3±0.1 kg of shear force). Based on the currents results it would be difficult to
334
justify ageing to improve tenderness in the Duroc line investigated. The results might however differ for
335
sensory tenderness. In another experiment using the current texture meter device with lean
Pietrain-336
sired pigs (below 30 g/ kg of IMF), the mean shear force of raw loins was 3.3±0.1 kg (García-Hernández
337
et al. 2017). Thus, the values recorded for this Duroc raw pork are indicative of the loin being tender,
338
which may mask the potential effects of ageing on this attribute. It must be pointed out that Warner
339
Bratzler shear measurements are normally made on cooked samples, to reflect the most common form
340
of meat when eaten. In the afore-mentioned study by García-Hernández et al. (2017), cooking at 70ºC
341
another sub-sample from the same lean loins increased shear force up to 5.7±0.1 kg. However, it has
342
been suggested that relationships between shear force readings on raw and aged cooked samples are
343
low, probably due to the fact that the effects of ageing on cooked meat tenderness are not apparent on
344
the tenderness of raw meat (Purchas 1973).
345
Lipid oxidation was greater in pork loins from the leanest carcasses (R group, 45-50% lean), especially
346
from 4 days of vacuum storage onwards. This was likely associated with the higher PUFA content in the
347
IMF of this group. Bosch et al. (2012) previously reported for the same Duroc line a decline in PUFA
348
content of the loin with increasing live-weight. Nevertheless, the mean TBARS of all groups after seven
349
days ageing were considerably below sensory detection of rancid flavours of 1 mg MDA/kg of meat
350
(Rossi et al. 2013).
351
Conclusions
352
12
• A strong relationship between slaughter weight and carcass lean-yield was observed.353
• Carcass grading based on lean content had a major effect on IMF composition, since increased
354
fatness was associated with increased MUFA and decreased PUFA content.
355
• Carcass adiposity did not affect the amino acid balance and the technological quality (colour,
356
drip loss, shear force and lipid stability) of raw pork.
357
• Ageing for 8 days was unlikely to increase the tenderness of pork with intramuscular fat levels
358
over 30 g/kg, as was the case for pigs in this study.
359
• The lipid oxidation had an inverse relationship with the PUFA content of each pork class, and it
360
did not increase due to vacuum ageing for 8 days.
361
. Acknowledgements
362
The authors wish to thank T. Giró, A. Ñaco and L. Villagrasa for their technical assistance during
363
collection and analyses of samples. This work was supported by the Ministry of Economy and
364
Competitiveness of Spain and the European Union Regional Development Funds (AGL2012-33529 and
365
AGL2015-65846-R).
366
Conflict of interest statement
367
The authors declare no conflicts of interest.
368
References
369
Álvarez-Rodríguez J, Tor M, Cubiló D, Ripoll G, Babot D, Villalba D (2015) Comparison of objective
370
measures of pork colour traits during ageing of the longissimus muscle from pigs housed organically
371
and conventionally. Animal Production Science55, 494-500.
372
AOAC (2000) Official Method 996.06, Official Methods of Analysis (17th ed). (AOAC International:
373
Arlington, VA, USA).
374
BOE (2011). Real Decreto 1028/2011, de 15 de julio, por el que se establecen disposiciones de aplicación
375
relativas a la clasificación de las canales de porcino. In ‘Boletín Oficial del Estado (BOE) 185’. pp.
376
87921-87930. (Gobierno de España, Madrid, Spain).
377
Bosch L, Tor M, Reixach J, Estany J (2009) Estimating intramuscular fat content and fatty acid
378
composition in live and post-mortem samples in pigs. Meat Science82, 432–437.
379
Bosch L, Tor M, Reixach J, Estany J (2012) Age-related changes in intramuscular and subcutaneous fat
380
content and fatty acid composition in growing pigs using longitudinal data. Meat Science91, 358–363.
13
Buege JA, Aust SD (1978) Microsomal lipid peroxidation. Methods in Enzymology52, 302-310.
382
Čandek-Potokar M, Škrlep M (2012) Factors in pig production that impact the quality of dry-cured ham:
383
a review. Animal6, 327-338.
384
Candek-Potokar M, Zlender B, Bonneau M (1998) Effects of breed and slaughter weight on longissimus
385
muscle biochemical traits and sensory quality in pigs. Annales de Zootechnie47, 3-16.
386
Channon HA, Kerr MG, Walker PJ (2004) Effect of Duroc content, sex and ageing period on meat and
387
eating quality attributes of pork loin. Meat Science66, 881–888.
388
CIE (1986). Colorimetry. (2nd ed). (Commission Internationale de L’Eclairage: Vienna, Austria).
389
Colgrave ML, Allingham PG, Jones A (2008) Hydroxyproline quantification for the estimation of collagen
390
in tissue using multiple reaction monitoring mass spectrometry. Journal of Chromatography A
1212(1-391
2), 150-153.
392
Dransfield E, Jones RCD, MacFie HJH (1981) Tenderising in m. Longissimus dorsi of beef, veal, rabbit,
393
lamb and pork. Meat Science5, 139-147.
394
Estany J, Ros-Freixedes R, Tor M, Pena RN (2014) A functional variant in the Stearoyl-CoA desaturase
395
gene promoter enhances fatty acid desaturation in pork. PLoS ONE9(1), e86177.
396
Fonseca S, Gómez M, Domínguez R, Lorenzo J (2015) Physicochemical and sensory properties of Celta
397
dry-ripened “salchichón” as affected by fat content. Grasas y Aceites66(1), e059.
398
Fontoulakis M, Lahm HW (1998) Hydrolysis and amino acid composition analysis of proteins. Journal of
399
Chromatography A826, 109-134.
400
García-Hernández E, Tor M, Villalba D, Álvarez-Rodríguez J (2017) Efecto de la suplementación con linaza
401
y del gen del halotano sobre la dureza y la composición de ácidos grasos del lomo de cerdo blanco
402
crudo y cocinado. In ‘XVII Jornadas sobre Producción Animal de la Asociación Interprofesional para el
403
Desarrollo Agrario, Zaragoza, Spain’ (in press). Guo S, Duan JA, Qian DW, Tang YP, Qian YF, Wu DW, Su
404
SL, Shang EX (2013) Rapid determination of amino acids in fruits of Ziziphus jujuba by hydrophilic
405
interaction ultra-high-performance liquid chromatography coupled with-quadrupole mass
406
spectrometry. Journal of Agricultural & Food Chemistry61 (11), 2709-2719.
407
Hanson SWF, Olley J (1963) Application of the method of lipid extraction to tissue homogenate.
408
Biochemistry Journal89, 101–102.
14
Hunt MC, Acton JC, Benedict RC, Calkins CR, Cornforth DP, Jeremiah LE, Olson DG, Salm CP, Savell JW,
410
Shivas SD (1991) Guidelines for meat color evaluation. In ‘Proceedings 44th Annual Reciprocal Meat
411
Conference, Kansas State University’. pp. 1–17. (American Meat Science Association: Champaign, IL,
412
USA).
413
Jeleníková J, Pipek P, Miyahara M (2008) The effects of breed, sex, intramuscular fat and ultimate pH on
414
pork tenderness. European Food Research & Technology227, 989–994.
415
Juárez M, Caine WR, Larsen IL, Robertson WM, Dugan MER, Aalhus JL (2009) Enhancing pork loin quality
416
attributes through genotype, chilling method and ageing time. Meat Science83, 447–453.
417
Kristensen L, Purslow PP (2001) The effect of ageing on the water-holding capacity of pork: role of
418
cytoskeletal proteins. Meat Science58, 17–23.
419
Latorre MA, Iguácel F, Sanjoaquín L, Revilla R (2009) Effect of sire breed on carcass characteristics and
420
meat and fat quality of heavy pigs reared outdoor and intended for dry-cured meat production.
421
Animal3, 461-467.
422
Maignel L, Mathur PK, Fortin F, Sullivan BP (2007) Effect of breed, sex and slaughter weight on
423
performance of Canadian purebred pigs. Book of Abstracts of the 58th EAAP Annual Meeting (pp. 286).
424
Dublin, Ireland: Wageningen Academic Publishers.
425
NRC (2012) Nutrient requirements of swine (11th ed). (National Research Council, National Academy
426
Press: Washington, DC, USA).
427
Okrouhlá M, Stupka R, Čítek J, Šprysl M, Trnka M, Kluzáková E (2008) Effect of lean meat proportion on
428
the chemical composition of pork. Czech Journal of Food Science26, 464-469.
429
Purchas RW (1973) Some aspects of raw meat tenderness. A study of some factors affecting its change
430
with cooking and a new means of measurement. Journal of Food Science38, 556-559.
431
Purchas RW, Morel PCH, Janz JAM, Wilkinson BHP (2009) Chemical composition characteristics of the
432
longissimus and semimembranosus muscles for pigs from New Zealand and Singapore. Meat Science
433
81, 540-548.
434
Rees MP, Trout G, Warner RD (2002) Effect of calcium infusion on tenderness and ageing rate of pork m.
435
Longissimus thoracis et lumborum after accelerated boning. Meat Science61, 169-179.
15
Ros-Freixedes R, Reixach J, Bosch L, Tor M, Estany J (2013) Response to selection for decreased backfat
437
thickness at restrained intramuscular fat content in Duroc pigs. Journal of Animal Science91(8),
3514-438
3521.
439
Rossi R, Pastorelli G, Cannata S, Tavaniello S, Maiorano G, Corino C (2013) Effect of long term dietary
440
supplementation with plant extract on carcass characteristics meat quality and oxidative stability in
441
pork. Meat Science95, 542–548.
442
Rule DC (1997) Direct transesterification of total fatty acids of adipose tissue, and of freeze-dried muscle
443
and liver with boron-trifluoride in methanol. Meat Science46, 23–32.
444
Solms J (1969) The taste of amino acids, peptides and proteins. Journal of Agricultural Chemistry17,
445
686-688.
446
Tor M, Vilaró F, Ros-Freixedes R, Reixach J, Estany J (2012) Efecto del tipo genético, de la selección por
447
grasa intramuscular y de la localización anatómica del tejido, sobre la composición en aminoácidos de
448
la carne. In ‘XVI Reunión Nacional de Mejora Genética Animal, Ciutadella de Menorca, Spain’. pp. 1-6.
449
Usborne WR, Kemp JD, Moody WG (1968) Effect of liveweight on quality, proximate composition,
450
certain protein components and free amino acids of porcine muscle. Journal of Animal Science27(3),
451
584-589.
452
Van Laack RLJM, Stevens SG, Stalder KJ (2001) The influence of ultimate pH and intramuscular fat
453
content on pork tenderness and tenderization. Journal of Animal Science79, 392–397.
454
WHO/FAO/UNU (2007) Protein and amino acid requirements in human nutrition. In ‘Report of a joint
455
WHO/FAO/UNU expert consultation, Technical Report Series 935’. pp. 1–265. (WHO, World Health
456
Organisation: Geneva, Switzerland).
457
Wilkinson BHP, Lee E, Purchas RW, Morel PCH (2014) The retention and recovery of amino acids from
458
pork longissimus muscle following cooking to either 60 °C or 75 °C. Meat Science96, 361-365.
459
16
Table 1. Chemical composition of the diet fed to pigs from 180 to 210 days of age (g/kg of feed, unless
461
otherwise stated) (Means)
462
Gross energy, MJ/kg 17.0 Dry matter 886 Crude protein (CP) 142 Lysine 8.6 Methionine 1.2 Methionine+Cysteine 3.6 Threonine 4.7 Valine 3.5 Isoleucine 9.9 Leucine 2.9 Histidine 2.8 Phenylalanine 5.8 Sum of EAA 60.4 Ether extract 64SFA, g/kg fatty acids 100
MUFA, g/kg fatty acids 588
PUFA, g/kg fatty acids 312
Crude fibre 36
Ingredients (g/kg of feed, in descending order): barley (372), wheat (224), rye (126), canola meal 00 (70),
463
pea (47), soyabean meal 46% CP (31), animal-vegetable blended fat (42), sugar-beet pulp (30),
464
sugarcane molasses (18), calcium carbonate (13), vitamin-mineral premix (7), sodium chloride (5),
L-465
Lysine 50% CP (5), L-Tryptophan 85% CP (5), monocalcium phosphate (3), L-Threonine 72.5% CP (1),
466
Choline chloride (1).
467
EAA= sum of essential amino acids (Lysine, Methionine, Threonine, Isoleucine, Valine, Phenylalanine,
468
Leucine and Histidine).
17
Table 2. Growth performance and carcass traits of Duroc barrows slaughtered at 210 days of age
470
according to carcass commercial grading (Least square means ± standard error)
471
Carcass grade
R (45-50% lean) O (40-45% lean) P (<40% lean) P-value
N 18 28 34 -
Weight at 180 days old, kg 105.8±1.8b 106.7±1.5b 113.4±1.4a 0.002
Weight at 210 days old, kg 126.9±2.3b 130.8±1.8b 138.9±1.7a <0.001
Average daily gain, g 698±45b 806±36ab 839±34a 0.05
Dressing out, % 75.9±0.4 75.6±0.3 76.3±0.3 0.33
Carcass weight, kg 96.3±1.9b 98.9±1.5b 106.0±1.4a <0.001
Carcass length,cm 86.0±0.6 86.8±0.5 87.8±0.5 0.07
Ham weight, kg 12.47±0.25b 12.44±0.20b 13.29±0.19a 0.005
Fat depth at Gluteus medius
muscle, mm 21.6±0.4c 25.1±0.3b 29.2±0.3a <0.001
Backfat thickness between ribs 12th and 13th assuming
rib 15th was the last rib, mm 21.3±0.3
c 24.4±0.3b 28.1±0.3a <0.001
Carcass lean content, % 46.6±0.5a 42.5±0.4b 35.7±0.4c <0.001
Means in the same row with no superscript letters after them or with a common superscript letter
472
following them are not significantly different (P < 0.05)
18
Table 3. Technological traits and chemical composition of fresh L. thoracis muscle (24 h post-mortem)
474
from Duroc barrows according to carcass commercial grading (Least square means ± standard error)
475
Carcass grade
R (45-50% lean) O (40-45% lean) P (<40% lean) P-value
Ultimate pH 5.88±0.04 5.92±0.03 5.93±0.03 0.56
Centrifugation drip loss, g/kg 21.2±2.7 16.4±2.1 17.5±2.0 0.37 Dry matter, g/kg 282.7±2.7 287.2±2.2 286.5±2.0 0.40 Crude protein, g/kg 217.0±2.0a 214.3±1.6ab 210.9±1.5b 0.04
Intramuscular fat, g/kg 31.8±2.5b 40.7±2.0a 43.2±1.9a 0.003
∑MUFA, g/kg fatty acids 492.0±4.b 501.7±3.2ab 508.8±3.0a 0.006
∑SFA, g/kg fatty acids 391.4±4.5 403.2±3.6 402.1±3.4 0.10
∑PUFA, g/ kg fatty acids 116.5±3.6a 95.1±2.9b 89.1±2.7b <0.001
MUFA= monounsaturated fatty acids (C16:1n-7; C17:1n-7; C18:1n-9; and C20:1n-9); SFA= saturated fatty
476
acids (C10:0; C12:0; C14:0; C16:0; C17:0; C18:0; and C20:0); PUFA=polyunsaturated fatty acids
(C18:2n-477
6; C18:3n-3; C20:2n-6; C20:3n-6; C20:4n-6; C20:4n-6 and C22:6n-3).
478
Means in the same row with no superscript letters after them or with a common superscript letter
479
following them are not significantly different (P < 0.05)
19
Table 4. Essential and non-essential amino acid composition of fresh L. thoracis muscle (24 h
post-481
mortem) from Duroc barrows according to carcass commercial grading (Least square means ± standard
482
error)
483
Carcass grade
R (45-50% lean) O (40-45% lean) P (<40% lean) P-value Amino acids, g/g CP Lysine 8.48±0.29 8.43±0.23 8.62±0.22 0.83 Methionine 1.95±0.08 2.06±0.07 2.08±0.06 0.46 Threonine 4.68±1.00 4.80±0.08 4.85±0.07 0.45 Valine 4.96±0.11 5.09±0.09 4.94±0.08 0.45 Isoleucine 4.54±0.09 4.56±0.07 4.34±0.07 0.09 Leucine 9.29±0.13 9.42±0.11 9.20±0.10 0.34 Histidine 5.16±0.17 5.16±0.14 5.15±0.13 0.99 Phenylalanine 3.82±0.04 3.89±0.04 3.83±0.03 0.39 ∑EAA* 42.9±0.7 43.4±0.6 43.0±0.5 0.80 Cistine 0.97±0.04 0.97±0.03 0.96±0.03 0.99 Hydroxyproline 0.27±0.02 0.28±0.01 0.26±0.01 0.63 Proline 3.76±0.06 3.84±0.05 3.80±0.04 0.53 Alanine 5.21±0.10 5.27±0.08 5.14±0.08 0.52 Arginine 5.97±0.07 6.01±0.06 5.90±0.05 0.35 Aspartic acid 10.34±0.26 10.79±0.21 10.73±0.20 0.37 Glutamic acid 15.47±0.30 15.89±0.25 15.48±0.23 0.42 Glycine 3.92±0.08 4.15±0.06 4.03±0.06 0.06 Serine 4.13±0.08 4.28±0.06 4.28±0.06 0.26 Tyrosine 3.34±0.10 3.22±0.08 3.33±0.08 0.53 ∑NEAA 53.4±0.6 54.7±0.5 53.9±0.5 0.27 Total 96.25±1.22 98.09±0.99 96.90±0.92 0.47
EAA= essential amino acids (Lysine, Methionine, Threonine, Isoleucine, Valine, Phenylalanine, Leucine
484
and Histidine); NEAA= non-essential amino acids (Cistine, Arginine, Hydroxyproline, Tyrosine, Alanine,
485
Glycine, Glutamic acid, Serine, Proline, and Aspartic acid).
486
*Tryptophan (essential amino acid) was not measured in the current samples and therefore it was not
487
included.
488
489
20
Table 5. The amino acids (AA) balance relative to lysine in raw pork according to carcass grade compared
490
with the recommended balance of indispensable amino acids for adults (WHO/FAO/UNU, 2007)*
491
Target balance of AA for adults expressed relative to lysine at 100 (WHO/FAO/UNU, 2007)
Balance of AA in pork
relative to lysine Proportion of the recommended amount of each AA in a sample containing the target amount of lysine R O P R O P Lysine 100.0 100.0 100.0 100.0 1.00 1.00 1.00 Methionine + Cysteine† 48.9 45.9 47.4 46.4 0.94 0.97 0.95 Threonine 55.6 55.2 56.9 56.3 0.99 1.02 1.01 Valine 86.7 58.5 60.4 57.3 0.67 0.70 0.66 Isoleucine 66.7 53.5 54.1 50.3 0.80 0.81 0.75 Leucine 131.1 109.6 111.7 106.7 0.84 0.85 0.81 Histidine 33.3 60.8 61.2 59.7 1.83 1.84 1.79 Phenylalanine + Tyrosine 84.4 84.4 84.3 83.1 1.00 1.00 0.98 Carcass grades based on lean content (European Union standards): R (45-50% lean), O (40-45% lean) and
492
P (<40% lean).
493
*Tryptophan (essential amino acid) was not measured in the current samples and therefore it was not
494
included.
495
†Cysteine supply was calculated as twice the analysed Cys content.
496
21
498
499
Figure 1. Lightness (a), hue angle (b) and chroma (c) colour attributes (CIELab scale) of L. thoracis muscle
500
from purebred Duroc barrows at day 1 post-mortem or subsequently vacuum aged up to 4, 6 or 8 days.
501
Different letter within each colour attribute indicates significant differences (P<0.05) between ageing
502
times (Least square means ± standard error).
503
504
505
22
506
507
508
Figure 2. Thawing losses (a) and Warner-Bratzler shear force (b) in raw, uncooked meat (L. thoracis
509
muscle) from purebred Duroc barrows at day 1 post-mortem or subsequently vacuum aged up to 4, 6 or
510
8 days. Different letter within each variable indicates significant differences (P<0.05) between ageing
511
times (Least square means ± standard error).
512
513
514
23
515
516
Figure 3.Lipid oxidation (TBARS, µg malonaldehyde-MDA/g of intramuscular fat -IMF) of raw loins from
517
purebred Duroc barrows according to carcass grade (R, O or P category) at day 1 post-mortem or
518
subsequently vacuum aged up to 4, 6 or 8 days. Different letter within an ageing time (a, b) indicates
519
significant differences (P<0.05) between carcass categories. Different letter within carcass group (x, y)
520
indicates significant differences (P<0.05) between ageing times (Least square means ± standard error).
521
The mean TBARS values was 0.59±0.02 µg MDA/g of meat (R group=0.62 µg MDA/g of meat; O
522
group=0.53 µg MDA/g of meat and P group=0.61 µg MDA/g of meat).
![Bis[2,3,4 trimethyl 5 [(3,4,5 trimethyl 2H pyrrol 2 ylidene κN)methyl] 1H pyrrolato κN]copper(II)†](data:image/gif;base64,R0lGODlhAQABAIAAAP///wAAACH5BAEAAAAALAAAAAABAAEAAAICRAEAOw==)