Dependable Network Protocols in Wireless
Sensor Networks
Tiong Hoo Lim
PhD
University of York
Department of Computer Science
Abstract
This thesis is concerned with the dependability of Wireless Sensor Networks (WSNs). We propose an approach, inspired by the immune system, that al-lows individual nodes to detect, diagnose and recover from different failures by switching between different protocols using a multi-modal switching mech-anism. A causal link between different failures in WSN is identified. Existing fault tolerance in WSNs approaches are examined. From the survey, it is identi-fied that various attempts have been made to improve the fault tolerance of the communication protocol especially in the routing protocols. Although tests have been performed to evaluate the communication protocols prior to deployment, failures in WSNs are still being reported when deployed in real environments. A Systematic Protocol Evaluation Technique (SPET) is proposed and applied to evaluate the dependability of the proposed multi-modal protocol and reduce the uncertainties in the experiment and to demonstrate the confidence in the mea-surements taken from experiments.
Contents
1 Introduction 1
1.1 Motivation . . . 1
1.1.1 Wireless Sensor Networks . . . 2
1.1.2 Dependable Wireless Sensor Networks . . . 2
1.1.3 Effect of Radio Abnormality on the Dependability of Wire-less Sensor Networks . . . 3
1.1.4 Dependable Routing . . . 3
1.1.5 Fault Tolerance Approach toward Dependability . . . 4
1.1.6 Establishing Dependability with Confidence . . . 5
1.2 Statement of Hypothesis . . . 6
1.3 Contributions . . . 6
1.4 Organisation of Thesis . . . 7
2 Towards a Dependable Wireless Sensor Networks 9 2.1 Wireless Sensor Networks . . . 9
2.2 Design Challenges in WSNs . . . 14 2.2.1 Tolerate failure . . . 15 2.2.2 Efficiency . . . 15 2.2.3 Scalability . . . 16 2.2.4 Adaptability . . . 16 2.2.5 Discussion . . . 16 2.3 Dependable WSN . . . 17 2.4 Failures in WSNs . . . 17
2.4.1 Fault, Error and Failure . . . 18
2.4.2 Fault Characteristics . . . 19
2.5 Type of Anomalies . . . 20
2.5.1 Data anomalies . . . 20
CONTENTS
2.5.3 Network anomalies . . . 22
2.5.4 Signal anomalies . . . 22
2.5.5 Discussion . . . 23
2.6 Achieving Dependable Network using Fault Tolerant Approaches . 23 2.6.1 Fault tolerant architecture . . . 25
2.6.2 Error Detection . . . 27
2.6.3 Error Consensus . . . 32
2.6.4 Error Diagnosis . . . 33
2.6.5 Error Recovery . . . 34
2.6.6 Limitation of Existing Fault Tolerant Approaches . . . 37
2.7 The Application of Immune-Inspired Approaches toward Fault Tol-erance . . . 38
2.7.1 The Immune System . . . 39
2.7.2 Immunological Theory . . . 41
2.7.3 Artificial Immune System . . . 43
2.7.4 Application of AIS in WSNs . . . 46
2.7.5 AIS for Interference Recognition in WSNs . . . 47
2.8 Fault Tolerance in WSNs Routing Protocols . . . 48
2.8.1 Reactive Routing in WSNs . . . 48
2.8.2 Mixed Routing . . . 49
2.8.3 Research Attempts to Enhance and Augment AODV . . . . 50
2.9 Current Evaluation methodology . . . 54
2.9.1 The hybrid approaches . . . 56
2.9.2 Reality Gap in the Current Evaluation Approaches . . . 56
2.10 Summary . . . 57
3 Evaluating the Fault Tolerance of the WSNs Routing Protocols 59 3.1 Materials and Methods . . . 59
3.1.1 Application Environment and Topology . . . 60
3.1.2 Failure Model . . . 62
3.1.3 Experimental Tools . . . 65
3.1.4 Simulation Methodology . . . 66
3.1.5 Evaluation Metrics . . . 67
3.1.6 Statistical tools . . . 68
3.2 Performance Analysis of Routing Protocols . . . 71
3.2.1 Observations . . . 72
3.2.2 Discussion . . . 94
CONTENTS
4 Achieving Dependability using Multi-modal Network Protocol 95
4.1 Motivation . . . 95
4.2 Multi-modal Protocol . . . 96
4.2.1 Multimodal Routing Protocol . . . 96
4.2.2 Design of Multi-modal Routing Protocol . . . 97
4.2.3 Discussion . . . 101
4.3 On Robustness: 1. The effects of failure duration . . . 102
4.3.1 Application Scenario . . . 102
4.3.2 Network Setup . . . 102
4.3.3 Simulation Parameters . . . 103
4.3.4 Simulation of failures . . . 104
4.3.5 Results . . . 105
4.4 On Robustness: 2. The effects of varying the number of failing nodes111 4.4.1 Results . . . 111
4.4.2 Discussion on the effect of failure size . . . 131
4.5 On Scalability: The effects of network size . . . 136
4.5.1 Packet Generation . . . 136
4.5.2 Fault injection . . . 137
4.5.3 Results . . . 138
4.5.4 Discussion on the scalability of MRP . . . 143
4.6 Summary . . . 143
5 Assisted Recovery with An Immune-Inspired Classifier 144 5.1 Motivation . . . 145
5.1.1 Problem Formulation . . . 146
5.1.2 Existing approaches . . . 147
5.1.3 Contributions . . . 148
5.2 The RDA: Receptor Density Algorithm . . . 149
5.2.1 Biological principle . . . 149
5.2.2 The Algorithm . . . 150
5.3 IDRS: Interference Detection and Recovery Systems . . . 151
5.3.1 MDM: The MRP Detection Module . . . 153
5.3.2 RDM: The RDA Diagnostic Module . . . 153
5.3.3 RIRM: Radio Interference Response Module . . . 159
5.4 Experiments and Results . . . 160
5.4.1 Evaluation of the RDM . . . 160
5.4.2 Evaluation of the IDRS . . . 164
5.4.3 Discussion . . . 177
CONTENTS
6 Using Statistical Approach to Demonstrate Dependability 179
6.1 Motivation . . . 179
6.2 Scientific Protocol Evaluation Technique . . . 180
6.2.1 Defining the Scope . . . 181
6.2.2 Design of Experiment . . . 182
6.2.3 Uncertainty Analysis . . . 182
6.2.4 Graphical Analysis . . . 182
6.2.5 Statistical Analysis . . . 183
6.2.6 Measuring the Effectiveness of the WSN’s Evaluation . . . . 185
6.3 Case Study: Evaluating the dependability of MRP using SPET . . . 187
6.3.1 Defining the Objectives . . . 187
6.3.2 Experimental Setup . . . 188
6.3.3 Results Analysis . . . 191
6.3.4 Discussion: Benefit of SPET . . . 201
6.4 Summary . . . 204
7 Conclusions and Future Works 205 7.1 Significant Contributions of the studies . . . 205
7.2 Revisiting the research questions . . . 207
7.3 Recommendations for further research . . . 209
A Screenshoot for Grid Topology 211
Abbreviation 216
Glossary 218
List of Tables
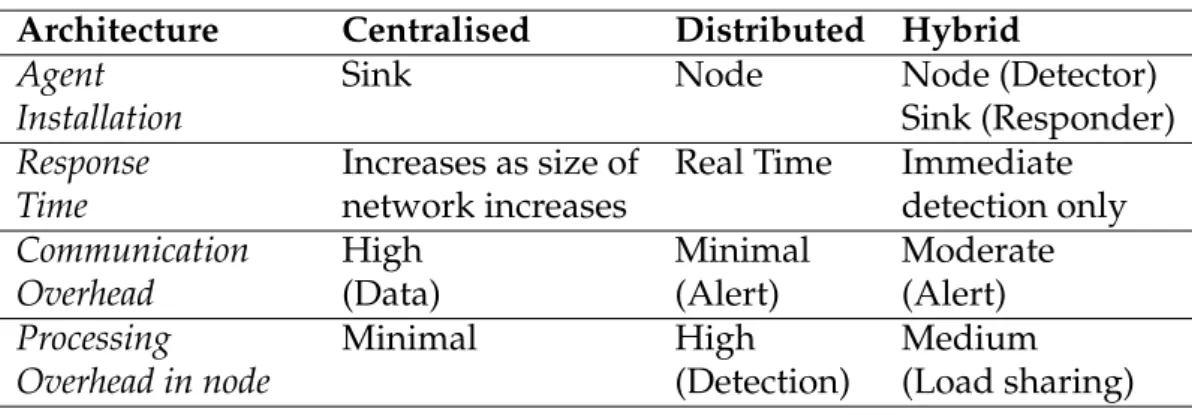
2.1 Comparison between different fault tolerant architectures . . . 27
2.2 Comparison of various anomaly detection algorithms . . . 30
2.3 Route detection and recovery mechanisms in different variants of AODV routing protocol. . . 53
2.4 Survey from 50 papers published in IEEE MASS 2010-2012 . . . 55
3.1 The values of ON/OFF periods representing short, medium and long interferences. . . 64
3.2 Generic NS-2 Parameters used in the work . . . 67
3.3 Normality Test for the simulated results . . . 70
3.4 The range ofA-values representing different effect sizes. . . 71
3.5 p-values computed from Rank-Sum test for different PDR with 0.1s failure duration . . . 74
3.6 p-values computed from Rank-Sum test for different PDR with 10s failure durations . . . 75
3.7 A-values computed from Vargha-Delaney Test for different PDR with 0.1s failure duration . . . 76
3.8 A-values computed from Vargha-Delaney Test for different PDR with 10s failure durations . . . 77
3.9 p-values computed from Rank-Sum test for different energy utili-sation with 0.1s failure duration . . . 79
3.10 p-values computed from Rank-Sum test for different energy utili-sation with 10s failure durations . . . 80
3.11 A-values computed from Vargha-Delaney Test for different energy utilisation with 0.1s failure durations . . . 81
3.12 A-values computed from Vargha-Delaney Test for different energy utilisation with 10s failure durations . . . 82
LIST OF TABLES
3.13 The total number of MAC packets transmitted and received are higher in AOMDV compared to AODV, NST and TinyAODV. . . . 82 3.14 p-values computed from Rank-Sum test for different routing
over-head with 0.1s failure duration . . . 85 3.15 p-values computed from Rank-Sum test for different routing
over-head with 10s failure durations . . . 86 3.16 A-values computed from Vargha-Delaney Test for different routing
overhead with 0.1s failure duration . . . 87 3.17 A-values computed from Vargha-Delaney Test for different routing
overhead with 10s failure duration . . . 88 3.18 p-values computed from Rank-Sum test for different average packet
delay with 0.1s failure duration . . . 90 3.19 p-values computed from Rank-Sum test for different average packet
delay with 10s failure duration . . . 91 3.20 A-values computed from Vargha-Delaney Test for different
aver-age delay with 0.1s failure duration . . . 92 3.21 A-values computed from Vargha-Delaney Test for different
aver-age delay with 10 failure durations . . . 93
4.1 NS-2 Parameters to evaluate MRP. . . 104 4.2 NS-2 traces showing the packet dropped due to collision. . . 105 4.3 The mean, median for different failure durations with 10 failing
nodes. . . 108 4.4 p- andA-values between MRP and AODV, MRP and NST, and NST
and AODV for different failure durations . . . 109 4.5 The median of the PDR for different number of failures injected
with different failure durations for MRP, NST, and AODV. . . 113 4.6 The median of the average energy remaining in a node for
differ-ent number of failures injected with differdiffer-ent failure durations for MRP, NST, and AODV. . . 118 4.7 The median of the normalised routing overhead for different
num-ber of failures injected with different failure durations for MRP, NST, and AODV. . . 125 4.8 The median of the average end to end delay for each packet for
different failure durations for MRP, NST, and AODV. . . 130 4.9 The summary of the traffic flow patterns for different network sizes. 137 4.10 The table showing the median and mean of the PDR, energy
re-mains, routing overhead and average delay for the network size of 25-, 49-, 100-, 225, 400, and 900-nodes. . . 139
LIST OF TABLES
4.11 p- andA-values between MRP and AODV, MRP and NST, and NST and AODV for different network sizes . . . 142
5.1 Interference Class based on the intensity and duration . . . 163 5.2 Descriptions of different type of traffics generated from the laptop. 164 5.3 The execution of different responses in all the nodes for IDRS and
MTPC . . . 167 5.4 p-values of the Wilcoxon rank sum test to determine statistical
sig-nificance of the performance between the routing protocols. . . 168 5.5 Vargha-delaney test to determine scientific significance of the
per-formance between the routing protocols . . . 169 5.6 Hardware requirements in term of computational and memory
foot-print introduced by MRP and IDRS . . . 169 5.7 pandA-values for AODV, NST and MRP against IDRS for the
per-formance metrics PDR, ENG, RT and DLY. . . 176
6.1 pand Avalues for Hardware Experiment (Bold highlights signifi-cance value) . . . 194 6.2 pandAvalues for Simulation (Bold highlights significance value) . 195 6.3 KS Testp-values (Bold indicates two samples having the same
dis-tribution) for PDR between NS2 and TinyOS using Matlab . . . 196 6.4 p and A values for Hardware Experiment (Bold highlights
signi-cance value) . . . 199 6.5 pandAvalues for Simulation (Bold highlights significance value) . 200 6.6 KS Testp-values showing the routing overhead similarity between
NS2 and TinyOS using Matlab . . . 200 6.7 This table presents the frequency (in%) where one protocol is
List of Figures
2.1 WSNs deployment showing the single-hop (left) and multihop net-work (right). In a multihop netnet-work, a routing protocol is required. 10 2.2 An example of WSNs Hardware . . . 11 2.3 Frequency Allocation for WSNs starts from channel 11 to 26. . . 12 2.4 Formation and manifestation mechanisms of faults, errors, and
fail-ures . . . 18 2.5 Examples of manifestation of faults caused by communication fault
in WSNs . . . 19 2.6 The causality between signal, network, node and application
anoma-lies . . . 24
3.1 An Experimental Framework based on the existing State of the Art experimental techniques in WSNs . . . 60 3.2 An outdoor deployment based on 7 by 7 grid topology . . . 61 3.3 A typical WLAN traffic patterns. . . 63 3.4 The patterns showing the number of successful packets received
by a node during WLAN interference . . . 64 3.5 The PDR of NST is higher than AODV, AOMDV and TinyAODV
as the number of failing nodes increases. . . 73 3.6 Lower energy consumption is observed in NST-AODV compared
to AODV due to retransmission. . . 78 3.7 The routing overhead generated during the evaluation of AODV,
NST, AOMDV and TinyAODV for different failures. . . 84 3.8 The average packet delay introduced for AODV, NST, AOMDV
and TinyAODV for different failures. . . 89
4.1 The Architecture of Multimodal Routing Protocol . . . 98 4.2 Flow Diagram for MRP during failures. . . 100
LIST OF FIGURES
4.3 Network topology based on the indoor deployment for critical health monitoring networks . . . 103 4.4 Box-Whiskers plot showing the PDR and energy consumption of
MRP against AODV and NST for different failure durations . . . . 106 4.5 Box-Whiskers plot showing the delay and routing overhead of MRP
against AODV and NST for different failure durations . . . 107 4.6 p-values for the PDR with different number of failures with 0.5s
and 2s failure durations . . . 114 4.7 p-values for the PDR with different number of failures with 10s and
20s failure durations . . . 115 4.8 A-values for the PDR with different number of failures with 0.5s
and 2s failure durations . . . 116 4.9 A-values for the PDR with different number of failures with 10s
and 20s failure durations . . . 117 4.10 p-values for the energy remain with different number of failures
with 0.5s and 2s failure durations . . . 119 4.11 p-values for the energy remain with different number of failures
with 10s and 20s failure durations . . . 120 4.12 A-values for the energy remain with different number of failures
with 0.5s and 2s failure durations . . . 121 4.13 A-values for the energy remain with different number of failures
with 10s and 20s failure durations . . . 122 4.14 p-values of the normalised routing overhead for different number
of failures with 0.5s and 2s failure durations . . . 126 4.15 p-values of the normalised routing overhead for different number
of failures with 10s and 20s failure durations . . . 127 4.16 A-value of the normalised routing overhead for different number
of failures with 0.5s and 2s failure durations . . . 128 4.17 A-value of the normalised routing overhead for different number
of failures with 10s and 20s failure durations . . . 129 4.18 p-values for average end-to-end delay with different number of
failures with 0.5s and 2s failure durations . . . 132 4.19 p-values for average end-to-end delay with different number of
failures with 10s and 20s failure durations . . . 133 4.20 A-values for the average end-to-end delay with 0.5s and 2s failure
durations . . . 134 4.21 A-values for the average end-to-end delay with 10s and 20s failure
LIST OF FIGURES
4.22 Network topology showing a square grid of 7 by 7. . . 137 4.23 Box-Whiskers plot showing the median, mean (diamond), lower
quartile, upper quartile, highest and lowest values for different network sizes . . . 140 4.24 Box-Whiskers plot showing the median, mean (diamond), lower
quartile, upper quartile, highest and lowest values for different network sizes . . . 141
5.1 Interference source is introduced near node 5 to disrupt the radio communication between node 2 and 3. . . 147 5.2 The behaviours of a receptor when it interacts with different signals. 151 5.3 The architecture of the Interference Detection and Recovery System. 152 5.4 The raw RSSI data collected from the radio interface of a TelosB . . 154 5.5 The signatures generated by the RDA . . . 156 5.6 The signature generated by RDA with the different values h . . . . 157 5.7 The signature patterns generated by RDA with the different valuesβ157 5.8 Using the outputs generated by RDA, the interference can be
clas-sified into either Class I, II, or III . . . 158 5.9 Decision tree used by the RIRM and MDM to respond to different
interference. . . 160 5.10 The distribution of the interference characteristics after processed
by the RDA. . . 162 5.11 Results showing the detection accuracy and the effect of different
interference classes on PSR . . . 165 5.12 PDR achieved by different routing protocols for different classes of
interferences . . . 167 5.13 Transmission Overhead for hardware experiment . . . 168 5.14 Box-Whisker plot for the Packet Delivery Rate (%) generated by
AODV, NST, MRP and IDRS. . . 172 5.15 Box-Whisker plot with Median and Inter-quartile range for the
rout-ing overhead (%) generated by AODV, NST, MRP and IDRS. . . 173 5.16 Box-Whisker plot for the energy consumed by AODV, NST, MRP
and IDRS during interference . . . 174 5.17 Box-Whisker plot for the average delay generated by the AODV,
NST, MRP and IDRS during interference. . . 175
6.1 Scientific Protocol Evaluation Technique to reduce the experimen-tal uncertainty and improve the confidence of a protocol evaluation. 181
LIST OF FIGURES
6.2 Conceptual Statistical Test Framework applies non-parametric tests to compare the distributions of the results obtained from the
exper-iments and simulations . . . 184
6.3 TelosB network setup using a small network for a better control of the experiment environment . . . 188
6.4 TheA-values for different sample size taken from two set of exper-imental results (Hardware and Simulator) . . . 190
6.5 Box-Whisker plot with Median and Inter-quartile range for PDR for different sample sizes and failure durations . . . 192
6.6 Mean and the Error Bar for PDR taken from different sample sizes with different failure durations . . . 193
6.7 Box-Whisker plot with Median and Inter-quartile range for RO taken from different sample sizes and failure durations . . . 197
6.8 Mean and the Error Bar for RO taken from different sample sizes with different failure durations . . . 198
A.1 Network Topology 5 by 5 (Figure A.1(a)) and 7 by 7 (Figure A.1(b) 211 A.2 Network Topology 10 by 10 . . . 212
A.3 Network Topology 15 by 15 . . . 213
A.4 Network Topology 20 by 20 . . . 214
Acknowledgements
• To my parent, without your love, teaching and guidance, I will not be who I am today.
• To my beloved wife, Memeriahneh Loo for always being here for me through-out these years, enduring the good and the bad times.
• To my two lovely kids, Aby Wan Hua Lim and Amei Pei Ying Lim for being lovely and understanding children during my absence and cheering me up during my presence.
• To Jon and Iain for taking all the efforts to supervise me throughout the PhD. It has been a great pleasure working with you both.
• To my siblings, close families and relatives for the support and advise.
• To my friends for the friendly encouragement and always be there to listen to me complaining. All the joy and fun will never be forgotten.
• To the Government of Brunei, Institut Teknologi Brunei, and Brunei High Commissioner in United Kingdom for the financial support and logistics.
• To the staffs and colleagues in Computer Science Department, Real Time Systems Group (RTS), Non-Standard Computational Group (NSC), and York Centre for Complex Systems Analysis (YCCSA) for the technical support, knowledge and discussion poised throughout these four years.
• Finally, to the examiners, Prof Uwe Aickelin of University of Nottingham and Dr Leandro Soares Indrusiak of University of York for the interesting discussions and helpful comments, time and efforts during theviva voce.
Declaration
The work in this thesis has been carried out by the author between December 2009 and November 2013 at the Department of Computer Science, University of York. Apart from work whose authors are clearly acknowledged and referenced, all other works presented in this thesis were carried out by the author. The results of this work have been previously published or submitted for publication by the author. A complete list of refereed publications is as follows:
• T. H. Lim, I. Bate, and J. Timmis. Multi-modal routing to tolerate failures. In Proceedings of the 7th International Conference on Intelligent Sensors, Sensor Networks and Information Processing, pages 211−216. IEEE, 2011.
• T. H. Lim, H. K. Lau, J. Timmis, and I. Bate. Immune-inspired self healing in wireless sensor networks. In C. Coello, J. Greensmith, N. Krasnogor, P. Li, and M. Nicosia, G.and Pavone, editors, Artificial Immune Systems, volume 7597 of Lecture Notes in Computer Science, pages 42−56. Springer Berlin Heidelberg, 2012.
• T. H. Lim, I. Bate, and J. Timmis. Validation of performance data using ex-perimental verification process in wireless sensor network. In Proceedings of the 16th Conference on Emerging Technologies Factory Automation. IEEE, 2012.
• T. H. Lim, I. Bate, and J. Timmis. Systematic experimental analysis and evaluation of routing protocol in wireless sensor networks. InProceedings of the 2012 UK Electronics Forum. IET, 2012.
• T. H. Lim, I. Bate, and J. Timmis. Self-adaptive fault tolerance systems for a dependable Wireless Sensor Network, Special Issue on Self-Adaptive Networked Embedded Systemsin Design Automation for Embedded Systems. Springer Journal, 2013. [To be published]
Beside the refereed publications, part of the literature reviews of the thesis are taken from the author’s qualifying dissertation and progress report submitted to the department during year 1 and 2 of the PhD.
• T. H. Lim. Detecting anomalies in Wireless Sensor Networks. Qualifying Dissertation. University of York, 2010
• T. H. Lim. Managing Transient failures in Wireless Sensor Networks. Progress Report. University of York, 2011
CHAPTER
ONE
Introduction
1.1
Motivation
Wireless Sensor Networks (WSNs) consist of a number of wireless sensor nodes that are deployed across an area of interest to perform surveillance and moni-toring tasks (Akyildiz and Vuran, 2010). They have become a popular area of research in recent years due to their huge potential to be used in various ap-plications. Ever since the first smart dust military project proposed by Kahn et al. (1999) using small communication device, different application areas have emerged including wildlife monitoring (Mainwaring et al., 2002; Anthony et al., 2012), plantation monitoring (Langendoen et al., 2006), health-care (Malan et al., 2004), fire detection systems (Liu et al., 2013), and military operation (L´edeczi et al., 2005). With the adoption of WSNs in safety critical systems, it is not only sufficient for WSNs to maintain operating for a long period of time with best ef-fort delivery service. They must provide a reliable end-to-end communication for the application to maintain operation. Despite various success stories of WSNs in test environments, evidence from previous deployments have shown unaccept-able levels of reliability (Shakshuki et al., 2009). With limited and irreplaceunaccept-able energy resources available in the node, nodes can fail due to battery depletion. The energy consumption highly depends on the protocols operating on the node. There is a need to improve the reliability and efficiency of the WSNs protocols in order to operate in a dynamic and changing environment.
1.1 Motivation
1.1.1
Wireless Sensor Networks
Sensor nodes are originally designed to monitor and collect information from the environment and send the information to a central location over a wired network. These nodes usually rely on their on-board local power sources such as batteries or energy harvesting device for data collection, processing and communication. With the recent advancement in microchip and communication technology, the wired communication module has been replaced with a tiny radio transmitter that has the capability to transmit over the air (Chong and Kumar, 2003). Con-sequently, each sensor node becomes an independent and autonomous unit that has the ability to forward its data using the radio as a means of communication. This provides an extra level of flexibility for the sensor nodes to be deployed any-where, anytime without the needs for expensive wiring. As a result, WSNs can be applied to various applications ranging from toys to household applications, from hobbies to safety critical applications.
1.1.2
Dependable Wireless Sensor Networks
For the WSNs to be applicable to safety critical systems and acceptable to the users, the individual nodes, including the hardware components and software running on it, must be made dependable to provide the level of service required for the application to function. According to Avizienis and Laprie (1986), a net-work can only be dependable if ”reliance can justifiably be placed on the services it delivers”. This definition highlights the need for a network to have confidence and be trustworthy. A more measurable definition of dependability is stated by Avizienis et al. (2004a) as:
”The ability to avoid service failures that are more frequent and more severe than is acceptable to the user(s).”
There is a need to avoid failure that may lead to negative consequences on the systems affecting their operations and dependability. Avizienis et al. (2004a) has described dependability as an integrated concept that constitutes of the following attributes namely availability, reliability, safety, integrity, and maintainability. In this thesis, we focus mainly on the operation aspects of dependability namely Re-liabilityandAvailability. Based on these properties, a definition of dependable WSNs for our research works is:
The ability for the networks to deliver the level of service, in term of packet reliability and network availability, specified by the application at a desirable level of confidence.
1.1 Motivation
1.1.3
Effect of Radio Abnormality on the Dependability of
Wire-less Sensor Networks
With the use of wireless channels, the radio and the packet data can easily be exposed and subjected to anomalies (Karlof and Wagner, 2003). According to Chandola et al. (2009), anomalies are observations that do not correspond to a well defined notion of normal behaviours. Anomalies in WSNs can be caused by errors, malfunction and attacks. These anomalies may cause the network software to function properly or even lead to network outage, affecting the dependability of the WSNs. The fact that the nodes share the same radio frequency spectrum used by other wireless devices cannot always guarantee a reliable communica-tion, making them vulnerable to signal distorcommunica-tion, ambient noise and interference. Studies by Boers et al. (2010) have shown that interferences created by these wire-less devices can disrupt the normal routing operation of the sensor node leading to significant packet losses and delays. As a reliable communication is an impor-tant aspect in the safety critical systems, a dependable routing is required that is resistant to the network anomalies related to radio interference.
1.1.4
Dependable Routing
To achieve sufficient level of dependability in WSNs, different fault prevention and recovery solutions have been proposed in the WSN literature to tolerate fail-ure either through the development of new protocols or enhancement of existing protocols. Most of these works have focused on reactive routing due to its en-ergy saving on-demand ability to discover a new route when communications between two nodes are required.
Reactive routing protocols such as Adhoc On-demand Distance Vector (AODV) have the ability to discover the route when required (Perkins and Royer, 1999). AODV uses the flooding mechanism to broadcast the route request to determine for new route during failure and can be very expensive to perform. Hence, it must be used sparingly. AODV does not distinguish failure. It relies on the link layer feedback and the distance traverse by the packet to determine whether to broad-cast for new route or drop the packet. As WSNs are prone to different failures with different durations caused by neighbouring nodes, external radio devices, moving object and operating environments, nodes can suffer from transient, in-termittent and permanent failure. A combination of these failures can occur and produce a complex unpredictable behaviour that cannot be addressed with a sin-gle protocol. For example, transient failures may trigger the link layer to notify failure to the AODV and result in route discovery. When the next-hop neighbour
1.1 Motivation
experiencing the transient failure recovers, it will respond to the request while other nodes propagate the route request to all its local nodes. This will create a ripple effect that may congest the network. It is necessary to provide a reliable mechanism for the nodes to change their routing strategy according to the cur-rent network topology in order to re-establish the network connection. This leads to a motivation to investigate the potential of integrating different routing proto-cols to switch between different protoproto-cols for different interferences in order to answer the first research question below:
Research Question 1: Can we improve the dependability of WSNs by in-tegrating and switching between different routing protocols using a multi modal approach to function according to its operating environments?
1.1.5
Fault Tolerance Approach toward Dependability
In order to provide an appropriate routing strategy, the node must be able to identify and diagnose the failure quickly and reliably. It is necessary to build a fault tolerance network that has the ability to deliver the required service in the presence of faults (Avizienis et al., 2004a). The first step toward tolerance is detection.
Anomaly detection in WSNs has attracted significant attention over the last 10 years based on comparing the current network condition with a normal network pattern (Xie et al., 2011). Any deviation from the normal pattern will be declared as anomaly. To design an Anomaly Detection System (ADS) for WSNs is a chal-lenging task due to the limited resources in the nodes. Most of the techniques in-vestigated by Xie et al. (2011) are based on the assumption that the normal model does not change during operational time and it is generated offline. This is not practical in WSNs due to dynamic operating environments of the sensor nodes triggering a change in the normal model. The inaccessibility of the nodes and the limited network communication bandwidth can make the nodes difficult to be updated. Hence, the nodes should be able to detect changes in their environment online and update the normal model individually. Another problem with current WSN’s ADS is that none of the fault tolerance detections has been implemented as most existing WSNs ADS highlighted by Karlof and Wagner (2003) are tailored toward malicious attacks.
Alternative fault tolerance approaches based on immune systems called Ar-tificial Immune System (AIS) have been applied in a wide variety of application areas to maintain the systems integrity and functionality (Hart and Timmis, 2008). De Castro and Timmis (2002) define AIS as ”Adaptive systems, inspired by theoretical
1.1 Motivation
immunology and observed immune functions, principles and models, which are applied to problem solving”. Over the years, many immune-inspired ADSs have been suc-cessfully applied to WSNs to detect and recovery from anomalies (Davoudani et al., 2007; Wallenta et al., 2010). This is partly motivated by the analogy be-tween the characteristics of WSNs and the immune system such as distributed, autonomous, self-organise, scalable and prone to failures. As WSNs nodes are susceptible to interference from other radio emitting devices, there is a need to investigate the immune theories to integrate detection, diagnostic and recovery to rectify these failures and improve the response rate, energy efficiency and de-pendability of the WSNs. This motivates the application of AIS to address the second research question:
Research Question 2: Can an immune-inspired algorithm be applied to assist the routing protocol to detect and classify the different characteristics of the non-intentional interference in order to recover from network failures?
1.1.6
Establishing Dependability with Confidence
The task to demonstrate dependable WSNs does not only involve the develop-ment of a reliable protocol, but also the evaluation process must provide a suf-ficient level of confidence that the protocol is dependable. Due to the high cost in deploying real sensor motes, researchers have used experimental tools such as simulator (NS2, 2002) and pilot study (Szewczyk et al., 2004) to evaluate the dependability of WSNs. Like any other software, the routing protocol must be tested comprehensively using those tools before it is deployed to remove any er-ror that may be introduced during design and testing. There is a need to assess the confidence regarding the achievable dependability level of the routing proto-cols.
Designing a good testing strategy based on the real world is not always easy (Langendoen et al., 2006). WSN systems too often fail to provide expected re-sults once deployed. It is complicated and complex to capture and model the real environment in simulation. Real Deployment usually fails even though it has been tested repeatedly. Langendoen et al. (2006) claim that the design and testing of WSNs protocols are hardened by the lack of effective testing and evaluation approach to produce a confident feedback on a critical figure of merit such as packet delivery reliability and network availability, that is necessary when trying to assess the network ability to perform within a persistent level of dependability across different operating environments. There is a need to conduct a compre-hensive evaluation to analyse the level of tolerance on uncertainty that presence
1.2 Statement of Hypothesis
in an experiment. Hence, statistical analysis is necessary to reduce the impact of uncertainty in order to achieve a sufficient level of confidence that is a representa-tive of the prognostic results. A combination of simulation and sensor hardwares is used to evaluate the dependable routing protocol of WSNs to investigate the third research question:
Research Question 3: Can the dependability of network protocol be demon-strated by reducing the experimental uncertainty using state of the art sta-tistical techniques?
1.2
Statement of Hypothesis
Based on the motivations and research questions highlighted in the previous sec-tion, the hypothesis of this thesis is formalised as follows:
Dynamically switching routing protocols can improve a Wireless Sensor Network’s performance based on immune-inspired monitoring, however understanding its performance requires a systematic statistical evaluation.
1.3
Contributions
In Chapter 2, a survey on the existing literature has revealed that the components of the WSNs are unreliable and prone to failure. The issues of dependability have been widely ignored. Failures can occur in different parts of the WSNs. A causal link between the failures is identified. In order to satisfy the dependability of the emerging sensor network application, the key design properties required for a dependable WSN are proposed namely: fault tolerance, energy efficiency, scalability and adaptability. To evaluate the fault tolerance approaches applied in WSNs, a comprehensive survey is conducted. The results from the analysis have shown that there are still some gaps in the existing fault tolerance techniques applied in the WSNs protocols such as the ability to adapt to different failures, integrated fault tolerance to repair the network, and dynamic detection model.
It is necessary to construct an experimental testbed and evaluate the depend-ability of the WSNs protocols to identify the limitation highlighted in Chapter 2. A dependability assessment of existing protocols in WSNs is presented in Chap-ter 3. The methodology employed to evaluate the performance of the WSNs is described. An interference model based on the ON/OFF model to simulate the failures generated by radio emitting devices is proposed. The results from the
1.4 Organisation of Thesis
simulation on different routing protocols have demonstrated that a routing pro-tocol does not always give the same performance when different failures are in-troduced. One protocol may outperform the other in condition X, but the oppo-site in Condition Y where X and Y represent different failure conditions. There is a need to adapt the routing protocol according to the failures.
The main contribution of the work is presented in Chapter 4 to address the single modal issue highlighted in Chapter 3. A multimodal technique to switch between different operating modes is proposed in order to adapt the changing environment. This approach is implemented in the network layers using the re-active routing protocol as a case study. A Multi-modal Routing Protocol (MRP) is presented and evaluated on a simulator to measure its reliability and perfor-mance. The simulated results have shown that the multimodal approach has a higher dependability compared to a single mode.
The second main contribution in Chapter 5 applies the immune-inspired algo-rithms to assist the MRP to provide a co-ordinated automated recovery. An AIS algorithm, the Receptor Density Algorithms (RDA) proposed by Owens et al. (2012), is extended to identify the failures and interact with MRP to provide a response in order to rectify the failure. The Interference Detection and Recovery Systems (IDRS) is proposed and evaluated in real hardware and simulation. The IDRS has improved the response provided by the routing protocol.
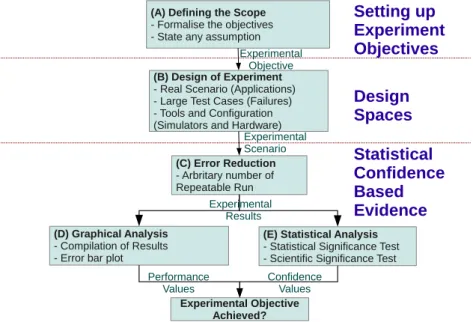
Chapter 6 presents a systematic evaluation approach to demonstrate the de-pendability of the protocol using non-parametric statistical techniques. A Sys-tematic Protocol Evaluation Technique (SPET) is proposed to reduce the uncer-tainties in the experiment and to assess the confidence of the measurements taken from the experiments. The Conceptual Statistical Test Framework (CSTF) is pro-posed to cross-validate the results obtained from both hardware and simulations in SPET. By using SPET, the dependability of the protocol can be evaluated and the confidence level on the dependability can be measured.
1.4
Organisation of Thesis
• Chapter 2 introduces the WSNs and the importance of dependability in WSNs. It presents the threats in WSNs that can affect the dependability of the network and investigates some of the fault tolerant approaches applied to WSNs. A survey of existing routing protocols and the current state of the art approaches to evaluate the performance of the routing protocols is presented.
1.4 Organisation of Thesis
• Chapter 3 provides some of the existing methods to evaluate the performance of the WSNs. A comparison between four commonly used reactive routing protocols is evaluated by simulation to assess the ability to rectify anomalies in a dynamic environment.
• Chapter 4 proposes the Multi-Modal approaches to improve the fault tolerance of the routing protocol in a dynamic changing environment. It re-uses and integrates existing reactive routing protocols presented in Chapter 3 to switch between different operating modesto handle different failure conditions. The robustness and scalability of the routing protocol are analysed and evaluated using a simulator.
• It is necessary to determine the cause of the failure online in order to provide a quick and effective response. Chapter 5 introduces an immune-inspired al-gorithm called the Receptor Density Alal-gorithms (RDA) to classify the current radio patterns collected by the nodes to improve the recovery. The RDA is integrated with MRP to provide an automated self-healing system to detect, diagnose and respond based on the current state of the networks. The relia-bility and the overhead generated by IDRS are evaluated against MRP in both real hardwares and simulation.
• In order to demonstrate the dependability of the proposed MRP, we propose a statistical approach to evaluate the WSNs in Chapter 6. It applies the con-cept of Correctness, Consistency, Completeness, and Cost-effectiveness (4Cs) to measure the effectiveness of the different evaluation strategy. A systematic protocol Evaluation Technique (SPET) is proposed in order to establish confi-dence in both the simulation and the real world WSNs deployment. The MRP is used as a case study to evaluate the benefit of SPET.
• In Chapter 7, the thesis is concluded with a discussion of the main contribu-tions and potential avenues for future work.
CHAPTER
TWO
Towards a Dependable Wireless
Sensor Networks
In order to understand the issues of dependability in WSNs, it is essential to in-troduce the fundamental components in Section 2.1, and present the properties of the WSNs in Section 2.2. We highlight the needs of a dependable WSNs in Section 2.3. The concept of failure in WSNs is formalised in Section 2.4 before different failures in WSNs are investigated in Section 2.5. Section 2.6 highlights some of the existing fault tolerance approaches to detect, diagnose and recover from these faults and identifies some of the limitations of existing approaches. In order to investigate the potential of the application of immune-inspired solu-tion to address the limitasolu-tions, an introducsolu-tion of the immunological theory and a review of existing algorithms applied in a fault tolerance system are presented in Section 2.7. As the routing protocol plays an important role in ensuring the operation of the WSNs, different reactive routing protocols are introduced and compared in Section 2.8. In order to evaluate the dependability of these routing protocols. existing state of the art experimental approaches is presented in Sec-tion 2.9. This chapter concludes with a summary of the key challenges in SecSec-tion 2.10.
2.1
Wireless Sensor Networks
WSNs consist of spatially distributed autonomous wireless sensing devices that interact with the environment to capture and send the data to the user through
2.1 Wireless Sensor Networks
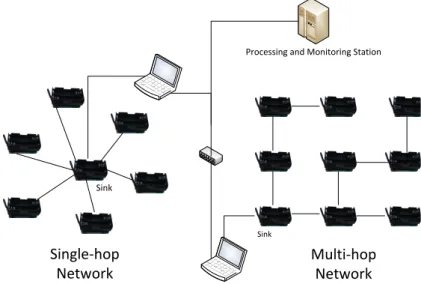
a computer system (Akyildiz and Vuran, 2010). It may range from tens to thou-sands of sensor nodes distributed across a wide area. The nodes are usually de-ployed in a predefined location to provide complete coverage (Zou and Chakrabarty, 2007). During operation, a source serves as an interface to the real world to mon-itor and collect environmental information. This information is processed into data packets before they are transmitted to the sink or base station via a single-hop or multisingle-hop network depending on the distance between the source and the sink as shown in Figure 2.1. Single-hop network provides a better data delivery reliability than multihop network as each transmitted packet can immediately be acknowledged by the sink upon receiving the data packet (Brownfield et al., 2006). However, the source may its transmission range if the destination is out-side the boundary of the transmission range of the source, requiring more energy resources that may reduce the network life (Raghunathan et al., 2002). In con-trast, a node in a multihop network can communicate with other nodes at a lower transmission power as long as the two nodes are within their radio transmission range. This reduces the energy consumption in the node. Hence, the multihop network is the preferable network that will be investigated in our research works.
Single-hop Network Multi-hop Network Sink Sink
Processing and Monitoring Station
Figure 2.1: WSNs deployment showing the single-hop (left) and multihop net-work (right). In a multihop netnet-work, a routing protocol is required.
As shown in Figure 2.2(a), each mote can be divided into two units: the core unit and the optional unit. The core unit hosts the main components required for the mote to function. The optional unit may consist of sensors board, charg-ing module, position locator and response module (Akyildiz et al., 2002). The microprocessor of a typical node shown in Figure 2.2(b) usually has a limited processing power to run the systems software and process the sensed data. The
2.1 Wireless Sensor Networks
memory module is usually small in size of around 10K bytes of RAM and 100K bytes of flash RAM for data, configurations and application storage. The commu-nication module consists of a radio transceiver and is used to transmit or receive packets. The mote can either be powered directly from an energy source such as a computer or from a battery source (Sohraby et al., 2007). The lifespan of a battery powered node highly depends on the energy utilisation consumed by the operations of the individual node. Energy harvesting techniques such as so-lar and vibration have been proposed as an alternative energy source. However, Anthony et al. (2012) have shown that sensor motes cannot always benefit from these technologies as these energy sources are not always available for charging. As a result, an energy efficient protocol is necessary to prolong the operations.
Memory Power Module
Communication Module (Radio, GSM) Micro-processor ADC Recharging Module (Solar power, Hydro power) Position Locator (Global Position System) Response Module (Actuator / Mobiliser / Alarm) Optional Unit Core Unit Sensor(s) Module (Temperature, Humidity, Light)
(a) The components of a mote (b) A Typical commercial node (TelosB mote)
Figure 2.2: An example of WSNs Hardware
For a node to perform the task assigned, specialised system software are in-stalled and run on the mote to regulate its operation. Due to the limited resources in the node, these software are usually designed with careful consideration on the resource availability with minimal complexity.
Communication Stack
WSNs build on the IEEE 802.15.4 multi-layered standard for low-rate wireless personal area networks (WPAN) to provide the physical and link layer frame-work for low data rate communications systems and low power consumption application (Howitt and Gutierrez, 2003). Additional network and the transport layers are defined by the WSN industrial standards. The functionalities of each layer are described below.
• Physical layer (PHY) acts as an interface to radio channel and controls the functions related to the radio frequency (RF) transceiver such as the trans-mission and reception of the packets, the clear channel assessment (CCA),
2.1 Wireless Sensor Networks
and RF energy detection (ED). Simple data modulation, transmitting and receiving techniques have been used to reduce complexity and energy re-quirements of the WSN. CCA detects the channel occupancy by perform-ing ED or Carrier Sense (CS). Commercial sensor node shares the same RF with other wireless devices and operates at 2.4 GHz, using the 16 channels available under the IEEE 802.15.4, each labelled sequentially from 11 to 26 (IEEE, 2006a). As illustrated in Figure 2.3, some of these channels overlap with other home devices like Wireless Local Area Network (WLAN) and can interfere with the radio and the operation of the nodes. Although in-dustrial standards such as WirelessHART (Song et al., 2008) and ISA100.11a (ISA100, 2009) address the issue of interference by employing Frequency Hopping Spread Spectrum (FHSS) where the channel used for data trans-mission will alternate in random sequence at packet level, an agreement on the frequency to use is necessary. It does not overcome the interference from other devices using similar approaches such as Bluetooth. Hence, it is criti-cal to identify and overcome these interferences in order to reduce failures. The frequency hopping mechanism can be applied for recovery.
2.405 2.410 2.415 2.420 2.425 2.430 2.435 2.440 2.445 2.450 2.455 2.460 2.465 2.470 2.475 2.480 Freq/GHz Ch 1 Ch 2 Ch 3 Ch 4 Ch 5 Ch 6 Ch 7 Ch 8 Ch 9 Ch 10 Ch 11 Ch 12 Ch 13 Ch 14 Ch 15 Ch 16 Ch 1 Ch 6 Ch 11
802.14.5
Networks
802.11 b,g and n
Networks
Figure 2.3: Frequency Allocation for WSNs starts from channel 11 to 26. Channel 26 is usually used in WSN experiment as it is not utilised by WLAN (802.11).
• Data link layer provides functions such as Medium Access Control (MAC), error detection and control. It is responsible for the establishment of a re-liable link between the nodes. The MAC protocol plays an important role in deciding the network protocol to be implemented in the layer above in order for the communication stack to function correctly. The topology of the network is also dictated by the MAC protocols used in which protocols
2.1 Wireless Sensor Networks
such as the Time division multiple access (TDMA) usually has hierarchi-cal topology while Carrier sense multiple access with collision avoidance (CSMA/CA) is mostly flat-based. The IEEE 802.15.4 uses the CSMA/CA as the default MAC protocol. It is flexible and does not require any time syn-chronisation (IEEE, 2006a). Assigning an effective time schedule in TDMA can be very difficult and expensive to perform in WSNs especially in a large network. Hence, the CSMA/CA protocol is used in this thesis.
• Network layerhosts the routing function including the network addressing, packet forwarding and the error recovery. It is dependent on the applica-tion requirement and network architecture. The routing funcapplica-tion usually relies on the link layer to detect failures. It maintains the quality of service required by the transport and application layers. Although conventional data distribution approaches like flooding and gossiping can be applied to send the data across the network, it can create unnecessary wastage in the communication bandwidth and energy by sending redundant informa-tion across the networks (Zhang et al., 2009). Hence, a routing protocol is necessary to forward the data packet across the multihop network, control network flow and reduce communication overhead.
• Transport layer maintains the reliability and quality of data flow between nodes. It provides packet-loss recovery and congestion control mechanism caused by network congestion, packet collision, buffer overflow and node failure. Currently, the two approaches applied are based on the node-to-node or end-to-end reliability. In the node-to-node-to-node-to-node reliability, intermediate nodes in the networks store the forwarding packet in their buffer (Wan et al., 2005). The end-to-end reliability uses an end-to-end transmission in which the source will keep all the transmitted packets until an acknowledgement is received (Iyer et al., 2005). Both protocols require communications be-tween the sender and receiver to update the delivery status. Due to the lim-ited memory space to buffer the forwarding packets, industrial standards such as like ZigBee and Specknet have omitted the transport layer (Arvind and Wong, 2004). They attempt to provide the reliability function at the lower layer of the communication stack to reduce the processing and com-munication overhead between layers.
Applications layer
The application layer hosts the software that is responsible for presenting the information to the users, provides interface to the environment and accepts
re-2.2 Design Challenges in WSNs
quests from the layer below. Langendoen (2008) classifies the types of WSNs applications into periodic-based and event-based. In periodic-based application, data is captured and sent to the end users periodically, for instance every 30 sec-onds for a pulse oximetry application (Chipara et al., 2010). In event-based appli-cation, the source only detects and sends critical information to the users when an unusual event is detected by the sensor (Liu et al., 2010). In a static network, the periodic-based application usually discovers the path to the sink when it is first set up and is only updated when there is a communication failure along the route. In contrast, the routing information for an event-based application may need to be checked or updated more frequently to ensure that the path to the sink is still exist and the routers are alive. Both types of applications generally require to operate over a period time in order to provide the services required.
2.2
Design Challenges in WSNs
In recent years, a large body of research in WSNs has evolved in improving the communication protocol in order to prolong the operation of the networks (Hatler, 2012). Only a limited number focuses on improving the reliability and robustness of the WSNs. During the development of any WSNs protocol, it is essential to address and incorporate the following properties of the WSNs in the design:
P1: The resources availability such as memory and processing, communication bandwidth and the radio capability on the nodes. The nodes are usually
resource constraints.
P2: Thehigh densityof the sensor nodes.
P3: Theuncontrollable operationof the wireless medium due to interference, fad-ing and contention makfad-ing the networkprone to failure,
P4: Thedynamic topologyof the network that isdistributedandautonomous with-out a centralised controller.
P5: Therealisationof the reliable operation during real deployment network.
In order to satisfy the dependability of the emerging sensor network appli-cation, the design of the WSNs hardware and system software must exhibit the following properties including fault tolerant, energy efficiency, scalability and adaptability.
2.2 Design Challenges in WSNs
2.2.1
Tolerate failure
In a fault-tolerant network, the nodes must have the ability to deal with nodes or links failure to maintain reliability and provide continuous operation of the net-works. Explicit fault tolerant can be provided if there are a sufficient number of redundant nodes available to provide the coverage required for sensing or com-munication (Luo et al., 2006). However, to determine the minimum number of the nodes without the nodes interfering with each other can be a challenge. As a result, implicit detection and recovery are necessary to improve the reliability and robustness of the nodes to failure. One technique to achieve reliability is by retransmission (Balakrishnan et al., 1997). Zheng et al. (2011) highlight that re-transmission in WSNs can improve the packet delivery when wireless channel is in a mild or bad condition. However, maximising the reliability through retrans-mission may increase the network energy consumption substantially and increase packet delay that may affect the timeliness of the packet received (Fonseca et al., 2006). Depending on the type of applications, timing delay may dictate the per-formance and stability of a control system (Moyne and Tilbury, 2007). Hence, the network designers need to consider the trade-off between reliability and energy consumption as higher reliability may result in higher communication overhead and hence energy consumptions (Zheng et al., 2011).
2.2.2
Efficiency
As the nodes have limited processing power, small memory storage, shared trans-mission bandwidth and are usually battery powered, each node must manage and utilise these resources effectively. Consequently, protocols used in WSNs have to be lightweight and energy-efficient to prolong the availability of the node to provide the services required by the application. As the requirement attributes for the safety critical application such as high reliability and low latency may re-quire significant energy, these attributes must be prescribed accordingly to meet the level of assurance required for the application to meet its target. These ap-plications can usually tolerate up to a certain degree of packet losses (10-20%) and delays (Schenato et al., 2007; Moyne and Tilbury, 2007). Hence, maximising packet delivery while minimising the delay to the optimum level is not always necessary since these strategies can significantly reduce the network lifetime. As the radio communication is a major energy consumer in WSNs, it needs to be op-timised. Most existing literature has focused on energy-efficient networking pro-tocols for WSNs. According to Sohraby et al. (2007), energy efficiency in WSNs can be achieved in three ways:
2.2 Design Challenges in WSNs
• Duty cycling with periodic switching between the node’s operation modes in order to conserve energy and increase the life time of the network.
• Local processing to reduce the energy required by radio transmission.
• The use of multihop network to minimise the long-range transmission range. However, Tate and Bate (2010) highlight that multihop generates more mes-sages that may cause more collision and hence higher energy consumption.
2.2.3
Scalability
Scalability is another challenge due to the large-scale and dense deployments. WSNs can be deployed indoor or outdoor in large scale in the order of hundreds or thousands. The variation of the number of nodes in the network highly de-pends on the application running on it. The nodes are usually deployed in close proximity to each other to achieve a higher sensing coverage and redundancy (Chipara et al., 2010). Hence, the protocols should be able to adapt to variation in the network size and avoid inter-nodes interference.
2.2.4
Adaptability
Adaptability is the other challenge due to the lack of infrastructure and network dynamics. WSNs do not have a fixed infrastructure as the network logical topol-ogy can change due to the unreliable communication links or nodes that fluctuate between connecting nodes. Every node requires to self-organise and operate in-dependently in order to be flexible to the continuously changing environment. The system software in the node need to respond to both internal stimuli gener-ated within the node and external stimuli genergener-ated from the environment. The internal stimuli may be generated due to the changes in application’s require-ment or an error in the system software, while the external stimuli is produced due to the time varying wireless channels, the dynamic variations of the network or the occurrence of events. Hence, each node must possess self-adaptive and self-healing capabilities to cope and adapt to spatial and temporal changes of the operating environment.
2.2.5
Discussion
As a result of these properties, the design of the WSNs systems components has to take into accounts a number of development factors such as the correct im-plementation, operation and fault tolerance of the system to provide dependable
2.3 Dependable WSN
service. As the communication protocol forms a major part of the WSNs, it is critical to design and evaluate the effectiveness of the communication protocol that satisfies the application requirements and optimises the energy efficiency of the systems. Safety Critical Systems (SCS) such as the fire detection and rescue and the health monitoring usually consist of a set of measurable service attributes imposed by the applications in terms of reliability, availability, delay, and energy consumption. These attributes can be applied to assess the dependability of the WSNs by ensuring that these requirements have been met at a sufficient level.
2.3
Dependable WSN
To allow for the application of WSNs into SCS domain, a high degree of depend-ability is necessary. These safety critical applications demand not only energy ef-ficient operation to prolong operation, but also strict data delivery performance. In particular, data must be transported to a sink in a timely and reliable fash-ion. Based on the definition of dependabilitygiven in Section 1.1.2 of Chapter 1, it can be comprehended as the ability for the networks to provide the packet re-liability and network availability specified by the application at a desirable level of confidence despite of the occurrence of faults in the networks. The results from previous studies have shown that there is growing evidence where the de-ployment of WSNs in real world is unreliable. Some of the failures highlighted include packets loss, communication failures induced by the operating environ-ments, and short term availability caused by power exhaustion (Tolle et al., 2005; Huo et al., 2009). Despite the existing success stories of achieving dependability for the traditional SCS, the solutions proposed are not easily transferable to the re-source constraint WSNs. The classical approaches often require complex software that cannot be performed online in WSNs. As a result, alternative dependability enhancing techniques such as fault detection, identification and recovery are es-sential to maintain or increase the acceptable level of dependability in WSNs.
2.4
Failures in WSNs
Before fault tolerance techniques can be applied in WSN, it is necessary to under-stand the failure characteristics of WSNs. The WSNs are found to be unreliable in existing literature (Langendoen et al., 2006; Tolle et al., 2005). The application and communication protocols running are primarily designed to be energy efficient using non-complex algorithms in order to reduce the energy consumption and computational cost (Langendoen et al., 2006). The hardware may be deployed to
2.4 Failures in WSNs
operate in an unattended manner for a long period of time and exposed to differ-ent environmdiffer-ental condition that may deteriorate the node’s hardware compo-nents (Tolle et al., 2005). For these reasons, WSNs are prone to failure.
2.4.1
Fault, Error and Failure
According to Avizienis and Laprie (1986), a fault is a defect or incorrect state of the hardware or software that can occur in any part of the system. This fault is usually untraceable until an error has occurred. An error corresponds to an incorrect and unknown state of the system that can lead to failure. A failure may occur if the error is not detected and rectified (Laprie, 1985). When a failure occurs, the system may deviate from its specification and unable to deliver its intended functionality. An unattended failure may later lead to further faults and errors of the system forming a chain reaction as depicted in Figure 2.4. An error is the manifestation of a fault in the system, and a failure is the result of such error on the service (Avizienis and Laprie, 1986).
Fault
Error
Failure
Communication Fault (Radio) Forwarding Error (Node) No packet received (Network)
Figure 2.4: Formation and manifestation mechanisms of faults, errors, and fail-ures: The arrows show the relationship between the three states and the fields in the brackets show the location where the abnormalities are experienced.
For example in Figure 2.5, an application running on node 1 is required to send sensor readings periodically to node 4 via node 2 and 3. As node 2 is about to forward a data packet, the node’s radio channel in node 3 may experience a radio communication fault induced by external interference (fault state). Since node 2 does not detect the presence of interference in node 3, node 2 will attempt to send the packet that may result in irregular packet loss (error state) due to the stochasticity of the interference. As a result, the application running on node 4 will not be able to receive the data packet and an irregular network outage (failure state) is experience by the users. This erroneous condition may lead to further application fault if the degrading network condition is not detected and rectified.
2.4 Failures in WSNs
Therefore, it is critical to detect these irregular patterns and recover from thefault
at the earlier stage to prevent application failure.
1
2
3
4
Figure 2.5: Examples of manifestation of faults caused by communication fault in WSNs: Node 1 is periodically sending packet to node 4 via node 2 and 3. Node 3 experiences radio fault that lead to packet forwarding error in node 2 and eventually fail network and application if the error is not rectified.
2.4.2
Fault Characteristics
Siewiorek (1990) classifies faults into three types:
• Permanent: Fault, usually in hardware, that is continuous to appear until the faulty component is replaced. It is considerably easier to detect.
• Intermittent: Fault that occurs occasionally due to an unstable system state.
• Transient: Fault that occurs temporarily due to environmental condition.
Based on the given definitions of faults, it is difficult to distinguish the tempo-ral characteristics of the intermittent and transient faults and provide a prognosis of these faults. The ability to detect a transient fault that can lead to reduced per-formance and eventual failure of the network is vital as the response required to rectify the fault can be made before it fails the network. Siewiorek (1990) makes the distinction based on the ability to detect the fault. An intermittent fault is usually detectable as it exhibits a repeatable failure pattern but a transient failure is more difficult to detect and recover. For example, the intermittent fault can be discriminated by evaluating the rate of fault occurring which is relatively high (Bondavalli et al., 2000). In contrast, transient failure is usually related to tem-porary environmental factor that is usually rectified by the system software or when the source of error disappeared. However, due to the design of the system
2.5 Type of Anomalies
software, this error may trigger inappropriate response that may aggravate the networks (Tseng et al., 2002). For example, the self-reactive nature of the rout-ing protocol to cope with transient error (obstruction) has resulted in congestion and network outage (Szewczyk et al., 2004). It can be very difficult to detect and predict the outcome of the transient fault as it adverse effects are usually irregu-lar and may disappear rapidly (Bondavalli et al., 2000). However, the reaction of events generated by the fault on the network is conspicuous. For instance, faulty radio communication might not be directly observable but the unusual low num-ber of packet errors in the forwarding node of the WSNs (i.e. the data delivery) can be observed. Bondavalli et al. (2000) highlight that the detecting a fault may require repetitive testing at the discrete time interval. By analysing the changes in data flow within a time window, it is possible to detect that an error has occurred. Due to the complex and dynamic characteristics of WSNs, it is important to detect and determine the irregular transient fault at run-time to prevent network failure. It is crucial to understand the type of faults that can occur in WSNs to ensure that the right technique can be apply to tolerate them. These faults, also known as anomalies, are discussed in the next section.
2.5
Type of Anomalies
WSNs are commonly deployed in a harsh environment where each node can be subject to anomalies. These anomalies in WSNs can occur in the hardware as well as in any of the communication protocols. Physical hardware faults are usually induced internally that may affect its components and system software due to un-reliable hardware and limited resources (Langendoen et al., 2006). The interaction faults are errors that are generated externally affecting the communication pro-tocols, for instance, radio interference in the channel affecting the links. In order to address the research questions in Chapter 1, it is crucial to understand these anomalies in the WSNs domains to identify the failures that may degrade the WSNs protocol. From literature survey conducted on the previous deployments of WSNs, anomalies can present in the hardware, software, network, communi-cation, or data. The following subsections investigate the four types of anomalies that have occurred in the real deployment of WSNs as a result of the faults.
2.5.1
Data anomalies
Data anomalies are errors that occurred in the information received in the sink. Inconsistency in measurement is usually considered as anomaly and needs to
2.5 Type of Anomalies
be detected and eliminated. Data anomalies can be caused by processing faults (Elnahrawy and Nath, 2003), hardware fault (Ni et al., 2009) or malicious attack (Wang et al., 2006). Elnahrawy and Nath (2003) have classified the sources of data errors as systematic and random errors. Systematic errors are caused by changes in the operating conditions and calibration errors of the sensor node. Random er-rors are usually introduced by external noise such as environmental interference and inaccuracy to measurement and computational techniques. These errors can affect the accuracy of the sensor reading. For example, Tolle et al. (2005) reported that the data obtained from the sensors were out of normal range and did not correlate with the each other when the voltage of the battery fell below 2.4 volts. Systematic errors may be generated by long operation of the nodes that may af-fect the component or applications running on the nodes, such as the calibration of the sensors or timing drift in synchronisation (Ni et al., 2009). Data anomalies that are produced intentionally can occur when an attacker injects false packet or retransmits packets into the network after gaining access to the sensor node (Wang et al., 2006). This attack can deplete the battery of the node and cause network congestion (Raymond and Midkiff, 2008). However, intentional data anomalies in real have not been reported and are only performed in test lab or simulation to show the ability of WSN to avoid threat against malicious attacks.
2.5.2
Node anomalies
Node anomalies occur when the node is unable to perform the tasks it is assigned to. Node anomalies can be caused by hardware (Szewczyk et al., 2004) or software faults (Werner-Allen et al., 2006). The node is usually manufactured at low cost and can be easily damaged due to impact or extreme weather condition. During deployment, sensors may be dropped from high altitudes damaging the outer protective enclosure and exposing the internal components of the sensor nodes (Kahn et al., 1999). Sensors may be damaged or disconnected from the node due to ground impact causing intermittent or continuous false alarms or misses. For instance, node failure due to short circuit has been reported by Szewczyk et al. (2004) when the circuit board of the sensor node was exposed to direct contact with water. The low quality hardware and appropriate antenna design are also reported by Langendoen et al. (2006) as the contributing factors to the node fail-ure for a large scale deployment of potato cultivation where no useful data were captured. Some nodes may run out of power due to the limited on-board energy resources (Tolle et al., 2005). The limited computational and storage resources available on a node may restrict the amount of processing that can be performed