e-Journal of English Language Teaching Society (ELTS) Vol. 3 No. 1 2015 t ISSN 2331-1841 Page 1
IMPROVING READING COMPREHENSION
OF THE SECOND YEAR STUDENTS
THROUGH RECIPROCAL TECHNIQUE
Ulfi Nurlianti1, Mochtar Marhum2, Wahyudin3
Abstract
The objective of this research was to find out the use of Reciprocal Technique
FRXOG LPSURYH VWXGHQWV¶reading comprehension of the second year students of SMP Negeri 7 Palu. This research used quasi experimental research design in which the two classes received pre-test and post-test. The population was the second year students of SMP 7 Palu. The sample was selected by using cluster random technique. Class VIII B with 24 students was the experimental group and class VIII A with 25 students was the control group. In collecting the data, the researcher used observation and test. The observation was conducted before the pre-test and the test was used twice as pre-test and post-test in the experimental and the control groups. The data were analyzed statistically. Having analyzed the data, it was revealed that there were different scores obtained by the control group and the experimental group. In other words, the t-counted (6.93) is greater than t-table (2.014). It means that Reciprocal Technique can be used to improve the reading comprehension of the second year students of SMP Negeri 7 Palu.
Keywords: Reciprocal; Reading; Reading Comprehension
INTRODUCTION
English language is the most widely used language around the world. Everybody knows that language is one of the ways to communicate. Because English is an important language, it becomes compulsory subject in Indonesia from junior high school up to university level. The implementation of English teaching at present is based on the content standard. Its aim is to make the students be able to reach an informational level of literacy.
Reading comprehension is extremely important because it gives significant contribution to students to perform their communication skill better. In other words, by having insufficient ability in understanding texts, students will find difficulties to master language skills. Reading comprehension is a complex process in which the readers have to put on their ability to comprehend or to understand the meaning from written text. In their daily life, students are always related to the written or printed words, for instance: text books, magazines,
1
Prodi Pendidikan Bahasa Inggris FKIP Universitas Tadulako - email: [email protected] 2
email: [email protected] 3
e-Journal of English Language Teaching Society (ELTS) Vol. 3 No. 1 2015 t ISSN 2331-1841 Page 2
newspapers, announcements, letters, even advertisements. By reaching good reading comprehension, the students can catch the information given by the writer well. Regarding to the usefulness of reading, the students are expected to master this skill.
Reading a scientific book especially English text is considered difficult for students. Most students only read a text without understanding what the content of the text is about. It cannot be denied that people do not get anything of what has been read. It happens because they have lack of vocabulary and as the result they do not understand it. The common reason is also due to lack of vocabulary items practiced in class. The students usually complained of the length of the text provided by the teacher.
There were some problems faced by the students of SMP Negeri 7 Palu in comprehending the reading text. Firstly, most of them have lack of vocabulary. Vocabulary is one of the language components that cannot be avoided in comprehending reading text. Therefore, if the students have limited stocks of vocabulary and grammar mastery, they will get difficulty to understand the passage. Secondly, the students have difficulty to find out the meaning of some words because they have multiple meanings, therefore, they get confused to catch the meaning. Thirdly, they pay attention to the literal meaning of one by one word only rather than understand the whole sentences contextually. Then they spend much time to accomplish the assignments. They do not know how to make their time efficient. Another problem is that they usually got bored when studying in the class. When teaching the students about reading comprehension, most teachers sometimes ask the students to read the reading text and then to answer the questions which are provided in the text book. As the result, the students have insufficient ability in reading comprehension because the teacher never train them to comprehend the reading text as good as possible.
The factors above were the problem faced by the students of SMP Negeri 7 Palu that had to be overcome. Helping the students to handle this problem was the obligation of English teachers. The English teachers need to create appropriate and joyful techniques to
LPSURYH WKHLU VWXGHQWV¶ UHDGLQJ FRPSUHKHQVLRQ 7KURXJK WKLV UHVHDUFK WKH UHVHDUFKHU
conduFWHG RQH WHFKQLTXH WKDW FDQ EH XVHG WR LPSURYH VWXGHQWV¶ UHDGLQJ FRPSUHKHQVLRQ
Reciprocal technique is one of the techniques in teaching reading comprehension that involves the group of students to do the tasks in order to comprehend the text. Reciprocal technique is a cooperative reading strategy that engages teams of students in predicting, questioning, clarifying, and summarizing (Palinscar and Brown, 1984).The reason for choosing this technique was that the researcher considers this technique would be very useful to help the students to comprehend the content of reading text.
e-Journal of English Language Teaching Society (ELTS) Vol. 3 No. 1 2015 t ISSN 2331-1841 Page 3
Based on the statements above, the researcher formulated a research question as follows:
can the use of reciprocal technique improve reading comprehension of the second year students of SMP Negeri 7 Palu? It was to find out that reciprocal technique can improve
VWXGHQWV¶ UHDGLQJ FRPSUHKHQVLRQ RI WKH VHFRQG \HDU VWXGHQWV RI 6031 3DOX
METHODOLOGY
In this research, the researcher used quasi-experimental research design which consisted of two groups. They were experimental and control groups. Both of these groups got pre-test and post-test. However, the experimental group got the treatment by using reciprocal technique while the control group did not. After doing the treatment, both of them got post-test in order to see the influence of reciprocal technique during the treatment. In addition, the result of pre-test and post-test in the experimental or the control groups were compared. The design of this research is proposed by Hatch and Farhady (1982:22) as follows: G1= T1 X T2 G2= T1 T2 Where: G = experimental group G2 = control group
T1 = pre-test for experimental/control group
T2 = post-test for experimental/control group
X = treatment
According to John ³$ 3RSXODWLRQ LV D JURXS RI LQGLYLGXDOV ZKR KDYH WKH VDPH FKDUDFWHULVWLFV´ 7KH SRSXODWLRQ RI WKLV UHVHDUFK ZDV WKH VHFRQG \HDU VWXGHQWV RI 603
Negeri 7 Palu which has six classes. They are VIIIA, VIIIB, VIIIC, VIIID, VIII E and VIIIF. The total number is 147 students.
$FFRUGLQJ WR &UHVZHOO ³$ VDPSOH LV D VXEJURXS RI WKH WDUJHW SRSXODWLRQ WKDW WKH UHVHDUFKHU SODQV WR VWXG\ IRU JHQHUDOL]LQJ DERXW WKH WDUJHW SRSXODWLRQ´ 7KH VDPSOH LV
taken by using cluster random sampling technique to determine which class as experimental and control group.
In this research, the researcher used cluster random sampling because each class on the second year students of the target school has the same or equal chance to be the sample. The researcher administered the sample of her research. Firstly, the researcher provided six pieces of papers. Secondly, she wrote the name of the class. Then, she folded up and put them
e-Journal of English Language Teaching Society (ELTS) Vol. 3 No. 1 2015 t ISSN 2331-1841 Page 4
into a box. Finally, she shook the pieces of paper from the box thoroughly. The first fallen paper was the experimental group and the second one was the control group.
In this research, the variable consisted of dependent and independent variables. The
LQGHSHQGHQW YDULDEOH ZDV 5HFLSURFDO 7HFKQLTXH DQG GHSHQGHQW YDULDEOH ZDV VWXGHQWV¶
reading comprehension.
In collecting the data, the researcher used test as the instruments of the research. Test is the main instrument given in the pre-test and the post-test. The pre-test was used in order to find out the basic skill of the students in reading, while the post-test was the test given to the
VWXGHQWV E\ WKH UHVHDUFKHU WR PHDVXUH WKH VWXGHQWV¶ UHDGLQJ FRPSUHKHQVLRQ 7KH VWXGHQWV JRW
post-test after getting the treatment.
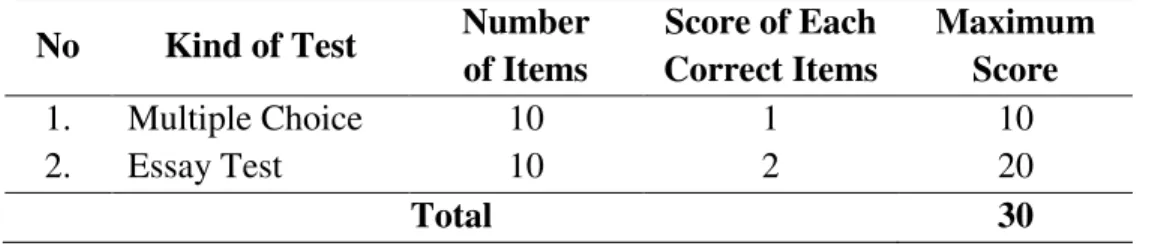
Table 1 The Scoring System
No Kind of Test Number
of Items Score of Each Correct Items Maximum Score 1. Multiple Choice 10 1 10 2. Essay Test 10 2 20 Total 30 Adapted from KTSP 2006
To find out the ability of the students in comprehending the text, the researcher computed the score that has been obtained during teaching learning process by applying the formula proposed by Margono (1996: 208) as follows:
z|= •y žÚÙÙ Where: NP VWXGHQW¶V LQGLYLGXDO VFRUH R = raw score SM = maximum score 100 = constant number
After the researcher computed the individual score, she computed the mean score. In analyzing the data, the researcher used statistical analysis. The researcher used the formula proposed by Gay (1996:449) as follows:
„% = ³ž z
Where:
:$ = mean score
yx = sum of score
e-Journal of English Language Teaching Society (ELTS) Vol. 3 No. 1 2015 t ISSN 2331-1841 Page 5
After getting the mean score of both experimental and control groups, the researcher computed the sum of squares from the pre-test and the post-test by using the following formula (Gay, 1996:486) as follows:
SS= ³„Û±(³„) Û z
Where:
55 = sum of squares
™:2 = sum of square score
™:)2 = square of the sum
N = total of number subjects
After obtaining the sum of squares, the researcher analyzed the data in order to find out the significant difference or testing hypothesis by using t-counted formula (Gay, 1996:486) as follows:
t =
„$$$$FÚ „$$$$Û §d••Ú+ ••Û ”Ú+”ÛFÛhd Ú ”Ú+ Ú ”Ûh Where: :1$$$$ = mean of experimental group
:2
$$$$ = mean of control group
55
1 = sum of squares on of experimental group 55
2 = sum of squares of control group J
1 = number of experimental group J
2 = number of control group
FINDINGS
The researcher conducted the pre-test for the experimental group (VIII B) on Tuesday, September 30th 2014 and for the control group (VIII A) on Tuesday, September 30th 2014, but it was conducted in different time because both classes had English subject on Tuesday. The resulst of the pre-test of both classes are shown in table 2 and 3.
After computing the deviation score between pre-test and post-test from experimental
JURXS WKH UHVHDUFKHU FRPSXWHG WKH PHDQ VFRUH RI WKH VWXGHQWV¶ VFRUH WKDW SUHVHQWHG DV
follows:
„
%
=
Ä z=
Ã: 0=
680.01 24= 28.33
e-Journal of English Language Teaching Society (ELTS) Vol. 3 No. 1 2015 t ISSN 2331-1841 Page 6 Table 2
7KH 6WXGHQWV¶ 6FRUH 'HYLDWLRQ(x2) of Pre-Test
and Post-Test of Experimental Class
No Initials students' score deviation (X2-X1) X2 pre-test post-test 1 ADE 50 80 30 900 2 AFR 40 70 30 900 3 AND 50 76.67 26.67 711.29 4 AKB 40 56.67 16.67 277.89 5 FAH 43.33 70 26.67 711.29 6 FIR 40 76.67 36.67 1344.69 7 FIT 13.33 50 36.67 1344.69 8 IKB 50 73.33 23.33 544.29 9 KAR 46.67 73.33 26.66 710.76 10 KIN 46.67 73.33 26.66 710.76 11 MAF 43.33 53.33 10 100 12 NID 36.67 66.67 30 900 13 AFI 43.33 70 26.67 711.29 14 FAD 43.33 73.33 30 900 15 ALD 43.33 70 26.67 711.29 16 RIF 46.67 76.67 30 900 17 RIN 46.67 73.33 26.66 710.76 18 SAR 43.33 80 36.67 1344.69 19 WAH 40 56.67 16.67 277.89 20 WAL 43.33 83.33 40 1600 21 RUL 43.33 80 36,67 1344.69 22 UNI 56.67 86.67 30 900 23 WIN 56.67 86.67 30 900 24 ZUL 20 50 30 900 Total 680.01 20356.27
Then, after calculating the mean deviation of the experimental group, the researcher calculated the sum of the square deviation by using the formula below:
•• Ú= ‚T2F :‚ T;2 0 = 20356.27F :680.01; 2 24 = 20356.27F 462413.6 24 = 20356.27F 19267.23 = ÚÙáâ.ÙÝ
e-Journal of English Language Teaching Society (ELTS) Vol. 3 No. 1 2015 t ISSN 2331-1841 Page 7 Table 3
7KH 6WXGHQWV¶ 6FRUH 'HYLDWLRQ RI 3UH-test and Post-test of the Control Class
No Initials students' score Deviation X2
pre-test post-test X2-X1 1 AAN 36.67 46.67 10 100 2 RUL 40 33.33 -6.67 44.49 3 ADI 23.33 50 26.67 711.29 4 AHM 40 40 0 0 5 CAN 36.67 46.67 10 100 6 DIN 26.67 53.33 26.67 711.29 7 DEW 40 50 10 100 8 AZR 43.33 56.67 13.34 177.96 9 LIS 50 43.33 -6.67 44.49 10 IKB 30 43.33 13.33 177.69 11 BAL 20 30 10 100 12 WIN 30 66.67 36.67 1344.69 13 ELM 36.67 43.33 6.66 44.36 14 NUR 53.33 66.67 13.34 177.96 15 LAT 43.33 53.33 10 100 16 PUT 40 40 0 0 17 FAJ 20 40 20 400 18 SAR 43.33 33.33 -10 100 19 JUL 33.33 26.67 -6.66 44.36 20 RIF 30 33.33 3.33 11.09 21 WAY 26.67 40 13.34 177.96 22 JUF 20 30 10 100 23 SYU 50 76.67 26.67 711.29 24 RIF 43.33 36.66 -6.67 44.49 25 YUD 26.67 26.67 0 0 Total 223.35 5523.41
After finding the deviation score between pre-test and post-test from control group, the
UHVHDUFKHU DOVR FDOFXODWHG WKH PHDQ VFRUH RI WKH VWXGHQWV¶ VFRUH WKDW SUHVHQWHG DV IROORZV
[
D
= Ä z ;D 2 = Ã: 0 ;D 2 = 223.35 25 ;D 2 = 8.93Moreover, the researcher analyzed the mean deviation of the control group. She calculated the sum of the square deviation by using the formula below:
e-Journal of English Language Teaching Society (ELTS) Vol. 3 No. 1 2015 t ISSN 2331-1841 Page 8 •• Û= ‚T2F :‚ T;2 0 = 5523.41F :223.35; 2 25 = 5523.41F 49885.22 25 = 5523.41F1995.41 = 3528
To see whether there was a significant difference between the means of the two groups in the post-test, the researcher compared them by using statistical formula as follows:
t =
$$$$F„Ú $$$$„Û §d••Ú+ ••Û ”Ú+”ÛFÛhd Ú ”Ú+ Ú ”Ûht =
Ûá.ÜÜFá.âÜ §BÚÙáâ.ÙÝ + ÜÞÛá ÛÝ+ÛÞFÛ CB Ú ÛÝ+ Ú ÛÞCt =
Úâ.Ý §BÝßÚà.ÙÝ Ýà CB ÛÞ+ÛÝ ßÙÙ Ct =
Úâ.Ý §âá.ÛÜ×BÝâ ßÙÙCt =
Úâ.Ý ¾âá.ÛÜ×Ù.Ùát
= Úâ.Ý ¾à,áß = Úâ.Ý Û.áÙ = 6.93 DISCUSSION7KH UHVHDUFKHU OLPLWHG KHU UHVHDUFK RQ WKH VWXGHQWV¶ FRPSUHKHQVLRQ RI WKH UHDGLQJ WH[W 6KH LQYHVWLJDWHG VWXGHQWV¶ FRPSUHKHQVLRQby seeing their vocabulary and grammar in the test. In this case, there were two kinds of test: multiple choice focusing on vocabulary and essay test focusing on grammar. The maximum score of multiple choice was 10 and the maximum score of essay test was 20.The standard score of English at the school was 65. Based on the result of pre-test in both groups, there were 0% of students who got >65 and 100% of them who got <65. In other words, none of the students could get the standard score. Related to the result of pre-test in experimental group, it shows that in vocabulary the students who got score •7 were 41% and there were 20.83% of students who got score • in grammar. In
FRQWUDVW WKH VWXGHQWV¶ UHVXOW RI SUH-test in control group shows that in vocabulary the students who got score •7 were 32%,while in grammar there were 20% of students ZKR JRW VFRUH •
e-Journal of English Language Teaching Society (ELTS) Vol. 3 No. 1 2015 t ISSN 2331-1841 Page 9
After giving the pre-test to the students, the researcher gave them treatment to know the significant progress by each student before they got a post-test. In doing the treatment, the researcher divided the students into 5 groups and they did some steps in reciprocal technique, they are predicting, questioning, clarifying, and summarizing. Firstly, the researcher wrote the title of the reading text in the whiteboard without giving the reading text to them. In this step, the students predicted what the text tells about. Secondly, the researcher distributed the reading text and gave enough time for silent reading according to the length of text to the students. In this step, the students explored the meaning of the text and identified the kind of information, and then they provided substance for a question in the reading text. After that, they turned the information into a question form. Thirdly, the students asked the teacher about the text which they did not understand in order to make it clear. In this step, the researcher explained the text that made the students confused. Finally, summarizing which allowed the students to comprehend the text by paraphrasing or reviewing the point of the text. Meanwhile, the students in control group did not get the treatment or the researcher did not use any specific technique to teach the students in control group.
7R ILQG RXW WKH LPSURYHPHQW RI WKH VWXGHQWV¶ UHDGLQJ FRPSUHKHQVLRQ DIWHU WKH\ JRW WKH
treatment, the researcher conducted the post-test in both experimental and control groups. Based on the result of the post-test, it showed that both groups had progress, but the progress itself was different. It can be described by using the percentage. There were 79.17% of students in experimental group who got >65 and 20.83% of them who got <65. In contrast,
WKH VWXGHQWV¶ UHVXOW LQ FRQWURO JURXS VKRZV WKDW % of students who got >65 and 88% of them got <65. The post-test result of experimental group was increased significantly. Furthermore, the result of post-test in experimental group shows that in vocabulary the students who got score •7 were 72% and there were 83.33% of students who got score • in
JUDPPDU ,Q FRQWUDVW WKH VWXGHQWV¶ UHVXOW RI SRVW-test in control group shows that in vocabulary the students who got score •7 were 40%,while in grammar there were 40% of students who got score • Therefore, the result verified that the researcher could improve
WKH VWXGHQWV¶ UHDGLQJ FRPSUHKHQVLRQ E\ DSSO\LQJ UHFLSURFDO WHFKQLTXH In addition, the researcher found out that there was a significant difference between pre-test and post-test. The result of the test showed that the hypothesis of this research was accepted and null hypothesis was rejected. It indicates that the objective of this research was proved.
Furthermore, the researcher compared her research finding with previous research one which had been done by Widyawati (2013). Both this research and previous research have the same result since they applied reciprocal technique in improving reading comprehension
e-Journal of English Language Teaching Society (ELTS) Vol. 3 No. 1 2015 t ISSN 2331-1841 Page 10
successfully. Besides, they also have some differences. The researcher conducted research by using descriptive text, while Widyawati (2013) did a research by using narrative text. The last difference is on the level. This research was done at the second year students of junior high school, yet Widyawati (2013) did research at the eleventh grade students of senior high school. Thus, the researcher can draw statement that the reciprocal technique was effective in improving reading comprehension since it had been applied by using descriptive or narrative text itself and in any levels even though it has some differences.
CONCLUSION AND SUGGESTIONS
After the researcher did the research, she concludes that the use of reciprocal technique
FDQ LPSURYH VWXGHQWV¶ UHDGLQJ FRPSUHKHQVLRQ RI WKH VHFRQG \HDU students of SMP Negeri 7 Palu. Reciprocal technique is one of the effective techniques that could help the students to improve their reading comprehension. It is proven by the value of tcounted (6.93) is greater than
ttable (2.014). It means that researcheUV¶ K\SRWKHVLV LV DFFHSWHG 7KHUH LV DOVR D SURJUHVV YDOXH RI WKH VWXGHQWV¶ PHDQ VFRUH LQ WKH H[SHULPHQWDO FODVV IURP LQ WKH SUH-test to (71.11) in the post-test.
Having conducted the research, the researcher would like to offer some suggestions for the improvement of learning reading comprehension. Firstly, teachers should apply appropriate method, approach, technique, and medium when they teach English to the students especially in teaching reading comprehension. Secondly, for students, they should study harder, even though their score of reading comprehension is good. They have to do more practices to increase their reading comprehension. Finally, the researcher suggests that other researchers should use various techniques in order to make the students master many vocabularies and it will be easier for students to comprehend reading texts.
REFERENCES
Creswell, J.W. (2005). Educational Research. Planning, Conducting, and Evaluating Quantitave and Qualitative Research (Second Edition). New York: University of Nebraska.
Gay, L.R. (1996). Educational Research. New Jersey: Prentice Hall, Inc.
Hatch & Farhady. (1982). Research Design and Statistics. Los Angeles:CaliforniaUniversity Press.
John, W.C. (2005). Educational Research: Planning, Conducting and Evaluating Quantitative and Qualitative Research. Nebraska: University of Nebraska.
e-Journal of English Language Teaching Society (ELTS) Vol. 3 No. 1 2015 t ISSN 2331-1841 Page 11
KTSP. (2006). Kurikulum Tingkat SatuanPendidikan: BahasaInggris.Jakarta: DepartemenPendidikanNasional.
Margono, S. (1996). Methodology Penelitian Pendidikan. Jakarta: Rineka Cipta.
3DOLQFVDU $ 6 %URZQ $ / ³5HFLSURFDO WHDFKLQJ RI FRPSUHKHQVLRQ-fostering and comprehension-monitoring activities´.Cognition and Instruction. 1(2), 117±175. [Online] available: http://tandfonline.com/doi/abs/10.1207/s1532690xci0102_#preview (Retrieved, February 10th 2014)
Todd, R.B& Tracey D.H. (2006).Reciprocal Teaching and Comprehension. New Jersey: Kean University.
Widyawati. (2013). Improving Reading Comprehension on Narrative Textthrough Reciprocal Teaching Technique. Pontianak: Tanjungpura University (Unpublished Skripsi).