Quantifying the Impact of Transit Rider
Perception and Satisfaction on User Cost:
An Experiential Sampling Approach Using
Smartphones
byIan Dunlop
A thesis
presented to the University of Waterloo
in fulfillment of the
thesis requirement for the degree of
Master of Applied Science
in
Civil Engineering
Waterloo, Ontario, Canada, 2018
ii
Author’s Declaration
This thesis consists of material all of which I authored or co-authored: see Statement of
Contributions included in the thesis. This is a true copy of the thesis, including any required final revisions, as accepted by my examiners.
iii
Statement of Contributions
Portions of this thesis have been previously published in a conference preceding or presented at conference. The following provides a listing of the sections of the thesis that have been previously published/submitted for publication in whole or in part and the citation for the publication.
Content of Chapter 3
Dunlop, I., Casello, J. and Doherty, S. T. (2015) “Tracking Transit Rider Experience: Using Smartphones to Measure Comfort and Well-Being Throughout the Trip” (15-5944) - F17 94th Annual Meeting of the Transportation Research Board, Washington, D.C., January 11-15.
iv
Abstract
The aim of travel demand modelling is to accurately estimate trips in future time periods by understanding current travel behaviours. Accurate generalized cost modelling for determining transit mode share has proven elusive. Arbitrary weight factors are used to adjust models to reflect real world modal split. It is believed that what is missing are incorporating perceptual influences, and more generally, how the satisfaction associated with a mode of transport plays into making transit a less cost-competitive and desirable travel alternative than cost models predict. This research uses experiential sampling method to capture a transit rider’s perception of satisfaction in real-time by using their own smartphone as an observer. Supplemental data collected by the smartphone’s built in technologies also enable tracking the rider’s movements, linking perception to a physical point. A smartphone application was developed and tested to gather their perceptions and satisfaction of transit system performance. Data from the application were spatially matched to the transit authority’s own automatic vehicle location and passenger count data to validate on-time performance and service loads.
The results demonstrated that while a smartphone application is an effective way to collect data in real-time, and a rich dataset was produced, transit rider satisfaction is not as easily quantified as expected. Each individual has their own perceptions of what it means to be satisfied in experiencing their daily activities. Satisfaction is more effectively inferred through qualitative observation, rather than asked directly. However, the results show correlations between satisfaction and transit system performance, attributes, and the rider’s sensitivity to time. Participants reported significantly lower levels of satisfaction with their trip experience when their perceived wait time was longer than actual wait time.
Deploying this application to a diverse population sample may help to identify the triggers of transit rider dissatisfaction and anxiety towards determining a cost penalty against transit modal split, and where investments can be made to improve the rider experience. However, satisfaction is revealed to be a subjective concept that is difficult to measure directly.
v
Acknowledgements
The author thanks Dr. J. Casello (University of Waterloo) for his supervision, mentorship and generous support of this research, Kevin Yeung (University of Waterloo) for deploying the online pre-survey, Rafik Said (Wilfrid Laurier University) for coordinating survey participants and data collection, and Dr. S. Doherty (Wilfrid Laurier University) for facilitating the earlier work.
vi
Table of Contents
List of Figures ... viii
List of Tables ... ix
1 Introduction ... 1
1.1 Research goals ... 4
1.2 Motivation ... 4
1.3 Thesis Organization... 4
2 Literature Review & Earlier Research ... 6
2.1 Transportation Models ... 6
2.2 Using Utility Theory to Determine Mode Choice ... 8
2.2.1 Changes in Modal Split as a Function of Land Use and Other Attributes ... 11
2.3 Activity Based Models ... 12
2.4 Experience Sampling Method... 13
2.5 Capturing Transit Rider Perceptions ... 14
2.5.1 Wait Time and Value of Time ... 14
2.5.2 Transit Service Characteristics ... 15
2.5.3 Negative perception as a cost penalty ... 16
2.6 Measuring Traveller Satisfaction ... 17
2.6.1 Environmental Conditions at the Bus Stop ... 18
2.6.2 Psychological conditions of the individual ... 19
2.6.3 Transit System Characteristics: ... 20
2.7 Measuring transit experience in real-time ... 23
2.7.1 Concurrent Research ... 23
3 Previous Work: Transit Oriented Experience Survey ... 24
3.1 Overview and intent ... 24
3.2 Developing the TOES Smartphone App... 25
3.2.1 How TOES Works ... 25
3.3 Conducting the Survey ... 26
3.4 Analysis ... 28
3.5 TOES Survey Conclusions ... 30
3.6 Considerations for Subsequent Research ... 31
4 Methods of the WPTI Survey ... 32
4.1 Overview and Purpose ... 32
4.2 Methods ... 33
4.2.1 Stage 1: Pre-trip Survey ... 33
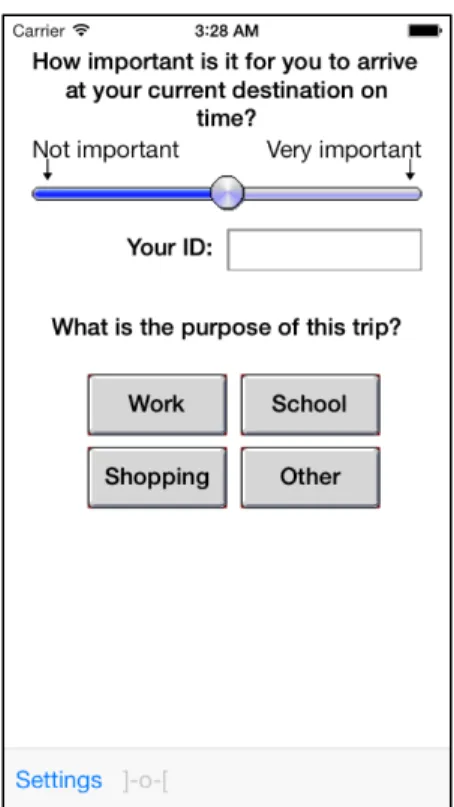
4.2.2 Stage 2: Smartphone Survey App ... 37
4.2.3 In-Trip (On bus) Survey ... 43
4.2.4 Supplemental In-Trip Questions ... 44
4.2.5 End-of-Trip Questions ... 44
4.2.6 Data Submission ... 46
5 WPTI Survey Results ... 47
vii
5.1.1 Pre-Trip Survey ... 48
5.1.2 In-Trip Survey ... 48
5.1.3 Triggers of Dissatisfaction and Anxiety ... 53
5.1.4 Influence of Experiential Perception on Satisfaction ... 56
5.1.5 Influence of Time Sensitivity ... 63
5.2 Spatial Analysis ... 66
5.2.1 Merging Results with AVL/APC Data ... 68
6 Conclusion ... 71
6.1 Research Goals Achieved ... 71
6.1.1 Development and Testing of Smartphone App ... 71
6.1.2 Triggers of Rider Dissatisfaction and Anxiety ... 71
6.1.3 Spatial Data Joining and Technologies ... 71
6.1.4 Influence of Rider Experience and Time Sensitivity ... 72
6.2 Modelling Satisfaction ... 72
6.3 Survey Improvements and Future Research ... 73
References ... 74
Appendices ... 76
Appendix A: App variables ... 77
Appendix B: Original Program Algorithm for WPTI Survey App ... 78
Appendix C: WPTI Survey App – Android Version Code ... 79
Appendix D: WPTI SurveyApp – i-Phone Version Code... 118
viii
List of Figures
Figure 1 – Basic 4-Step Model ... 6
Figure 2 – An example of manipulating a transit modal split model. ... 11
Figure 3 – Survey screenshots to assess perceptions of surroundings and wellbeing. ... 26
Figure 4 – Route map showing location of Group 2’s start, finish and Conestoga Mall ... 27
Figure 5 – Mean survey results aggregated as generalized comfort and wellbeing ... 29
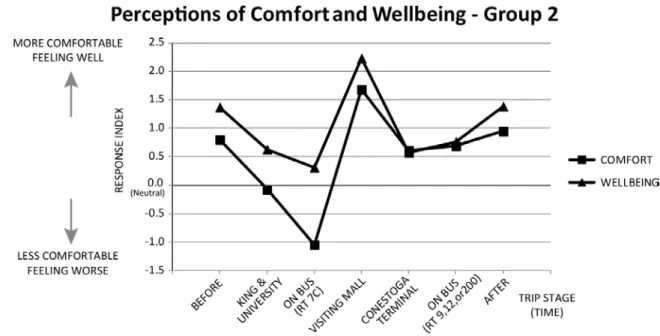
Figure 6 – Normalized Results by trip stage for Group 2 participants. ... 30
Figure 7 – PreTrip ... 34
Figure 8 – Time Sensitivity Questions ... 35
Figure 9 – Participant Travel by Mode ... 35
Figure 10 – Participant familiarity with transit information ... 36
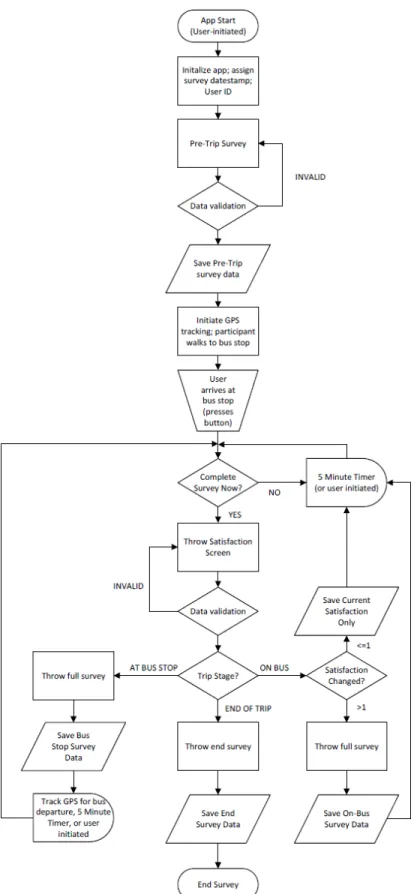
Figure 11 – App development flowchart ... 39
Figure 12 – First screen of the Android App ... 40
Figure 13 – First screen of the iPhone App ... 41
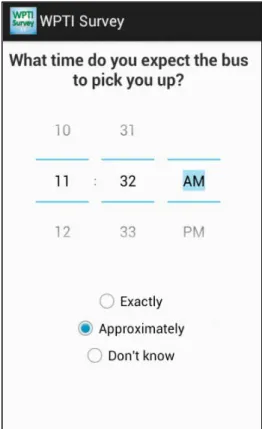
Figure 14 – Android screen for trip time selections. ... 42
Figure 15 – What is your satisfaction with the trip so far? ... 43
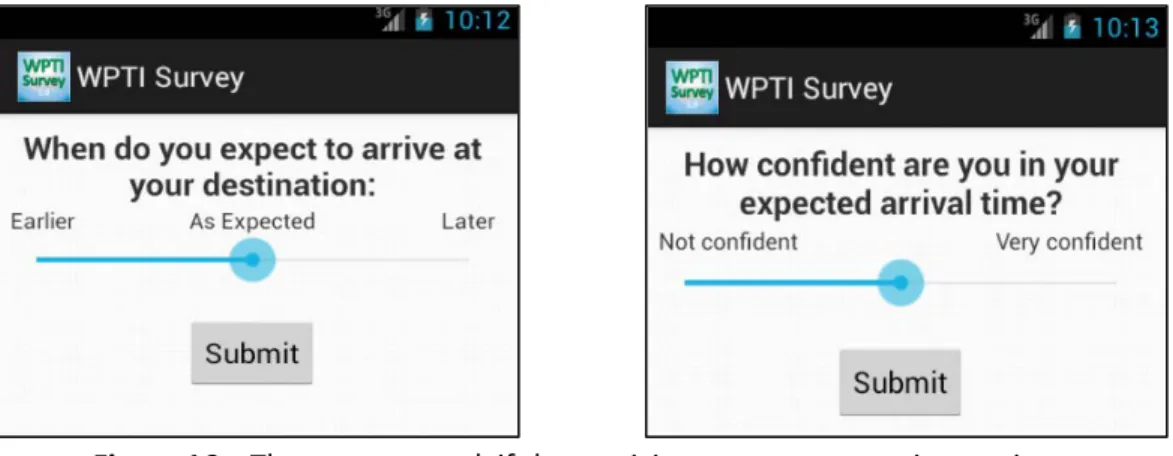
Figure 16 – Survey screen asking if the participant expects to arrive on time, and how confident they are in that expectation. ... 43
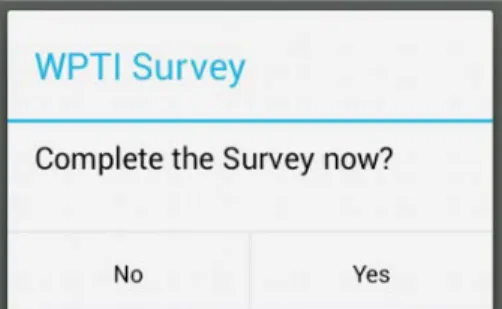
Figure 17 – The “nag” screen, asking the participant to complete the survey after time interval... 44
Figure 18 – Supplemental survey questions ... 45
Figure 19 – End of trip questions ... 45
Figure 20 – Satisfaction by rider experience, trip duration, importance, and sequence. ... 50
Figure 21 – Satisfaction by type of service, trip purpose and scheduled times. ... 51
Figure 22 – Satisfaction compared to the participant’s perception of on-time performance and waiting time at the bus stop. ... 52
Figure 23 – The perception of whether or not the participant will arrive at their destination on time, observed at the bus stop and while on the bus. ... 54
Figure 24 – The confidence of the participant in arriving on time. ... 54
Figure 25 – The participant’s perception of the overall performance of the transit system and how it is influencing their satisfaction. ... 55
Figure 26 – Influence of perceived transit system performance on satisfaction ... 57
Figure 27 – Changes in the perception of comfort during the three stages of the trip and how it is influencing their satisfaction. ... 58
Figure 28 – Influence of perceived comfort and wellbeing on satisfaction ... 58
Figure 29 – Influence of perceived schedule adherence on satisfaction ... 59
Figure 30 – Influence of perceived schedule adherence on satisfaction comparing participants with lower or higher levels of time sensitivity. ... 60
Figure 31 – Influence of weather on satisfaction ... 61
Figure 32 – Influence of combined external factors on rider satisfaction ... 62
Figure 33 – Influence of comfort and performance on satisfaction for low/high arrival time importance ... 64
Figure 34 – Influences of running early or late on perceptions of on-time performance ... 65
Figure 35 – Map showing the GPS data collected from the WPTI Survey ... 67
ix
List of Tables
Table 1 - Time Weight Factors ... 10
Table 2 - Influences on Satisfaction ... 22
Table 3 - Summary of TOES Survey participation ... 27
1
1
Introduction
The aim of travel demand modelling is to accurately estimate trips in future by understanding current travel behaviours shaped by land use, demographics and the transportation network, to inform the regional planning and development process. Utility theory is the popular basis for logit models that predict the probability of selecting one mode of travel over another, such as a trip by private vehicle versus by public transit. Utility takes the form of a generalized cost comparison between the available modes. In its simplest form, generalized cost (GC) between an origin i and a destination j by mode m is comprised of the total travel time multiplied by an appropriate value of time (VOT), plus out of pocket expenses:
𝐺𝐺𝐺𝐺
𝑖𝑖,𝑗𝑗𝑚𝑚=
𝑉𝑉𝑉𝑉𝑉𝑉
(
∑ 𝑡𝑡𝑡𝑡𝑡𝑡𝑡𝑡
𝑐𝑐𝑐𝑐𝑡𝑡𝑐𝑐𝑐𝑐𝑐𝑐𝑡𝑡𝑐𝑐𝑡𝑡𝑐𝑐
) +
𝑐𝑐𝑜𝑜𝑡𝑡
𝑐𝑐𝑜𝑜
𝑐𝑐𝑐𝑐𝑐𝑐𝑝𝑝𝑡𝑡𝑡𝑡
𝑡𝑡𝑒𝑒𝑐𝑐𝑡𝑡𝑐𝑐𝑐𝑐𝑡𝑡𝑐𝑐
(1)
Logit models are predicated on the assumption that the least expensive mode of transportation (i.e. driving by car, walking, public transit, or cycling) will also be the most likely, or the most popular mode. In most North American cities, the most popular mode tends to be the private automobile, because it offers the shortest travel time and greatest convenience. The results change in dense urban cores, where congestion and the cost of parking tip the balance more favourably towards high capacity transit or active forms of transportation, such as walking or bicycling. However, in suburban areas, transit tends to lag behind predicted demand, even when models take into account lower development density and greater distances . The logit model tends to overestimate the proportion of trips that should be taken by public transit, indicating that there are other factors to be considered in how people value and perceive their time, expenses and convenience in deciding how to travel.Accurate generalized cost modelling for transit has proven elusive. Weight factors are empirically derived to adjust the cost model to reflect the real world split between transit and the most popular mode, automobiles. The factors are used to calibrate the model to best match the observed results. A weakness in this approach is it is not sensitive to changes in behaviour over time. One possible approach to improve models (and modeling) is to incorporate perceptual influences, and more generally, how the overall satisfaction of the transit rider influences the cost-competitiveness and desirability of travel alternatives. Unlocking perception as a barrier to modal choice could improve the accuracy of transportation modelling by making adjustment factors less arbitrary.
2
However, there is a problem. One, well-recognized source has made the assertion that traveler behavior cannot be modeled:
Traveler behavior is currently represented in a highly aggregate manner. Factors
influencing travel behavior (e.g., value of time or value of reliability) for different sectors of the traveling public are impossible to model with the current four-step process. This makes it difficult to represent travelers’ responses to access improvements such as fare
integration, changes to parking pricing, fare and parking integration, real-time customer information, and improved transit scheduling to reduce transfer time. (Transportation Cooperative Research Program, 2011).
Compounding this problem is determining whether or not travellers consciously make rational decisions about their travel behaviour on a daily basis in the first place. That rationality in travel choice depends on who are the “choosers” and the “captives.” A chooser has a choice between modes that may be enabled by car ownership. A captive lacks choice, perhaps by socio-economic means, physical well-being, or other form of path dependency.
The perceptions of each type of traveller will be different, notably the perception of time. Contemporary research efforts in the field of transit mode share modelling have focused on different weight factors for the time components of the model, based on how a transit user
perceives time. The time components are: wait time at a bus stop, time in-vehicle, transferring, and service delay. The perceived value of wait time and travel time are different. Swait, Ben-Akiva and Mosche (1986) found that only 10% of workers actually make comparisons between the travel choices available to them, if there is even a choice set of alternatives available. But there is more to the real-world experience than time perception alone.
Another challenge is to understand what the barriers are to initiating behaviour change and other intrinsic biases. Anxiety and discomfort associated with travelling on transit, whether perceived or actual, contribute to the disutility in mode choice. The travel experience immediately before and during a trip on transit could be targeted for improvement, to make the choice more attractive. Therefore, understanding the rider experience could help inform where improvements to both to the modelling, and to the transit service, can be made. Travel surveys attempt to unlock this information.
3
An experiential sampling method (ESM) can be employed to capture a traveller’s perception of their surroundings in real time, in a relatively unobtrusive way. This thesis outlines an ESM involving the use of the transit rider’s own smartphone as an observer. For transportation research, using phones as an ESM offers advantages over traditional paper survey or interview methods because data are not lost in the time lag between the actual user experience and completing a post-trip survey. ESM enables the capture of the rider’s immediate reaction to their surroundings, comfort, and service performance. Supplemental data collected by the smartphone’s built in technologies enable seamless tracking of the rider’s movement through time and space, linking their perceptions and experience to a physical point. Smartphone applications (apps) are an emerging ESM for data collection. The main focus of the research presented in this thesis is towards the development and implementation of such an app.
This ESM is further enabled with data collected by automatic vehicle location (AVL) and automatic passenger counting (APC) systems of transit service providers. Together, these data can provide a rich assessment of the transit rider’s experience from their point of view in comparison to the actual performance data of the transit system. Transit service providers need to appreciate the subtleties of comfort and satisfaction, which go beyond scheduling and route changes. The reliability of the system plays a role, of course. There are, however, other factors at play not the least of which is that the transit user must give up certain aspects of personal control, and
overcome their own emotional barriers and anxieties that are shaped by broader life experiences and individual situations.
The overarching aim of this research is to lead to the development of more accurate generalized cost models for transit mode share. Rider satisfaction is a complex metric that is best measured by observing an aggregate of direct and indirect factors influencing the rider’s perception of their individual transit experience. As will be revealed in this thesis, directly asking the rider to provide their level of satisfaction over the course of a trip on transit reveals a biased outcome, as individuals tend to recalibrate their perception of satisfaction based on their immediate experience. The rider’s criteria for satisfaction change with their surroundings and circumstances as they move through space and time. Satisfaction becomes a compromise between various factors relating to perception meeting expectation at any given time.
4
1.1
Research goals
The overall aim of this research is to validate a proof of concept for using smartphones as an ESM to gather transit riders’ perceptions and satisfaction of transit system performance during their trip. More specifically, the goals of this research are to:
1. Develop and test a smartphone app to track a group of transit riders through space and time to gather their perceptions and satisfaction of transit system performance.
2. Identify the triggers of transit rider dissatisfaction and anxiety that are a cost penalty against transit modal split.
3. Match the collected data to the transit authority’s own automatic vehicle location and passenger count data to validate on-time performance and service loads.
4. Observe the influence of the level of experience and time sensitivity of the transit rider on the results.
With this proof of concept, the smartphone app can be used to gather experiential data from a larger representative population to quantify and qualify the impacts of satisfaction, service reliability, comfort and convenience on rider behaviour. Ultimately, such research could lead to more accurate modelling of generalized costs to predict transit mode share.
1.2
Motivation
This research – to develop a smartphone app to measure transit rider satisfaction – had its genesis in human transportation geography. A smartphone-based experiential survey was modified by the author to assess transit rider experience from a project involving the tracking of human activity and well-being in a natural environment (Doherty, Lemieux, & Canally, 2014). This previous work is discussed in detail later in this thesis. The research methodology aligned with the work of Dr. J. Casello and the Waterloo Public Transportation Initiative (WPTI) at the University of Waterloo, so a much larger smartphone-based experiential survey was developed and tested.
1.3
Thesis Organization
The next chapter is a literature review and summary of previous research. Concepts of
transportation modelling are explored, along with experience sampling methodology. The work of others in measuring transit rider perceptions and behaviour, which forms the basis for this
5
research, is discussed. Chapter 3 describes a previous research project involving the capture of transit rider experience using a smartphone, including analysis of the results and considerations for the current research. Motivated by that previous project, the method of development and testing of the new transit survey app is explained in Chapter 4. Chapter 5 analyzes the results from the data that were collected. Chapter 6 summarizes the findings, conclusions, and identifies possible improvements and expansion of the survey to a wider demographic group.
6
2
Literature Review & Earlier Research
This chapter presents a review of research pertaining to transportation modelling concepts, and surveying and sampling methods to study travel behaviour and user perceptions. A variety of research foci are revealed, including methodologies and outcomes to learn from for the
development and deployment of a transportation survey app for experiential sampling. The first sub-section discusses transportation modelling and transit mode share.
2.1
Transportation Models
An intended outcome of research into transit rider behaviour and satisfaction is to improve the accuracy of travel demand modelling and shifts in modal split (i.e. trips by private car versus public transit). The aim of travel demand modelling is to accurately estimate trips in the future by
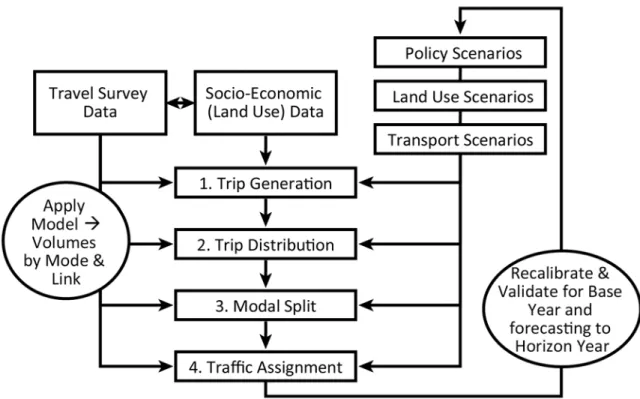
understanding current travel behaviours shaped by land use, demographics and the transportation network. This understanding can then inform the regional planning and development process. This goal is achieved by measuring data for a “base year,” and developing a model to forecast data for a “horizon year.” The 4-Step Model, as shown in Figure 1, below, was until the late 1990s or early 2000s considered the most popular transport model.
7
The process begins with a travel survey of a large representative sample of the population, whereby participants are asked to keep a travel diary of their daily trips over a one week period. The region being studied is divided into Travel Activity Zones (TAZ). The 4-step model is then used to analyse:
• Trip Generation – quantifying the number of trips originating in each TAZ, disaggregated by purpose – and Trip Attraction – estimating the number of trips destined for each TAZ;
• Trip Distribution – the linking of trip origins to trip destinations to create travel matrices;
• Modal Split – estimating the proportion of trips made by each available mode between all origins and destinations;
• Traffic Assignment – assigning each of the trips to a path or transit route. Coupled with the survey results are socio-economic data, including census information,
employment, and land use characteristics. To build the model based on the survey results and these data, regression compares dependent and independent variables to test the strength of the
relationship between them. Multiple independent variables, such as household size, autos owned, employment and population can be used to validate trip generation or attraction. The model is recalibrated until the simulated result most strongly reflects the actual travel patterns of the survey.
A gravity model is the most commonly used method for modelling trip distribution. The basic form of gravity is an attraction force between two masses, which in this case are TAZs. The attractive force of one TAZ on another (trips originating in one TAZ, destined for another TAZ) depends largely on the distance separating them, thereby creating a deterrence factor. Deterrence is usually a function of generalized cost, which is further described below.
The goal of the travel activity model is look at past observations to project into the future. The relationship of travel between TAZs is represented by the equation below.
𝑉𝑉
𝑖𝑖𝑗𝑗=
𝑉𝑉
𝑖𝑖∑ 𝐴𝐴𝐴𝐴𝑗𝑗𝑗𝑗𝐹𝐹𝑗𝑗𝑖𝑖𝑗𝑗𝐹𝐹𝑖𝑖𝑗𝑗𝐾𝐾𝐾𝐾𝑖𝑖𝑗𝑗𝑖𝑖𝑗𝑗(2)
Trips from TAZ i to TAZ j (Tij) are the product of all trips originating in zone i, (Ti) and the attractive
strength of zone j (Aj) relative to all TAZs, and the cost of travel from i to j (Fij) relative to the cost of
8
model to simulate the observed data, smoothing out the imbalances in trip generation and trip attraction between TAZs. The result is a matrix of trips from all origin TAZs to all destination TAZs. The k factor varies depending on the size and scope of the area being observed, but is derived from a best-fit for a sum-of-means or root-mean-square error (RMSE) test. Therefore, calibration often begins with some arbitrary decisions about what parameters will be used to determine the
impedance between zones represented by travel cost (Gray, 1983). This approach “is (very slightly) biased,” as the model is only as good as the available input data, which often leads to determining model parameters through trial-and-error (Hollander, 2010). As such, models can only go so far in forecasting travel patterns. The variety of real-world influences contributing to k, which can be empirically observed, measured and projected, is complex. Extraneous assumptions and lack of data will skew the results away from real-world observations.
Generally, UTP (Urban Transportation Planning) recommends the cost be taken as travel time converted to a monetary value (Gray, 1983). Consideration of other attributes improves the accuracy of the model and is reflective of the more subtle influences of travel behaviour, as summarized below, but converting them to a monetary value is an abstract process.
The cost, C, may be broadly defined as separation, which can include: • the simple spatial separation of distance;
• the state of the travel system reflected by actual travel time;
• extra perceived deterrence of congestion, crowding or waiting for public transport; • out-of-pocket costs for fares, tolls or parking;
• or socio-economic differences, as between a white-collar worker and a blue-collar job. (Shrewsbury, 2012)
Once a 4-Step Model has been calibrated to best represent the travel behaviours of a population, different scenarios for policy, land use, and transport planning can be invoked to see how the travel patterns are impacted. The next section introduces the ideas of utility and mode choice in more detail. These concepts are then discussed in the context of activity based models in section 2.3.
2.2
Using Utility Theory to Determine Mode Choice
Utility theory attempts to understand the benefits (or costs) a consumer receives (spends) in the consumption of a good or product. Utility theory considers both positive and negative
characteristics, and their relative importance, as perceived by the consumer. In transportation modeling, the net benefits, or utility derived by a particular transportation option, in comparison to
9
the utility of the other travel options available between an origin and destination can be calculated. The Generalized Cost (GC) of travel by mode m, between TAZ i and j can be represented as follows:
𝐺𝐺𝐺𝐺𝑖𝑖,𝑗𝑗𝑚𝑚=𝑉𝑉𝑉𝑉𝑉𝑉 (∑ 𝑡𝑡𝑡𝑡𝑡𝑡𝑡𝑡 𝑐𝑐𝑐𝑐𝑡𝑡𝑐𝑐𝑐𝑐𝑐𝑐𝑡𝑡𝑐𝑐𝑡𝑡𝑐𝑐) + 𝑐𝑐𝑜𝑜𝑡𝑡 𝑐𝑐𝑜𝑜 𝑐𝑐𝑐𝑐𝑐𝑐𝑝𝑝𝑡𝑡𝑡𝑡 𝑡𝑡𝑒𝑒𝑐𝑐𝑡𝑡𝑐𝑐𝑐𝑐𝑡𝑡𝑐𝑐
(3)
GC is in dollars ($) and time Value of Time (VOT) converts time in minutes to dollars. Timecomponents include wait time, travel time in the vehicle, and access time (i.e. time to get to or from the transit stop or vehicle). Out of pocket expenses may be the fare, in the case of transit, or parking and toll charges in the case of automobile travel. The GC for transit can be broken-down as follows:
𝐺𝐺𝐺𝐺𝑡𝑡𝑡𝑡𝑡𝑡𝑡𝑡𝑡𝑡𝑖𝑖𝑡𝑡 =𝑉𝑉𝑉𝑉𝑉𝑉(𝑉𝑉
𝐴𝐴𝐹𝐹𝐴𝐴+𝑉𝑉𝐵𝐵𝐵𝐵𝐹𝐹𝐵𝐵𝐵𝐵+𝑉𝑉𝐼𝐼𝐼𝐼𝐹𝐹𝐼𝐼𝐼𝐼+𝑉𝑉𝑇𝑇𝑇𝑇𝐹𝐹𝑇𝑇𝑇𝑇+𝑉𝑉𝐸𝐸𝐹𝐹𝐸𝐸) +𝐹𝐹𝐹𝐹𝐹𝐹𝑡𝑡
(4)
Where• TA = Access time, from trip origin to the boarding bus stop
• TBS = Time waiting at the bus stop
• TIV = Time in vehicle
• TTR = Time in transfer
• TE = Egress time, from egress bus stop to destination
• Fx = Weighting factor for the perception of time • VOT = Value of time (in $ per unit of time)
The GC for automobile differs as it is generally assumed that only TIV is a relevant time component
because an auto can be driven directly from home to a destination. But, the cost of operating the vehicle needs to be considered, along with other out of pocket expenses such as the cost of parking at the destination or toll charges, if any. The resulting equation is:
𝐺𝐺𝐺𝐺
𝐴𝐴𝐴𝐴𝑡𝑡𝐴𝐴=
𝑉𝑉𝑉𝑉𝑉𝑉
(
𝑉𝑉
𝐼𝐼𝐼𝐼𝐹𝐹
𝐼𝐼𝐼𝐼) +
𝐺𝐺 ∗ 𝐷𝐷
+
𝑃𝑃𝐹𝐹𝐹𝐹𝑝𝑝𝑡𝑡𝑐𝑐𝑃𝑃
+
𝑉𝑉𝑐𝑐𝑇𝑇𝑇𝑇𝑐𝑐
(5)
WhereD = Distance travelled
C = Cost per distance unit (in $per kilometre)
The cost to operate the automobile tends to be considered by the auto owner as the incremental cost for the trip, meaning fuel and regular maintenance. To own a vehicle is to accept the “sunk costs” of the original purchase price, insurance and licensing which accrue whether the vehicle is used or not. Hence, transit is perceived at a cost disadvantage when one or more vehicles are already owned at a household; the cost disadvantages is magnified in the cases where suburban parking is “free,” and there are no road tolls.
10
Once the generalized costs of the different modes are determined, the probability of choosing one mode over another can be calculated using a logit model, as follows:
Pr(
𝑐𝑐ℎ𝑐𝑐𝑐𝑐𝑐𝑐𝑡𝑡𝑐𝑐𝑃𝑃
𝑡𝑡𝐹𝐹𝐹𝐹𝑐𝑐𝑐𝑐𝑡𝑡𝑡𝑡
) =
𝑒𝑒−𝐺𝐺𝐺𝐺𝑖𝑖𝑗𝑗𝑇𝑇𝑇𝑇𝑇𝑇𝑇𝑇𝑇𝑇𝑖𝑖𝑇𝑇Σ𝑚𝑚=1𝑀𝑀 𝑒𝑒−𝐺𝐺𝐺𝐺𝑖𝑖𝑗𝑗𝑚𝑚
(6)
In the above equation, the probability of choosing transit for a trip from i to j is a function of the cost of the trip by transit in relation to the sum of all of the costs of the other possible modes for the same trip.
The weighting factors in the transit GC formula (3), Fx, are influenced by the perception and
experience of the individual, and thus selecting appropriate values can be very subjective. Each time component has a different weight factor due to perception. In-vehicle time is considered to be perceived as the normal passage of time, and assigned a value of F=1, unless there is a delay or the vehicle is crowded. Suburban delay may be perceived as more onerous than delay in a densely urban or chronically congested area. Wait time at the bus stop is more onerous than in-vehicle wait time or delay (Iseki, Taylor, & Miller, 2006). Time components with a high disutility are assigned a weight factor of F >1. Examples of time weights from the literature are shown in Table 1 (Ryus, et al., 2013):
Table 1 - Time Weight Factors
Location F
In-vehicle time 1.0
Walk time 2.2
Initial wait time 2.1
Transfer time 2.5
The value of F is also influenced by the expectation of the transit rider. A suburban rider expects less in-vehicle delay due to the typical traffic volumes and performance of the street transportation. A rider in a more densely urban area, or along a corridor where congestion is expected, would have a higher tolerance for being in a slow-moving vehicle. Even though the lateness as a result of the congestion may be the same, or even less, in the suburban scenario, the urban rider would feel more at ease because of the predictability of delay. The transit rider in the suburban scenario would also experience a higher level of time anxiety waiting at the bus stop for less frequent service than the urban rider who is confident that, even if he or she missed the last bus, another bus will be along shortly and their timeline shall continue to meet their service expectation.
11
Time perception can also be influenced by physical characteristics and environmental
characteristics. Amenities at the bus stop area where a commuter waits for the bus, the comfort of the bus ride, the weather, crowding, the rider’s confidence and experience in using the transit system, and the availability of schedule information all influence whether the trip will be perceived positively or negatively. Travel surveys tend to show that transit has a higher share of the modal split in areas with higher population densities, generally because transit becomes a more
convenient option for those traveling there. A number of qualitative factors come into play, as the higher density makes it more cost-effective for a service provider to offer more frequent service, route options, or higher-order (rapid) transit. Encouraging higher-density density development through zoning and investing in related transit improvements makes the generalized cost of transit more competitive with private automobiles, thereby transit’s share of the modal split would
increase. Below is an example of how attributes influence traveler behaviour.
2.2.1
Changes in Modal Split as a Function of Land Use and Other Attributes
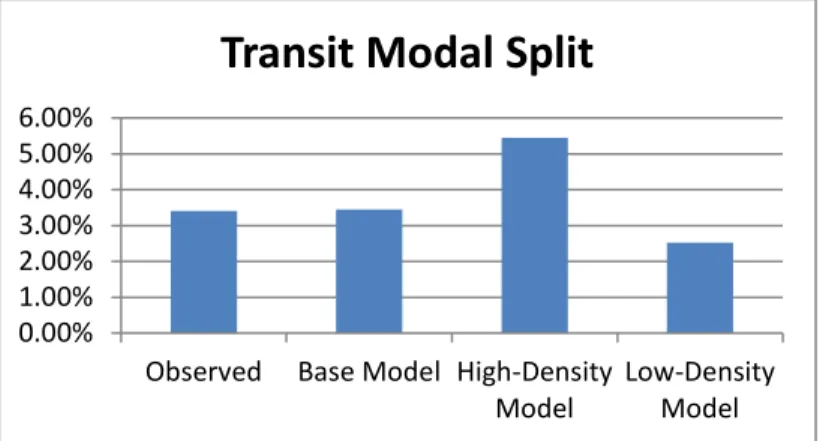
Using data from the Transportation Tomorrow Survey (TTS) data for the Region of Waterloo (Transportation Information Steering Committee, 2008), a multi-nomial logit model was calibrated to model different trip modes. For transit, calibrating the generalized cost along with the attributes of transit passes per household, student density, dwelling type and number of automobiles per household provided the strongest relationship to match the observed results. As shown in Figure 2, if the proportion of different dwelling types (single-family, medium and high density residential) is altered, and thereby population density is manipulated, the modelled mode share for transit increases or decreases in response.
Figure 2 – An example of manipulating a transit modal split model with different variable values. 0.00% 1.00% 2.00% 3.00% 4.00% 5.00% 6.00%
Observed Base Model High-Density
Model Low-DensityModel
Transit Modal Split
12
This example shows the usefulness of transportation models in testing demographic and land use scenarios to see how mode choice would be affected. Current planning trends are towards
intensification of urban areas due to hard limits being set on urban boundaries. The high density scenario could have a dramatic effect on transit demand.
This practical example of applying the utility theory belies the method’s inherent weaknesses, specifically for transit projections. The base models, prior to being calibrated to the observed values, tends to under- or over-estimate transit’s mode share in the network. Calibration only corrects the model to match the point in time of the survey. Paradoxically, transit ridership should be more popular, if based solely on the relative utility of travelling between TAZ by different modes, but other factors come into play that make travel choices more than just cost and distance based. Triggers of time sensitivity, satisfaction and anxiety of potential transit users influence transit’s ability to capture a greater mode share, particularly in suburban areas. The utility or disutility of these attributes can be converted to a cost for modelling purposes. The utility or disutility of local physical conditions, transit service level and reliability, and related infrastructure contribute to those triggers.Instead of using a single aggregate k factor in the 4-step model at the trip generation and trip attraction stage, discrete k values for each TAZ could be modelled based on the physical characteristics (i.e. infrastructure, land use, availability of transportation mode options, distance between O-D pairs), and the socio-demographic characteristics of the zone.
Utility relates to satisfaction. What has proven to be elusive for generalized cost modelling is accurately incorporating these perceptual influences, and more generally, how the overall satisfaction of the transit rider plays into making transit a more cost-competitive and desirable travel alternative. Unlocking perception as a barrier to modal choice could improve the accuracy of transportation modelling by making adjustment factors more meaningful.
2.3
Activity Based Models
Activity-Based Models improve the 4-Step Model by incorporating qualitative factors, in addition to considering trip purposes and the sequencing of individual trips into trip chains or sub-tours. An example is a parent who travels to work and, along the way, drops their children off at daycare and stops at a coffee shop. A similar trip is generated in reverse at the end of the work shift. Additional trips may be generated for evening activities. Travel surveys are used to collect the daily
transportation habits of participants, along with household attributes, land use and statistical information.
13
Vosha & Petersen (2009) note that a “new generation of activity-based models,” based on characteristics like the number of licensed drivers in the household, availability of free parking, transit pass holders and other employer-provided travel-related incentives, show a strong interdependence between these attributes. The strongest attribute relationships, as determined through regression analysis, are combined with generalized cost to calibrate a more robust utility function to feed the logit model:
𝑈𝑈𝑡𝑡𝑡𝑡𝑡𝑡𝑡𝑡𝑡𝑡𝑖𝑖𝑡𝑡 =𝑏𝑏+𝐹𝐹𝑡𝑡𝑡𝑡𝑡𝑡𝑡𝑡𝑡𝑡𝑖𝑖𝑡𝑡𝐺𝐺𝐺𝐺𝑡𝑡𝑡𝑡𝑡𝑡𝑡𝑡𝑡𝑡𝑖𝑖𝑡𝑡+𝐹𝐹1𝐴𝐴1+𝐹𝐹2𝐴𝐴2+𝐹𝐹3𝐴𝐴3… (7) Where
• AX = Attributes influencing transit mode choice
• Fx = Weighting factor for the attributes
• b = Intercept
Activity based models are generally perceived to be more behaviorally representative, because in this formulation, travelers don’t make sequential decisions for every sub-component of a tour. Once a tour begins by auto, the mode choice question is no longer evaluated. Instead, the traveler only then chooses destinations and paths. Activity based models are also thought to include better representations of household interactions than conventional, four step models.
Despite these advancements, activity based models still rely on the concept of utility in determining initial mode choice and multiple other decisions made by agents in the model. As such, the
introduction of AB models has not eliminated the need for improvements in utility representation. The next section reviews methods for experiential sampling and how these methods can be incorporated into a transit user survey to capture rider perceptions in real-time and inform future research into more accurate modelling.
2.4
Experience Sampling Method
In the past, travel mode studies often involved paper surveys along with pre- and post- activity interviews. The shortcoming of the interview process is that participants may not recall the specific details of the travel, and if there were any triggers that caused changes in their perceptions or mood along the way. Although this method of surveying has been used consistently for many years, the method is not the most reliable because of the likelihood that the participants may temper their responses or not recall certain details of their activities (Clark & Doherty, 2010).
14
Experiential sampling methods (ESM) “capture the moment” by recording the content in a person’s day-to-day activities along with the “cognitive and affective dimensions of experience” (Hektner, Schmidt, & Csikszentmihalyi, 2007). ESM can be traced to Hagerstrand’s (1970) seminal work on time geography. He stresses the importance of observing the micro-situation to create linkages to macro-scale outcomes. In regard to transportation behaviour, he observed “that the car-owner, because of his [sic] random access to transport, has a much greater freedom to combine distant bundles than the person who has to walk or travel by public transportation.” ( p .9) His reference to bundling of travel activities recognizes how individual trip-chaining contributes to mode choice and aggregate transportation demand.
ESM-based studies have always taken advantage of the latest technology of the day. The use of telephones, pagers, or alarm clocks to cue the user to complete a questionnaire or make an entry in a diary (Fan, Chen, Liao, & Douma, 2012) were considered cutting-edge in the 1970s. Now, the availability of inexpensive, unobtrusive, tracking and recording devices, such as Global Positioning System (GPS) technology and smartphones, have made ESM a practical and rapidly growing field of research. Adaptive software can also change the questions and information presented to the user based on their unique responses and activities.
2.5
Capturing Transit Rider Perceptions
Perception – the emotional responses felt by a person based on their individual experiences and surroundings – is subjective. What perceptions and characteristics of a trip on transit are relevant to measure? Perception and experience also influence whether behavioural and emotional
responses are positive or negative. A single negative experience can carry more weight as a “cost penalty” or disutility than numerous positive experiences.
2.5.1
Wait Time and Value of Time
Many factors come into play that affect the perception of wait time. The individual can feel out of control of the situation, uncertain if the bus is running on time, is late, or perhaps they just missed the bus before arriving at the bus stop. Transferring from one route to another also causes anxiety, because the complexity of the trip is compounded. The next link in the trip chain relies on the current leg of the trip performing as expected. Delay can make time seem to pass more slowly because attention to time is more acute than when things are going smoothly and focus can easily drift to other activities.
15
Several studies on the perception of wait times at bus stops have been conducted. Hess, Brown, and Shoup (2004) compared wait time perceptions of riders who took the first available bus, regardless of having to pay an extra fare, versus those who waited specifically for a free (fare pre-paid) bus even if one or two extra-fare buses passed by. Riders, who waited for a specific bus as other buses passed, overestimated their wait time by a factor of two. However, the value of wait time was influenced by whether the riders perceived that they chose to wait or were forced to wait for their desired bus to arrive. Stated versus revealed wait times were collected by immediately asking the rider how long they thought they waited once they are aboard the bus and comparing to the actual wait time obtained from vehicle location (AVL) data.
The value placed on time is a key to the GC model. Lisco’s (1967) seminal research on the value of time revealed that the commuter’s “response to trading off increasing amounts of time against a fixed background of other variables will be cumulative normal.” Different types of waiting time translate to additional cost for the traveller. A delay in service, particularly in uncomfortable surroundings, increases travel cost. A study in Paris’ subway revealed that a delay of 5.7 to 8.1 minutes in the uncomfortable environment of the underground “generated a considerable disutility for users,” resulting in an equivalent monetary increase of 29% to 42% for the trip (Haywood & Koning, 2013).
A way to mitigate the negative effects of wait time is to provide real-time transit information at the platform. Being able to monitor when the next vehicle is expected to arrive reduces anxiety and uncertainty, thereby making wait time less onerous for the traveller (Brakewood, Barbeau, & Watakins, 2014 and Gooze, Watkins, & Borning, 2013). This information also helps passengers to adapt to unreliability in transit service performance (Carrel, Halvorsen, & Walker, 2013).
Real-time information does not necessarily need to be via electronic display; data are increasingly available online or with dedicated apps. Use of smartphones provides a distraction as the
commuter’s time is occupied while waiting. Fries (2011) noted a 32% lower perception of wait time for riders who enjoy “multitasking.”
2.5.2
Transit Service Characteristics
Wait time perception is also influenced by the amenities available at the bus stop. The longer the wait, the more consideration riders give to their surroundings. Comfortable amenities can reduce the perceived length of wait. In Yoh, Iseki, Smart, & Taylor (2011), waiting riders were asked to complete a one-page survey that asked them to rate on a scale of one to four the importance of the
16
stop or station attributes. Although the results showed that quality of amenities available at the bus stop improved perception, unfortunately, many people abandoned their lengthy surveys when the bus or train arrived, resulting in many incomplete surveys.
Friman, (2004) discovered riders can hold on to their prior perceptions of inconvenience and discomfort for some time after new transit service improvements have been implemented. Alternatively, some studies have approached public transit service quality from a scheduling perspective. Lui, Bunker, & Ferreira’s, (2010) research on origin-destination route choice modeling showed that, when going to a common destination, passengers would select different routes based on their specific perceptions and familiarity of the service, crowding and convenience.
Rider behaviour and satisfaction are a subjective “combination of favourable conditions” (Verron & Martens, 1986) that may not always be evident in, or comparable between, different transit systems and cities. Satisfaction is subject to a wide range of attributes, including trip length, congestion, wait time, reliability and crowding (Fan, Chen, Liao, & Douma, 2012, among others). But, attitudes to these conditions can change over time, as other influencing factors come into play and travellers adjust their expectations (Benjamin, 1986).
Therefore, considering the user’s point of view is fundamental in evaluating transit system performance, and must include both subjective and objective measures (Eboli & Mazzulla, 2011). Studies aimed at revealing the behavioral intentions of public transit passengers and discovering the roles of service quality, perceived value, satisfaction and involvement in measuring perception have yielded mixed results. For example, researchers collected in-situ data using a survey founded on qualitative questioning with the responses related to a five point Likert scale (Lai & Chen, 2011). This method enabled a quantitative analysis of the data, leading to the production of a lengthy statistical report, but provided little qualitative insight into the personal experiences influencing the travel behaviors and perceptions.
2.5.3
Negative perception as a cost penalty
An alternative approach to measuring the effects of transit facility and service characteristics is to consider a “cost penalty” when negative perception leads to increased rider anxiety. In terms of service reliability, the cost penalty is added to transit travel time based on the likelihood of the bus being on schedule (Nour, Casello, & Hellinga, Anxiety-based formulation to estimate generalized travel time, 2010). Particularly for risk averse travelers, anxiety about reliability comes with a high perceived cost, which influences their decision to take transit, even though ridership models might
17
suggest they should be candidates to use the service based on demographics alone (Casello, Nour, & Hellinga, 2009).
The cost penalty can be applied to the generalized cost model for transportation mode choice, which will be discussed in more detail in a subsequent section. First, the challenges of observing and measuring rider satisfaction, anxiety, and the perceived value of time—the variables that could contribute to determining a cost penalty—are further explored through a review of related
research.
An anxiety cost penalty is exacerbated by the difficulty riders have in accurately planning trips on transit based on the route and schedule information available to them. The uncertainty of arrival times is a frustration, which causes riders to weigh perceived risks of miscalculating against convenience (Bick, 2011). The increasing availability of real-time transit arrival information is expected to reduce this uncertainty, and thereby, the anxiety cost penalty.
2.6
Measuring Traveller Satisfaction
A report published by Statistics Canada (Turcotte, 2010) confirms that public transit users spend more time travelling to work than people who travel by other modes, and dissatisfaction increased with commuting time. Only 10% of commuters travelling 30 to 44 minutes by transit were satisfied with their commuting time; less than half the proportion of satisfied car users. Similar negative disparities between auto and transit satisfaction, attributed to longer commute times, are widely reported in literature. But, there many factors, other than commute time, which could influence trip satisfaction. Gender, age, height, parental background, socio-economic status, and personality traits, such as willingness to take risks, are all characteristics that will influence individual experience (Dohmen, Falk, Huffman, & Sunde, 2011).
Attitudes towards quality of service, or system performance, and thereby satisfaction are
“coloured” by past experience, including those that predispose a feeling for or against, and beliefs concerning how something should behave (Forsyth & Smyth, 1986). Driving standards, schedule adherence, trip length, waiting time, appearance, cleanliness, comfort, staff attitudes and other factors are consistently cited as influences of trip satisfaction. The problem for transit users is their satisfaction is dependent upon factors that are mostly outside of their control and relies on a subjective sense of well-being (St-Louis, Manaugh, van Lierop, & El-Geneidy, 2014).
18
Satisfaction is a perception that is influenced by environmental surroundings, psychological variables and transit service characteristics (Eboli & Mazzulla, 2011; Yoh, Iseki, Smart, & Taylor, 2011), which include the following:
2.6.1
Environmental Conditions at the Bus Stop
Schedule information
Printed bus arrival timetables can be provided, such as an “infopost” on a bus stop sign pole, or a system map display frame in a transit shelter (Eboli & Mazzulla, 2011). Phone-based systems, whereby the rider calls the bus stop number and is dictated the arrival times of the next series of buses are becoming less popular with the advent of web-enabled smartphones. Schedule
information tends to be static, or at best may invoke general messages about system delays when inclement weather or scheduled construction are known to impact the scheduled times.
Real-time information display
Digital displays showing the time to arrival of the next series of buses are becoming more
commonly available at transit hubs and transfer points. These systems are connected to a central server that is monitoring bus performance in real-time via GPS or transponder. Arrival information is automatically adjusted for system delays.
Bus shelter and comfort amenities
Bus stop amenities, such as a shelter, bench, waste bin, lighting, hard-surface landing pad and staging area (other than sidewalk) provide comfort and reassurance to the waiting traveller (Yoh, Iseki, Smart, & Taylor, 2011).
Location of bus stop (i.e. on busy through arterial, land use diversity, traffic)
Suburban bus stops often lack basic amenities, and may only consist of a bus stop sign attached to a utility pole at the side of the road. Lack of amenities can increase the perception of wait time. In denser urban areas, bus stops may be located on mixed-use streets, with slower traffic, more pedestrian activity, and feel better integrated with the surroundings and provide positive distraction, instead of seeming like an anomaly.
Weather
Weather is beyond control, which is why other factors, like bus stop location and amenities, are so important. It is taken for granted that bad weather is going to influence a transit rider’s, or any traveller’s, perception of time, and often contributes to increased traffic congestion. As such, the
19
influence of weather overall is neutral, but should be taken into consideration when analysing transit rider perception to, see if weather is skewing results and normalize those observations. Distance to bus stop from origin
The physical location of the bus stop in relation to origin or destination is another influence of time perception. Although this factor can be considered more relevant to access/egress time, the actual convenience of the bus stop location does influence wait time perception. On one hand, someone with an onerous trek to a stop may find relief when actually arriving at the stop, but a long walk coupled with a bleak bus stop location and arrival time uncertainty could compound an increase in wait time perception.
2.6.2
Psychological conditions of the individual
As noted above, perceptions are subjective and can be conditioned by a traveler’s unique personalities or trip objectives. Below are many of the commonly-cited influences on travelers’ perceptions.
Time sensitivity
Going to work or an appointment is a more time-sensitive task than returning home. Having to be somewhere at a certain time sets in motion a mental planning process, working backwards from the required arrival time to determine a departure time that allows for a margin of delay en route. Time of Day
Walking in the very early morning or late at night, when there is no daylight, is less comfortable than walking during the day, when you can see and be seen. This factor is part of safety perception. Familiarity with the stop/route/system
Taking transit for the first time, or going on a new route, to a new destination, increases time awareness. This factor is a barrier to initial transit uptake with individuals – the uncertainty of trying something new. Some people embrace change, while others resist a change from entrenched behaviour and path dependency.
Vulnerability
Overall perception of safety is influenced by age, gender, psychological isolation, physical ability, and travel preparedness. Feeling less safe increases wait time perception.
Socio-demographic group
Members of certain socio-demographic groups, such as students, are considered transit “captives” because their travel options are more constricted than those of working professionals. Captives to
20
the lowest-cost alternative willingly or unwillingly give in to the disutility of additional time or inconvenience of that mode (Brown, Hess, & Shoup, 2004). The influence of socio-demographics on wait time is debatable.
Presence of others at the bus stop
The behavior of other riders encountered during a transit trip can have a positive or negative influence on time perception. If the presence of others is perceived as positive, such as for “safety in numbers,” the effect is positive. But if the other individuals are displaying erratic behaviour, such as being under the influence of drugs or alcohol, or play into one’s prejudices, wait time perception will be negatively influenced.
Availability of alternatives
The options available to the traveller, such as the availability of a vehicle in the household, are well documented in the transportation modelling literature. Time perception may increase with an accompanying perception that a more convenient mode of transportation is available (Brown, Hess, & Shoup, 2004).
2.6.3
Transit System Characteristics:
Frequency of service
The ability to simply show up at a bus stop and know that a bus will be along within an acceptable length of time significantly reduces time perception. A maximum of 10 minute headway is generally considered frequent service.
Density and convenience of service
The availability of different routes (serving different destinations) increases utility. If an area is served by only one bus route, the chances of having to transfer to reach a destination are much greater, which compounds the disutility of taking transit.
Connectivity
Likewise to density of service, the connectivity of the available bus route(s) to a variety of destinations, including long-range commuting, need to be considered.
Express and high-order service availability
Survey results have shown the greater propensity to take the express service instead of local bus routes, which is espoused by the Brown, Hess, & Shoup, (2004) study.
21 Reputation
The reputation of the transit authority may precede its perception among potential new users. Negative news articles of chronic service problems or labour disruptions can perpetuate a poor reputation.
Vehicles (cleanliness, fleet)
Survey results indicate that the cleanliness and “first impression” of the bus influences rider comfort. Comfort begins at the bus stop. If the waiting area is strewn with trash or appears run down, it is not a desirable place to be.
Likelihood of on-time performance (at bus stop, in-vehicle delay)
If a transit authority has difficulty meeting on-time performance standards, then it is seen as unreliable by its customers and confidence of new riders is diminished.
Distribution of jobs and households (and thereby typical distance and travel time)
Different communities each have unique characteristics, so model parameters are not necessarily transferable from one community to another. The distribution of housing and jobs, and thereby the distribution of trips, influences the effectiveness of the transit and transportation network. An inefficient transit system, due to its inability to serve a dispersed market, is likely to have longer wait times and lower new rider uptake.
Consideration of these transit system characteristics are increasingly important to improving the accuracy of transportation models within the community of practice, as noted in (Transportation Research Board, 2007). The factors described in this section, and their positive or negative influence on traveller satisfaction, are summarized in Table 2.
Large scale transportation surveys, like the Transportation Tomorrow Survey, and census
information, can fill some of this data gap effectively on a regional or macro level. An ESM technique to capture individual perceptions of transit system characteristics and behaviour is discussed next.
22
Table 2 - Influences on Satisfaction
Influences on Satisfaction Summary Table
Attribute Characteristic Influence on
Satisfaction Environmental Conditions at the Bus Stop
Schedule information Map or timetable available at bus stop +
Next bus arrival time is displayed in real time ++
No information available at bus stop - No information and low service frequency -- Bus shelter and comfort
amenities Shelter, bench or other comfort amenities Only a sign on a post marks the stop + -
Physical location of bus stop Busy location, more activities, greater perception of
safety +
Remote location, lower perception of safety -
Weather Varies + / -
Distance to bus stop Short distance, highly convenient +
Long distance, less convenient -
Psychological conditions of the individual
Time sensitivity High sensitivity to time constraints; satisfaction
influenced by schedule adherence + / -
Low sensitivity to time constraints/scheduling n/a
Time of Day Varies + / -
Familiarity with the
stop/route/system High familiarity - routine user Low familiarity - less frequent user + -
Vulnerability High perception of safety +
Low perception of safety -
Socio-demographic group Varies + / -
Presence of others Varies + / -
Availability of alternatives Transit is perceived as best transport choice + A more convenient alternative is available - Transit System Characteristics
Frequency of service Frequent service ++
Infrequent service --
Density and convenience of
service & Connectivity Multiple choices are available Single choice + - Express and high-order service
availability Express or rapid transit service available Local bus service only + -
Reputation Varies + / -
Vehicles (cleanliness, fleet) Well maintained, reliable, clean buses +
Older, poorly maintained fleet -
Likelihood of on-time
performance High reliability Low reliability + -
Distribution of jobs and
households High density, mixed used development that encourages transit use + Low density, auto-centric development -
23
2.7
Measuring transit experience in real-time
ESM data related to personal travel activities can be correlated to actual locations using GPS. GPS also provides trip start and end times, origin and destination, duration of wait times at bus stops, and actual travel time on the bus. The rider’s perceived wait and travel time can be compared to the actual durations. By combining both qualitative and quantitative information collection in real-time, a very detailed picture of transit rider perceptions and an evaluation of system and service quality can be obtained. Data quality is also improved by the capability of correlating survey responses to an actual place and time.
Anyone with a smartphone has a device capable of collecting GPS and survey data. There is little concern about hindering participants by having them wear special devices to record their travel experience, as was the case in the early days of ESM study. Participants can use a device with which they are already familiar, and does not draw undue attention to them as they go about their
activities. Overcoming the challenges of devising a survey that captures relevant qualitative and quantitative data during a transit trip, and does not interfere or influence the normal perceptions of participants, is explored in the next section. The Transit Oriented Experience Survey (TOES), discussed in the next chapter, was an experiment devised with these criteria in mind, and in consideration of other similar travel activity based studies.
2.7.1
Concurrent Research
Concurrent research using smartphones to gather rider experience can be found in the work of Carrel, Mishalani, Sengupta, & Walker (2016). The goal of their research is to understand the drivers of customer satisfaction through objective (travel time) and subjective (emotional response) ratings based in a 5-point Likert scale. Their results show passenger sensitivity to in-vehicle delay is greater than out-of-in-vehicle delay and the impact on customer satisfaction can be predicted with an ordinal logit model based on the length of delay.
Nour (2015) developed a data-driven classification model using GPS equipped smartphones to infer transportation mode(s). Through analysis of data from phone’s GPS and accelerometer, the mode of travel (i.e. walking, automobile, bicycle, or transit) can be determined with approximately 86% accuracy. The main goal of this research is to automate the identification of the different stages of transit trips. Such a system could enhance the use of smartphones as an ESM by reducing the amount of user-interaction required with the device.
24
3
Previous Work: Transit Oriented Experience Survey
Work on two of the research objectives for this thesis, using a smartphone app to track a group of transit users and identify triggers of dissatisfaction and anxiety, began in 2012 with the adaptation of a previously developed smartphone ESM application.
A smartphone app called XSam (short for Experience Sampler) was used in 2011 for the research of Doherty, Lemieux, & Canally (2014). The code for that app was adapted by the author to create the Transit Oriented Experience Survey (TOES) in 2012. TOES was field tested with 60 undergraduate students in 2012-2013. Participants were asked to rate their transit travel experience, before, during and after the trip, based on 10 different comfort and wellbeing indicators.
With smartphones being easy to use, portable and fairly non-intrusive, transit riders can record their thoughts and emotions in real time as they experience their public transit trip. The TOES project began as a pilot study to test this style of data collection and observe the results, not only to compare with previous survey techniques, but also to validate this method of data collection. TOES tracks changes in transit rider perceptions and their emotional state before, during and after a transit trip with the goal of collecting useful qualitative and quantitative data.
TOES demonstrated that a smartphone survey application can, more effectively than traditional survey techniques, capture transit rider perceptions, emotional wellbeing and comfort in real-time during different stages of the trip on public transit:
• Before arriving at the bus stop; • Waiting at the bus stop;
• Travelling on the bus and; • After departing the bus.
3.1
Overview and intent
Sixty undergraduate students from the University of Waterloo and Wilfrid Laurier University were recruited as participants for the TOES Survey. The rationale behind using students for the initial survey, aside from convenience, is that students pay for transit through their tuition fees. Therefore the transit fare is uniformly not a significant factor influencing their perceptions.
Each participating student first completed a brief pre-screening questionnaire and received some basic instructions about how the TOES app works. The questionnaire gathered the student’s
25
gender, age, and their overall familiarity with using transit (i.e. frequently, infrequently or never use local transit). Each participant was then provided a smartphone preloaded with the app. The app prompts participants to complete a series of questions about their perceptions before, during and after their transit ride. The smartphone enables GPS and time tracking capabilities that were synchronized with the survey to provide the time and place the survey was completed. The data are collected and stored on the smartphone, and downloaded for processing and analysis after the subject returns the device.
3.2
Developing the TOES Smartphone App
The app was developed for the BlackBerry 7.0 platform using the Java programming language, the manufacturer’s software development kit (SDK) and the Eclipse development environment. To collect GPS data in synchronization with the TOES app, a separate application called GATE, previously developed for Clark & Doherty (2010), was also installed on the devices. Using the companion software for GPS simplified the survey app programming, although the solution was less reliable than using a fully integrated tracking capability.
3.2.1
How TOES Works
Participants initiate the TOES survey before they are ready to begin their trip on transit. The participant can subsequently initiate the survey iterations manually, or the software will prompt them to complete the next iteration every 6 minutes during their trip. A programming challenge was to prevent the smartphone from terminating the app when the phone goes to sleep. A
“persistence” module runs in the background to keep the app alive and wake-up the phone with a vibration and alarm to prompt the participant to complete the next phase of the survey.
The app also contains two sets of five perceptual queries regarding participants’ surroundings and feelings of wellbeing. To keep the interface clean and readable, the 10 perceptual responses are split on two screens. Slider bars allow the participant to rate their responses to each question. Each slider records a value between 0 (extreme left-side, negative response) and 8 (extreme right-side response), with 4 being neutral (the middle, default position). In post-processing, the neutral value becomes 0, and the positive or negative emotional responses are +/- 4. At either end of the slider scale are two contrasting adjectives (Figure 3).