I N F O R M A T I O N S C I E N C E 2016 © The Authors, some rights reserved; exclusive licensee American Association for the Advancement of Science. Distributed under a Creative Commons Attribution NonCommercial License 4.0 (CC BY-NC). 10.1126/sciadv.1501158
The dynamics of information-driven coordination
phenomena: A transfer entropy analysis
Javier Borge-Holthoefer,1*†Nicola Perra,2* Bruno Gonçalves,3‡Sandra González-Bailón,4Alex Arenas,5*
Yamir Moreno,6,7,8* Alessandro Vespignani2,8,9*
Data from social media provide unprecedented opportunities to investigate the processes that govern the dynamics of collective social phenomena. We consider an information theoretical approach to define and mea-sure the temporal and structural signatures typical of collective social events as they arise and gain promi-nence. We use the symbolic transfer entropy analysis of microblogging time series to extract directed networks of influence among geolocalized subunits in social systems. This methodology captures the emer-gence of system-level dynamics close to the onset of socially relevant collective phenomena. The framework is validated against a detailed empirical analysis of five case studies. In particular, we identify a change in the characteristic time scale of the information transfer that flags the onset of information-driven collective phenomena. Furthermore, our approach identifies an order-disorder transition in the directed network of in-fluence between social subunits. In the absence of clear exogenous driving, social collective phenomena can be represented as endogenously driven structural transitions of the information transfer network. This study pro-vides results that can help define models and predictive algorithms for the analysis of societal events based on open source data.
INTRODUCTION
A vivid scientific and popular media debate has recently centered on the role that social networking tools play in coordinating collective phenomena; examples include street protests, civil unrests, consen-sus formation, and the emergence of electoral preferences. A flurry of studies have analyzed the correlation of search engine queries, micro-blogging posts, and other open data sources with the incidence of infectious disease (1–4), box office returns (5), stock market behavior (6,7), election outcomes (8,9), popular votes results (10), crowd sizes (11), and social unrest (12,13). However, many other studies have also pointed out the challenges that big data present and the likely methodological pitfalls that might result from their analysis (14–19). Previous work suggests that more research is needed to develop methods for exploiting the value of social media data while overcoming their limitations.
Here, we use microblogging data to extract networks of causal in-fluence among different geographical subunits before, during, and after collective social phenomena. To ground our work on empirical data, we analyze five data sets that track Twitter communication
around five well-known social events: the release of a Hollywood block-buster movie, two massive political protests, the discovery of the Higgs boson, and the acquisition of Motorola by Google. We selected these case studies because they represent different points in a theoretical continuum that separates two types of collective phenomena: those that can be represented as an endogenously driven exchange of information and those that respond more clearly to factors that are exogenous to the system. In our context, these phenomena refer to the dynamics of information exchange through social media. In some cases, discussions evolve organically, building up momentum up to the point where the exchange of information is generalized; however, in some other cases, the discussions emerge suddenly as a reaction to some unexpected ex-ternal event (20). The Motorola-Google case study corresponds to the exogenous type, providing a counterexample and intuitive baseline test for the other cases.
For each case study, we adopt the transfer entropy approach to define an effective social connectivity at the macroscale and study the coordinated activation of localized populations. We address two foun-dational problems: first, the identification of the characteristic time scale of social events as they develop, gather force, and burst into the public eye. In effect, the determination of the pertinent time scale is one of the fundamental limitations of the analysis of data from social media, namely, to be considered for the posterior processing of information. Symbolic transfer entropy (STE) captures the intrinsic time scale of the information flow and allows a proper diagnosis of the granularity needed to grasp the evolution of social events. Second, we look into the characterization of the structural signature typical of the communication dynamics that underlie social phenomena. We find that the onset of collective phenomena is characterized by the drop of the characteristic time scale; we also show that the emergence of coherent patterns of information flow can be mapped into order-disorder transitions in the underlying connectivity patterns of the transfer entropy network. The methodology we present here can 1Qatar Computing Research Institute, Hamad Bin Khalifa University, P.O. Box 5825 Doha,
Qatar.2Laboratory for the Modeling of Biological and Socio-Technical Systems, Northeast-ern University, Boston, MA 02115, USA.3Aix-Marseille Université, Université de Toulon, CNRS, CPT, UMR 7332, 13288 Marseille, France.4Annenberg School for Communication, University of Pennsylvania, Philadelphia, PA 19104, USA.5Departament d’Enginyeria In-formàtica i Matemàtiques, Universitat Rovira i Virgili, 43007 Tarragona, Spain.6
Depart-ment of Theoretical Physics, Faculty of Sciences, University of Zaragoza, 50009 Zaragoza, Spain.7Institute for Biocomputation and Physics of Complex Systems (BIFI), University of Zaragoza, 50018 Zaragoza, Spain.8Institute for Scientific Interchange, 10126 Torino, Italy.9Institute for Quantitative Social Sciences at Harvard University, Cam-bridge, MA 02138, USA.
*Corresponding author. E-mail: [email protected] (J.B.-H.); nicolaperra@ gmail.com (N.P.); [email protected] (A.A.); [email protected] (Y.M.); [email protected] (A.V.)
†Present address: Internet Interdisciplinary Institute, Universitat Oberta de Catalunya, 08018 Barcelona, Catalonia, Spain.
‡Present address: Center for Data Science, New York University, New York, NY 10003, USA.
on May 18, 2018
http://advances.sciencemag.org/
therefore be used to gain new insights on the structural and functional relations occurring in large-scale structured populations, eventually leading to the identification of metrics that might be used for the def-inition of precursors of large-scale social events.
RESULTS
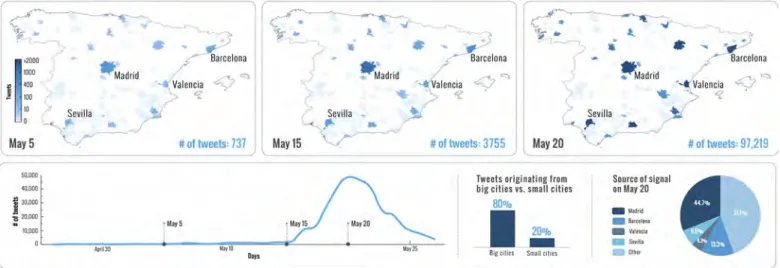
Our data sets consist of time-stamped and geolocalized time series of tweets associated to the following events: the Spanish 15M social unrest in 2011, the Outono Brasileiro (“Brazilian Autumn”) in 2013, the discovery of the Higgs boson in 2012, the release of a Hollywood blockbuster in 2012, and the acquisition of Motorola by Google in 2011. The spatiotemporal annotation of each tweet in the time series allows the construction of spatially localized activity maps that help identify, as time unfolds, the role that different geographical subunits played in the global exchange of information. For each data set, the definition of the corresponding spatial unit is performed according to administrative and geographical boundaries as specified in Materials and Methods (see Fig. 1 as well). Note that the map only shows how the signal increases in all regions and does not provide evidence of any unexpected transition, pointing out that volume alone is not a good indicator of the evolution of the events.
The time-stamped series of tweets that originated from each spatial subunitX(supra-urban aggregates) defines the activity time seriesXtof
the corresponding subunit in the social system. Time stamps are mod-ified for each data set to account for different time zones (see the Sup-plementary Materials for details). Activity time series encode the role of each geographical subunit, a sort of“who steers whom,”and several techniques can be used to detect directed exchange of information across the social system. Here, we characterize the dominating direction of information flow between spatial subunits using STE (21,22). This well-established technique has been used to infer directional influence between dynamical systems (23–25) and to analyze patterns of brain connectivity (26).
STE quantifies the directional flow of information between two time series,XandY, by first categorizing the signals in a small set of
symbols or alphabet (see section B.3 in the Supplementary Materials), and then computing the joint and conditional probabilities of the sequence indices from the relative frequency of symbols in each se-quence,X^ andŶ, as TY;X¼∑p ^xiþd;^xi;^yilog2 pð^xiþdj^xi;^yiÞ pð^xiþdj^xiÞ ð1Þ where the sum runs over each symbol in the sequence andd= 1. The transfer entropy refers to the deviations of the cross-Markovian property of the series (independence between them), measured as the Kullback-Leibler divergence (27) (see the Supplementary Materials for all technical details). An important feature of symbolic approaches is that they discount the relative magnitude of each time series; this is im-portant in our case because different geographical units differ largely in population density or Internet penetration rates. Flattening and discre-tizing the original signal are a key feature to enhancing the sensitivity of our proposal to any changes (even minor ones) in the interaction dynam-ics between subsystems (see section F in the Supplementary Materials).
Within this framework, we first analyze the temporal patterns characterizing the flow of information. Admittedly, microblogging data can be sampled at different time scales,Dt. To select the optimal sampling rate, we consider all possible pairs (X,Y) of geographical units and measure the total STE in the systemT=∑XYTX,Yas a
function ofDt. We consider the system-wide characteristic sampling time scaletas that which maximizes the total information flowT. This quantity provides an indication of the time scale at which the information is being exchanged in the system, which is not necessar-ily correlated with volume; see the early stages of (A) to (D) in Fig. 2 where the time scale drops by ~50% in a very scarce volume scenario (see section F in the Supplementary Materials as well). The charac-teristic time scaletchanges as the phenomena under analysis unfold; that is, it decreases as the system approaches the exponential increase in overall activity that signals the onset of the collective event. As shown in the top panels of Fig. 2,tis a proxy for the internally generated co-ordination in the system that culminates simultaneously with the time
Fig. 1. Spatiotemporal activity as observed from the microblogging platform Twitter.Spain’s 15M protest growth in time shows that the protest did not transcend the online sphere until May 15 when the political movement emerged on the streets. Broadcasting traditional media started reporting about it soon after; by that time, demonstrations had been held in the most important cities of the country.
on May 18, 2018
http://advances.sciencemag.org/
of the occurrence of the social event: the street protest day in the case of political unrest, the movie release date in the case of the Hollywood block-buster, and the announcement to the press of the Higgs boson discovery. The only clear exception to this behavior is offered by the company acqui-sition data set: the Google-Motorola announcement is a clear example of collective phenomena driven mostly by an exogenous factor, that is, a media announcement. In this case, the dynamical time scale is constant until the announcement is made public. In the Supplementary Materials, we present the same analysis for the randomized signals, showing that time scale variations are then washed out from the signal, as expected. The maximized information exchange can be analyzed at the level of geographical subunits by constructing the effective directed network (28) of information flow on a daily basis. This network is encoded in the matrix {TXY}, which contains pairwise information about how each component
in the system controls (or is controlled by) the others. The matrix {TXY} is asymmetric. The directionality is crucial and denotes that the geographic areaxcan exert some driving on areayand, at the same time,ymight exert some driving onx. For this reason, it is convenient to define the directionality indexTXS;Y¼TY;XTX;Y, which measures the balance of information flow in both directions. This index quantifies the dominant direction of information flow and is expected to have positive values for unidirectional couplings withxas the driver and negative values ifyis driv-ingx. For symmetric bidirectional couplings, we expectTXS;Yto be null.
We show in Fig. 3 the temporal evolution of the maximized
∑YTXS;Y that provides the information flow balance of each specific
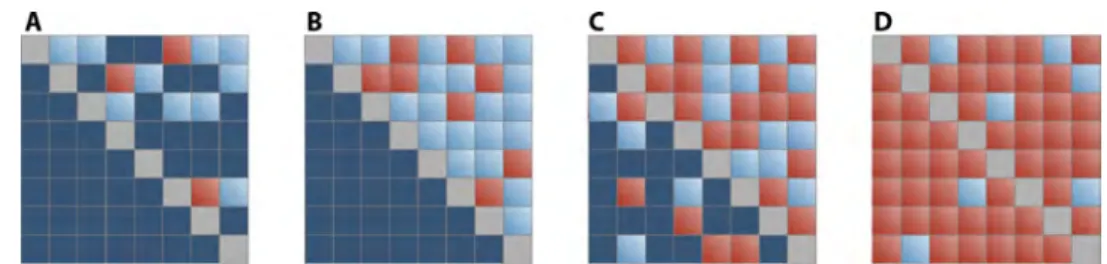
geographical area. The results show that in the 15M grassroots pro-tests, a limited number of urban areas initially drive the onset of the social phenomenon. These units correspond mostly to major cities; however, the analysis also uncovers hidden drivers, such as Orotava, a less known urban area. Only after the first demonstration day on May 15 does the driving role become much more homogeneously distributed. In the Brazilian case, a set of clear drivers is present only during the onset phase preceding a demonstration on June 6 and becomes fuzzier up until the major demonstration (June 17) and to-tally blurred afterward. We find a similar behavior in the Higgs boson cases (with rumors around the discovery on July 2 and the final an-nouncement on July 4) (29). The blockbuster case is driven by a steady excitement of the public before the movie release. Again, as expected, we observe completely different patterns in the case of the Google data set. In general, the evolving effective networks reveal a transition from hierarchical causal relationships to symmetric (if rather fluctuating) networks where information is flowing symmetrically among all units. If information flows mainly in one direction (that is, if the sub-systems are arranged in a highly hierarchical structure), a subunit dominates another, with no or little information flowing in the op-posite direction. In this situation, a convenient manipulation of the matrix (T→T†) based on the ranking and reordering of the elements according to their directionality index yields an upper triangular matrix (see Materials and Methods). The transition from such hier-archical or centralized driving to a symmetric scenario can be clearly identified by monitoring the ratioq¼Tl†=Tu†between the sum of all elements ofT†in the lower triangle and the same quantity evaluated in the upper triangle. As schematically illustrated in Fig. 4, in a re-gime of perfectly directed driving, all the elements below the diagonal are zeros; that is,q≈0. In the opposite situation (that is, in the per-fectly symmetric regime), the values below and above the diagonal are comparable; that is,q≈1. Hence, the quantityqcan be considered a suitable order parameter to characterize this order-disorder transition Fig. 2. Characteristic time scalet.(AtoE) The panels report the variation
of the characteristic time scale (blue) that maximizes the STE flow as the so-cial event is approached. Red lines correspond to activity volume (number of tweets). Light red vertical lines correspond to the onset of the main social event. Gray vertical lines (B and C) indicate a smaller precursor event. (A) The 15M event shows a progressive decline of the characteristic time scale well before the actual social event; the same is observed for the Outono Bra-sileiro in (B) (note a data blackout between days 10 and 11). The patterns for the Higgs boson discovery data set in (C) and the Hollywood blockbuster data (D) also reveal a drop in the characteristic time scale, although this is smoother in the movie case. Overall, in (A) to (D) (endogenous activity), the time scale has already dropped to 50% by the time the absolute volume signals a system-wide event. Finally, the Google-Motorola deal triggers a high volume of microblogging activity without actual change in the time scale of the information flow (E). In this case, the decline is observed in the aftermath of the announcement. As discussed in the main text, this event is the only one that is clearly elicited by an exogenous trigger.
on May 18, 2018
http://advances.sciencemag.org/
and thus helps in the identification and differentiation of communica-tion patterns across the subunits of a system.
We show in Fig. 5 the behavior of the parameterqas a function of time in our five data sets. In all of the cases, we initially observe a highly asymmetric effective network, where a few subunits have a dominant directional coupling to the rest of the system andq≪1. As the systems approach the onset date of the collective event, the quantityTl†=Tu† under-goes a quick transition toq≈1, identifying a regime in which the couplings indicate the existence of collective phenomena where all subunits mu-tually affect each other. We see that in four of the five data sets, the system has a clear order-disorder transition occurring in the proximity of the col-lective event. In the case of the Brazilian protests, the measure significantly
increases before the main event (June 17). Such behavior probably results from the effects of small precursor protests taking place from June 6 onward. The same behavior is observed in the Higgs boson data set, given that rumors started circulating after July 2. Once more, the Google data set behaves in a completely different way, never showing a clear signature of a collective regime for the couplings network. In the Supplementary Materials, we report the same analysis using the rando-mized signal for both the 15M and Brazil events, and we observe no order-disorder transition. Similarly, no transition exists for the Twitter unfiltered stream case study (also in the Supplementary Materials).
All data sets cover a time span preceding and following the event, and details on data collection, spatial aggregation (including keyword Fig. 3. Evolution of information flow balance between geographical locations for the analyzed events.(AtoE) The color goes from dark blue to dark red (white corresponds to null driving), with the former standing for negative values of∑yTXS;Y(that is, driven locations) and the latter
correspond-ing to positive information flow balances (that is, drivers). The size of the circles is log-proportional to the number of messages sent from the location at that time, and the vertical bars mark the day of the main event. The geographical locations are ordered according to population size, except for (C), in which countries are ranked with the amount of Higgs-related tweets produced.
on May 18, 2018
http://advances.sciencemag.org/
selection and the geolocalization of messages), and sensitivity analysis of the methodology can be found in Materials and Methods and in the Supplementary Materials.
DISCUSSION
The mapping of influence networks using an information theoretical approach offers a new lens to analyze the emergence of collective phe-nomena. Through this lens, we have revealed the existence of a double
transition—in the time scales (slow to fast) and directional couplings (hierarchical to distributed)—in systems that gather around some sort of collective action. Regarding the first, we bring to light that time series analysis should pay attention to the time scales of the under-lying dynamical processes if it is to provide a reliable account of those dynamics—a fact that resonates beyond societal analysis. We also un-cover the effective network of information flow between spatially defined subunits of the social system and study the structural changes of the network connectivity pattern as the system goes through different collective states. In addition, the effective network lends itself to further Fig. 4. Schematic representation of a transition from a centralized to a decentralized information flow scenario.If, for any given pair (x,y),TS
x;y ∼Tx;y,
all existent dynamical driving is net driving; that is, subsystems present a highly hierarchical structure. In this scenario, if a subsystem dominates another one, the former is not dominated by the latter. This is well illustrated in (A) and (B). Note, however, that only a few subsystems play an active (dynamical) role in (A), whereas the situation has reached a perfectly hierarchical structure in (B). Indeed, in this idealized situation, the net transfer entropy reaches its maximum: any further addition in terms of dynamical driving will decrease the amount of net transfer entropy [as in (C)]. Furthermore, (B) and (C) illustrate that there exists a tipping point beyond which the event has necessarily gone global. The extreme case where every subsystem exerts some amount of dynamical driving results in a“null driving”scenario [as in (D)]. In this schematic representation, the color scales go from dark blue to red, that is, zero to maximum transfer entropy, respectively.
Fig. 5. Order parameterqas a function of time for the five events analyzed.The figure represents the behavior of the ratioq¼Tl†=Tu†characterizing the order/disorder of the effective connectivity matrix as a function of time (note a point missing in the Brazilian data set because of a data blackout between days 10 and 11). For each data set, two or three matricesT†are plotted, considering one or two times before and one after the main event (signaled with a red vertical bar). A clear transition from a hierarchical directed to a distributed symmetrical scenario is observed for events (A), (B), (C), and (D). The Google data set, depicted in (E), behaves differently by not showing the same evidence of transition effects.
on May 18, 2018
http://advances.sciencemag.org/
analysis that can lead to the identification of structural hubs, coor-dinated communities, influence pathways of geographical or cultural characteristics, and geographical subunits that may have recurrent roles in the onset of social phenomena. The methodology we present here can therefore be used to gain new insights on the structural and functional relations occurring in large-scale structured populations, eventually leading to the identification of metrics that might be used for the defi-nition of precursors of large-scale social events.
Additionally, the methodology presented here opens interesting paths to advance in the analysis of social phenomena and the iden-tification of generative mechanisms; however, this advance should not be conflated with the possibility of forecasting the emergence of social events, but as a natural complement of techniques along this line, such as network change-point detection (30). The evidence we discuss is agnostic with regard to the predictive potential of online net-works and microblogging platforms. A real predictive approach cannot be disentangled from an automatic selection of the relevant discussion topics. Our analyses use data sets that were already zooming into the right conversation domain and monitoring specific keywords/hashtags in the Twitter stream. However, we believe that the general methodo-logical framework we put forward is a first step toward a better understanding of the temporal and spatial signatures of large-scale social events. This advancement might eventually inform the develop-ment of tools that can help us anticipate the emergence of macroscopic phenomena. In the meantime, our method offers a valuable resource to analyze how information-driven transitions unfold in socially relevant contexts.
MATERIALS AND METHODS
Data
The first data set focuses on the Spanish 15M movement, which emerged in 2011 (31,32). The data cover a dormant period of low mi-croblogging activity that is followed by an explosive phase in which the movement gained the attention of the general public and was widely covered by traditional media sources (see Fig. 1). The second data set contains more than 2.5 million geolocalized tweets associated to the Outono Brasileiro, a set of political protests that emerged in Brazil in June 2013. Similar to the Spanish case, the Brazilian data include an ini-tial phase of low activity followed by a gradual escalation toward the high volumes of general attention that accompanied the street pro-tests. The third data set tracks communication on the discovery of the Higgs boson before and after it was officially announced to the press in July 2012; this data set has been used before to assess how rumors spread through online social networks (29). The fourth data set contains messages related to the release of a Hollywood blockbuster, announced months before its premiere to stir momentum among the fan base. Finally, we also consider a data set that tracks communication on the acquisition of Motorola by Google, which came as sudden and unexpected news and immediately triggered a high volume of public attention.
Spanish Twitter activity is spatially coarse-grained according to the list of metropolitan areas defined by the European Spatial Planning Observation Network (33). This process yields 56 aggregated time series, each of which corresponds to a different geographical area. In ad-dition, there is an extra signal that accounts for any activity not included in those areas; that is, the system is made up ofn =57 components. The data
from Brazil are aggregated in 97 basins, which correspond roughly to met-ropolitan areas (34,35). The data that track rumors about the Higgs boson are aggregated at the country level, including only then =61 most active basins around this topic. Finally, the Motorola-Google and the blockbuster data are classified in 52 U.S. areas: 50 states plus Washington, DC, and Puerto Rico.
Order-disorder transition
In real data sets, the transition between centralized and decentralized information-transfer scenarios can be visually inspected with a con-venient sorting of the rows and columns of theTx,ymatrix. We did so
in Fig. 5, ranking each subunit of the system. The rank for a subunitxis assigned according to the number of timesxis dominant over the rest of the subunits. Once the ranking is settled, anyTx;y<12Txmax;y is set to 0 to improve the visual understanding of the figure. We then obtained a transformed matrix, that is,Tx;y→Tx†;y. Beyond visualization, the sorted matrix allows us to define a monitoring measure q¼∑x>yT
† x;y ∑x<yTx†;y¼ T† l T† u
(that is, the ratio between the sums of all the matrix’s elements in the lower and upper triangles), which provides a quantification of the state of the system (as explained in the main text and illustrated in Fig. 4). For completion, we have also plotted the same figures without threshold (see section B.6 in the Supplementary Materials).
SUPPLEMENTARY MATERIALS
Supplementary material for this article is available at http://advances.sciencemag.org/cgi/ content/full/2/4/e1501158/DC1
Data, context, and chronology of the events analyzed Methods used in the analysis
Sensibility analysis of the parametrization Validation of results (I): Time series randomization Validation of results (II): Unfiltered Twitter stream Validation of results (III): Synthetic time series generation
Table S1. List of keywords used to find tweets related to the Outono Brasileiro.
Fig. S1. Schematic representation of the algorithm used to gather geographical coordinates of the Hollywood movie release and the Google-Motorola acquisition data sets.
Fig. S2. Sample order pattern form =3.
Fig. S3. Schematic view of the sliding window scheme.
Fig. S4. Evolution of the order parameterqfor thresholded (green) and raw (red)T†matrices. Fig. S5. Dependence oftwith the sliding window sizew, considering the Spanish 15M protest. Fig. S6. Normalized directionality index for each geographical unit in the 15M data set for differentw.
Fig. S7. Fraction of false nearest neighbors as a function ofmfor the Spanish data set and the Madrid time series.
Fig. S8. Normalized directionality index for each geographical unit in the 15M data set for differentm. Fig. S9. Characteristic time scaletfor four data sets at alternative geographical aggregation levels. Fig. S10. Normalized directionality index for four data sets at alternative geographical aggregation levels.
Fig. S11. Behavior ofqas a function of time for four data sets at alternative geographical aggregation levels.
Fig. S12. Average total amount of STE for someDt(top panel) and time scale profilet(bottom panel) for 15M data set amplitude adjusted Fourier transform surrogates (50 randomizations). Fig. S13. Behavior ofqas a function of time for 15M and Outono Brasileiro data sets randomized surrogates.
Fig. S14. Average total amount of STE for someDt(top panel) and time scale profilet(bottom panel) for 15M data set constrained surrogates (20 randomizations).
Fig. S15. Evolution oftas a function of time.
Fig. S16. ThresholdedT†matrices corresponding to different moments in the Twitter unfiltered data set.
Fig. S17. Raw time series for Twitter unfiltered stream forDt= 600 s andDt= 45 s (left and right, respectively).
on May 18, 2018
http://advances.sciencemag.org/
Fig. S18. Evolution of two nonlinear systems under four changing scenarios: from dynamic independence (b= 0) to strong asymmetric coupling (b= 20.0).
Part 1. Minimalist example: Disentangling volume and time scales (Dt). Part 2. Nonlinear Lorentz oscillators: Time scales, volume, and dynamical coupling. References (36–58)
REFERENCES AND NOTES
1. A. Culotta,Towards Detecting Influenza Epidemics by Analyzing Twitter Messages(ACM, New York, 2010), pp. 115–122.
2. J. Ginsberg, M. H. Mohebbi, R. S. Patel, L. Brammer, M. S. Smolinski, L. Brilliant, Detecting influenza epidemics using search engine query data.Nature457, 1012–1014 (2009). 3. K. S. Hickmann, G. Fairchild, R. Priedhorsky, N. Generous, J. M. Hyman, A. Deshpande,
S. Y. Del Valle, Forecasting the 2013–2014 influenza season using Wikipedia.PLOS Comput.
Biol.11, e1004239 (2015).
4. P. Chakraborty, P. Khadivi, B. Lewis, A. Mahendiran, J. Chen, P. Butler, E. O. Nsoesie, S. R. Mekaru, J. S. Brownstein, M. Marathe, N. Ramakrishnan, Forecasting a moving target: Ensemble models for ILI case count predictions,Proceedings of the 2014 SIAM International Conference on Data
Mining(Society for Industrial and Applied Mathematics, 2014), pp. 262–270.
5. S. Asur, B. A. Huberman,Predicting the Future with Social Media, WI-IAT’10(IEEE Computer Society, Washington, DC, 2010), pp. 492–499.
6. J. Bollen, H. Mao, X. Zeng, Twitter mood predicts the stock market.J. Comput. Sci.2, 1–8 (2011). 7. C. Curme, T. Preis, H. E. Stanley, H. S. Moat, Quantifying the semantics of search behavior
before stock market moves.Proc. Natl. Acad. Sci. U.S.A.111, 11600–11605 (2014). 8. A. Tumasjan, T. O. Sprenger, P. G. Sandner, I. M. Welpe, Predicting elections with twitter:
What 140 characters reveal about political sentiment.ICWSM10, 178–185 (2010). 9. A. Livne, M. P. Simmons, E. Adar, L. A. Adamic, The party is over here: Structure and content
in the 2010 election,Proceedings of the Fifth International Conference on Weblogs and Social Media, Barcelona, Spain, 17 to 21 July 2011 (ICWSM).
10. F. Ciulla, D. Mocanu, A. Baronchelli, B. Gonçalves, N. Perra, A. Vespignani, Beating the news using social media: The case study of American idol.EPJ Data Sci.1, 1–11 (2012). 11. F. Botta, H. S. Moat, T. Preis, Quantifying crowd size with mobile phone andTwitterdata.R. Soc.
Open Sci.2, 150162 (2015).
12. J. Xu, T. C. Lu, R. Compton, D. Allen, inSocial Computing, Behavioral-Cultural Modeling and Prediction, Lecture Notes in Computer Science, W. Kennedy, N. Agarwal, S. Yang, Eds. (Springer International Publishing, Cham, Switzerland, 2014) vol. 8393, pp. 403–411. 13. N. Ramakrishnan, P. Butler, S. Muthiah, N. Self, R. Khandpur, P. Saraf, W. Wang, J. Cadena,
A. Vullikanti, G. Korkmaz, C. Kuhlman, A. Marathe, L. Zhao, T. Hua, F. Chen, C.-T. Lu, B. Huang, A. Srinivasan, K. Trinh, L. Getoor, G. Katz, A. Doyle, C. Ackermann, I. Zavorin, J. Ford, K. Summers, Y. Fayed, J. Arredondo, D. Gupta, D. Mares,‘Beating the News’with EMBERS: Forecasting Civil Unrest Using Open Source Indicators, KDD’14 (ACM, New York, 2014), pp. 1799–1808. 14. M. Skoric, N. Poor, P. Achananuparp, E. P. Lim, J. Jiang, Tweets and votes: A study of the
2011 Singapore General Election,IEEE in 2012 45th Hawaii International Conference on System
Sciences(2012), pp. 2583–2591.
15. E. T. K. Sang, J. Bos, Predicting the 2011 Dutch senate election results with Twitter,Proceedings of SASN 2012, the EACL Workshop on Semantic Analysis in Social Networks (ACL), Avignon, France, 2012.
16. D. Gayo-Avello,“I wanted to predict elections with twitter and all I got was this lousy paper”—A balanced survey on election prediction using Twitter data. arXiv:1204.6441 (2012). 17. Z. Tufekci, Big questions for social media big data: Representativeness, validity and other
methodological pitfalls. arXiv:1403.7400 (2012).
18. D. M. Lazer, R. Kennedy, G. King, A. Vespignani, Big data. The parable of Google Flu: Traps in big data analysis.Science343, 1203–1205 (2014).
19. D. Helbing, Globally networked risks and how to respond.Nature497, 51–59 (2013) 20. J. Lehmann, B. Goncalves, J. J. Ramasco, C. Cattuto, Dynamical classes of collective attention in
twitter,Proceedings of the 21st International Conference on World Wide Web (WWW’12), ACM, New York, 2012.
21. M. Staniek, K. Lehnertz, Symbolic transfer entropy.Phys. Rev. Lett.100, 158101 (2008). 22. C. Bandt, B. Pompe, Permutation entropy: A natural complexity measure for time series.
Phys. Rev. Lett.88, 174102 (2002).
23. T. Schreiber, Measuring information transfer.Phys. Rev. Lett.85, 461–464 (2000). 24. K. Hlaváčková-Schindler, M. Paluš, M. Vejmelka, J. Bhattacharya, Causality detection
based on information-theoretic approaches in time series analysis.Phys. Rep.441, 1–46 (2007). 25. K.-Y. Ni, T.-C. Lu, Information dynamic spectrum characterizes system instability toward
critical transitions.EPJ Data Sci.3, 28 (2014).
26. J. T. Lizier, J. Heinzle, A. Horstmann, J.-D. Haynes, M. Prokopenko, Multivariate information-theoretic measures reveal directed information structure and task relevant changes in fMRI connectivity.J. Comput. Neurosci.30, 85–107 (2011).
27. S. Kullback, R. A. Leibler, On information and sufficiency.Ann. Math. Stat.22, 79–86 (1951).
28. O. Sporns, D. R. Chialvo, M. Kaiser, C. C. Hilgetag, Organization, development and function of complex brain networks.Trends Cogn. Sci.8, 418–425 (2004).
29. M. De Domenico, A. Lima, P. Mougel, M. Musolesi, The anatomy of a scientific rumor.Sci. Rep.
3, 2980 (2013).
30. L. Peel, A. Clauset, Detecting change points in the large-scale structure of evolving networks,
Proceedings of the 29th International Conference on Artificial Intelligence (AAAI), pp. 2914–2920
(2015).
31. J. Borge-Holthoefer, A. Rivero, I. García, E. Cauhé, A. Ferrer, D. Ferrer, D. Francos, D. Iñiguez, M. P. Pérez, G. Ruiz, F. Sanz, F. Serrano, C. Viñas, A. Tarancón, Y. Moreno, Structural and dynamical patterns on online social networks: The Spanish May 15th movement as a case study.PLOS One6, e23883 (2011).
32. S. González-Bailón, J. Borge-Holthoefer, A. Rivero, Y. Moreno, The dynamics of protest re-cruitment through an online network.Sci. Rep.1, 197 (2011).
33. European Spatial Planning Observation Network, www.espon.eu [accessed 16 April 2014]. 34. D. Balcan, B. Gonçalves, H. Hu, J. J. Ramasco, V. Colizza, A. Vespignani, Modeling the spatial spread of infectious diseases: The GLobal Epidemic and Mobility computational model.
J. Comput. Sci.1, 132–145 (2010).
35. D. Balcan, H. Hu, B. Goncalves, P. Bajardi, C. Poletto, J. J. Ramasco, D. Paolotti, N. Perra, M. Tizzoni, W. Van den Broeck, V. Colizza, A. Vespignani, Seasonal transmission potential and activity peaks of the new influenza A(H1N1): A Monte Carlo likelihood analysis based on human mobility.BMC Med.7, 45 (2009).
36. American regions, http://en.wikipedia.org/wiki/List_of_regions_of_the_United_States [accessed 8 August 2015].
37. Brazilian states, http://en.wikipedia.org/wiki/States_of_Brazil[accessed 8 August 2015]. 38. Spain’s autonomous communities, http://en.wikipedia.org/wiki/Autonomous_communities_
of_Spain [accessed 8 August 2015].
39. D. Balcan, V. Colizza, B. Gonçalves, H. Hu, J. J. Ramasco, A. Vespignani, Multiscale mobility networks and the large scale spreading of infectious diseases.Proc. Natl. Acad. Sci. U.S.A.
106, 21484–21489 (2009).
40. M. Castells,Networks of Outrage and Hope: Social Movements in the Internet Age(John Wiley and Sons, New York, 2013).
41.Center for International Earth Science Information Network (CIESIN) and Centro Internacional
de Agricultura Tropical (CIAT). The Gridded Population of the World Version 3 (GPWv3): Population Grids (Socioeconomic Data and Applications Center, Columbia University, Palisades, New York), http://sedac.ciesin.columbia.edu/data/collection/gpw-v3.
42.International Food Policy Research Institute (IF- PRI), The World Bank, Center for International
Earth Science Information Network (CIESIN) and Centro Internacional de Agricultura Tropical (CIAT). Global Rural-Urban Mapping Project (GRUMP), Alpha Version: Population Grids (Socioeconomic Data and Applications Center, Columbia University, Palisades, New York), http://sedac.ciesin.columbia.edu/data/collection/gpw-v3.
43. M. D. Conover, C. Davis, E. Ferrara, K. McKelvey, F. Menczer, A. Flammini, The geospatial characteristics of a social movement communication network.PLOS One8, e55957 (2013). 44. GeoNames, www.geonames.org/ [accessed 2012].
45. P. Gerbaudo, Tweets and the streets: Social media and contemporary activism (Pluto Press, London, 2012).
46. C. W. J. Granger, Investigating causal relations by econometric models and cross-spectral methods.Econometrica37, 424–438 (1969).
47. J. J. Jones, R. M. Bond, C. J. Fariss, J. E. Settle, A. D. I. Kramer, C. Marlow, J. H. Fowler, Yahtzee: An anonymized group level matching procedure.PLOS One8, e55760 (2013). 48. M. B. Kennel, R. Brown, H. D. I. Abarbanel, Determining embedding dimension for phase-space
reconstruction using a geometrical construction.Phys. Rev. A45, 3403–3411 (1992). 49. S. Schinkel, N. Marwan, J. Kurths, Order patterns recurrence plots in the analysis of ERP
data.Cogn. Neurodyn.1, 317–325 (2007).
50. T. Schreiber, TISEAN software; www.mpipks-dresden.mpg.de/~tisean/Tisean_3.0.1. 51. T. Schreiber, Constrained randomization of time series data.Phys. Rev. Lett.80, 2105–2108
(1998).
52. T. Schreiber, A. Schmitz, Improved surrogate data for nonlinearity tests.Phys. Rev. Lett.77, 635–638 (1996).
53. C. E. Shannon, A mathematical theory of communication, 1948.Bell Syst. Tech. J.27, 379–423, 623–656 (1948).
54. S. A. Soule, The student divestment movement in the United States and tactical diffusion: The shantytown protest.Social Forces75, 855–882 (1997).
55. K. T. Andrews, M. Biggs, The dynamics of protest diffusion: Movement organisations, social networks, and news media in the 1960 sit-ins.Am. Sociol. Rev.71752–777 (2006). 56. R. K. Givan, K. M. Roberts, S. A. Soule, Eds.,The Diffusion of Social Movements: Actors,
Mechanisms, and Political Effects(Cambridge Univ. Press, Cambridge, 2010).
57. D. J. Wang, S. A. Soule, Social movement organizational collaboration: Networks of learning and the diffusion of protest tactics, 1960–1995.Am. J. Sociol.117, 1674–1722 (2012). 58. B. Carbunar, R. Potharaju, You unlocked the Mt. Everest badge on Foursquare! Countering
location fraud in geosocial networks,IEEE 9th International Conference on Mobile Adhoc
and Sensor Systems (MASS), pp. 182–190 (2012).
on May 18, 2018
http://advances.sciencemag.org/
Acknowledgments:We thank D. Allen, R. Compton, and T.-C. Lu at HRL Laboratories LLC for assistance with the Brazilian data set and useful discussions; we also thank A. Lima for sharing the Higgs boson data.Funding:B.G. thanks the Moore and Sloan Foundations for support as part of the Moore-Sloan Data Science Environment at New York University. A.A. acknowledges the support of the European Union MULTIPLEX (317532) and the Spanish Ministry of Science and Innovation (FIS2012-38266-C02-01) and partial financial support from the ICREA Academia and the James S. McDonnell Foundation. Y.M. acknowledges support from MINECO through grant FIS2011-25167, Comunidad de Aragón (Spain) through a grant to the group FENOL, and the European Com-mission Future and Emerging Technologies Proactive Project MULTIPLEX through grant 317532. For the analysis of data outside of the United States, A.V. and N.P. acknowledge the Intelligence Advanced Research Projects Activity (IARPA) via Department of Interior National Business Center (DoI/NBC) contract number D12PC00285. The views and conclusions contained herein are those of the authors and should not be interpreted as necessarily representing the official policies or endorsements, either expressed or implied, of IARPA, DoI/NBE, or the United States Government. The funders had no role in the study design, data collection and analysis, decision to publish, or preparation
of the manuscript.Author contributions:All authors contributed equally to this work. Com-peting interests:The authors declare that they have no competing interests.Data and ma-terials availability:All data needed to evaluate the conclusions in the paper are present in the paper, the Supplementary Materials, and/or www.jbh.cat/data/twitter_timeseries.tar.gz. Addi-tional data related to this paper may be requested from the authors.
Submitted 25 August 2015 Accepted 18 February 2016 Published 1 April 2016 10.1126/sciadv.1501158
Citation:J. Borge-Holthoefer, N. Perra, B. Gonçalves, S. González-Bailón, A. Arenas, Y. Moreno, A. Vespignani, The dynamics of information-driven coordination phenomena: A transfer entropy analysis.Sci. Adv.2, e1501158 (2016).
on May 18, 2018
http://advances.sciencemag.org/
Vespignani
Javier Borge-Holthoefer, Nicola Perra, Bruno Gonçalves, Sandra González-Bailón, Alex Arenas, Yamir Moreno and Alessandro
DOI: 10.1126/sciadv.1501158 (4), e1501158.
2 Sci Adv
ARTICLE TOOLS http://advances.sciencemag.org/content/2/4/e1501158
MATERIALS
SUPPLEMENTARY http://advances.sciencemag.org/content/suppl/2016/03/29/2.4.e1501158.DC1
REFERENCES
http://advances.sciencemag.org/content/2/4/e1501158#BIBL
This article cites 34 articles, 4 of which you can access for free
PERMISSIONS http://www.sciencemag.org/help/reprints-and-permissions
Terms of Service
Use of this article is subject to the
registered trademark of AAAS.
is a
Science Advances
Association for the Advancement of Science. No claim to original U.S. Government Works. The title
York Avenue NW, Washington, DC 20005. 2017 © The Authors, some rights reserved; exclusive licensee American (ISSN 2375-2548) is published by the American Association for the Advancement of Science, 1200 New
Science Advances
on May 18, 2018
http://advances.sciencemag.org/