Rationalizing the
customer service
process
139
Business Process Management Journal, Vol. 7 No. 2, 2001, pp. 139-156.#MCB University Press, 1463-7154
Rationalizing the customer
service process
Hee-Woong Kim
Massachusetts Institute of Technology, Cambridge, Massachusetts, USA, and
Young-Gul Kim
Korea Advanced Institute of Science and Technology, Seoul, Korea Keywords Customer service, Model, Organizational change, Performance, Simulation, Process management
Abstract Satisfying customers is the best method for organizations to gain competitive advantage. To deliver quality services to customers, we need to understand their expectations. Given accurate understanding of expectations, customer service, which can be regarded as a process that consists of several steps to satisfy customer requirements, should be redesigned to match them. This research intends to suggest a customer service rationalization method which consists of service process model, performance simulation, and contingent change guidelines. For the validation test, we compared the proposed method with other service models and applied it to several real cases. From the applications, we found that the proposed method could reduce the risk of service redesign projects by enabling the better understanding of the performance simulation data from the proposed change alternatives. Finally, we discussed the applications of the method and the implications of this research.
Introduction
Organization can be viewed as a set of processes (Galbraith, 1993; Mackenzie, 1989) which are structured to satisfy customers, internal or external. To deliver quality services to customers, however, we need to understand their expectations (Shostack, 1984). Given accurate understanding of expectations, customer service should be designed to match them. Here, customer service means those activities that occur at the interface between customers and server organization, other than proactive selling, aiming for customer satisfaction and operational efficiency (LaLonde and Zinszer, 1976; Lovelock, 1996; Rakowski, 1981-82). We can regard customer service as a process that consists of actual steps to satisfy customer requirements. For analyzing customer expectations and designing customer service, we need a customer service process model. A good service description with the process model is the first step for organizations to gain competitive advantage by satisfying customer needs (Innis and LaLonde, 1994). Accordingly, better service design provides the key to market success and to growth (Shostack, 1984).
Unlike manufacturing, however, service industries typically do not apply rigorous process design standards prior to introducing new services (Fisket al., 1993). The service description does not guarantee that the service will be
The research register for this journal is available at
http://www.m cbup.com/research_registers
The current issue and full text archive of this journal is available at
http://www.emerald-library.com/ft
Currently Hee-Woong Kim ([email protected]) works at the Consulting Division of LG-EDS in Seoul, Korea.
BPMJ
7,2
140
successful. Based on the description, we need to identify bottlenecks and rationalize them for effective customer service. In addition, we need to test the validity and feasibility of the changed service process before its real application. Without such a performance test, service change projects are liable to incur high risk due to their high management complexity and organization-wide impacts across functional units.
In this research, we aim to suggest a service process rationalization method to minimize the risk inherent in a service change project. For this purpose, first, we will suggest a customer service process model which can be used in understanding customer expectations by incorporating customer viewpoints and their actions to the model. Second, based on the service process model, performance test about the current and change alternatives can be done using simulation techniques. Third, based on the identified bottlenecks from the performance simulation, it is required to rationalize the customer service process. For this purpose, we suggest contingency-based service change guidelines. For the empirical validation test of the proposed method, we applied it to a patient’s consultation process at a real hospital.
Customer service process models
There are several service process modeling methods. In general, the chronological flowchart has been adapted in the service blueprint (Shostack, 1984). Service blueprinting, a process analysis methodology, was developed as a flow chart to systematize the description, documentation, and analysis of service process. Figure 1 shows an example of a blueprint for a shoeshine process. A circle means a service element while a rectangle implies a product element. The blueprint structures the process activities on either side of the ``line of visibility.’’ The activities above the line are visible to customers, those below the line are back-room activities that are necessary to complete the service operation but not visible to them. One of the most significant
Figure 1.
Blueprint for a corner shoeshine
Rationalizing the
customer service
process
141
differences in service blueprints compared to other process models or flow charts is the inclusion of customers, their actions, and their viewpoint in it. Thus, the entire design of the service operation can be seen as if through the customer’s eye. By explicitly depicting the interaction between server and customer, the blueprint makes it possible to easily identify the critical process points where customer service can be affected.
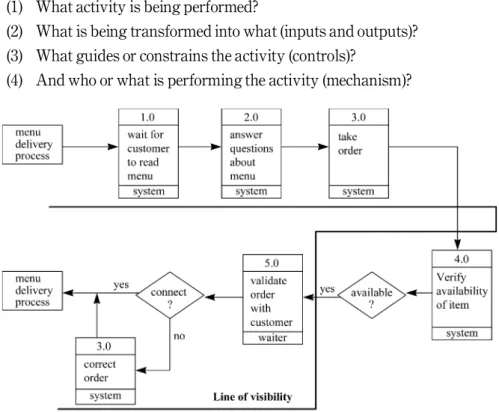
Based on the blueprinting concept, Ramaswamy (1996) suggested a flow chart for service design and management. It adopted several other modeling constructs such as decision branch and process owner. The flow chart models the sequence of functions to deliver service to customers. It represents the customer service interaction activities based on the blueprint convention. Figure 2 shows the flow chart of the order-taking process at a restaurant. The bottom of each rectangle represents the person or organization, function-owner, responsible for each function on the flow chart. As the design evolves through detail design into implementation, the name of the specific system component such as computer program or human operator that is responsible for each function will be added to the chart.
Congram and Epelman (1995) devised describing service process with the structured analysis and design technique (SADT). Based on the technique, service can be described with four perspectives:
(1) What activity is being performed?
(2) What is being transformed into what (inputs and outputs)? (3) What guides or constrains the activity (controls)?
(4) And who or what is performing the activity (mechanism)?
Figure 2.
Flow chart for ``take and deliver order’’ in a restaurant
BPMJ
7,2
142
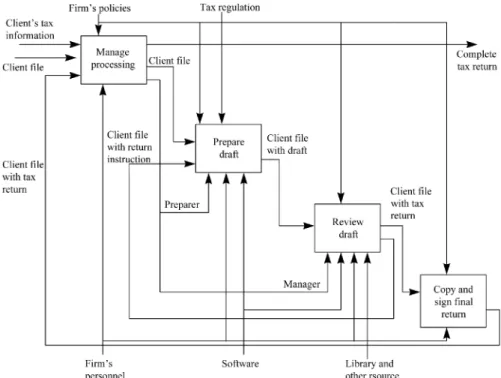
Figure 3 shows an example of SADT model for the tax return process. Although it is possible to model several perspectives with SADT, it is somewhat complex because of too many arrows between activities. In addition, it is used for information flow modeling rather than process flow modeling. Analysis of these service process models reveals the problems inherent in using a flow-diagram approach. The meanings of modeling constructs are ambiguous
and inconsistent (Congram and Epelman, 1995). The problem of
comprehensibility is compounded by the inconsistent levels of detail that occur throughout a diagram. The most critical problem is that there have been few researches on the practical applications of service process models.
Based on these problems, we identified several requirements for the customer service process model. First, since it aims to model customer service, it should focus on customer-server interaction activity flows. Second, the interaction activity flows should be modeled from the customer’s viewpoint, which can be used in identifying customer requirements more correctly and enhancing customer satisfaction. Then, the model can be seen as if through the customer’s eyes. Third, the model should be diagrammatic for easy communication between customers, service employees, and managers. The understandability of the model can also foster collaboration between the operations, marketing, and service employees. Fourth, the model should reflect the four representation perspectives of Curtiset al. (1992) in process modeling,
Figure 3.
SADT for the tax return process (Congram and Epelman, 1995)
Rationalizing the
customer service
process
143
which will be discussed next: functional (activity and data flow), behavioral (activity flow), organizational (place and server), and informational (data). Finally, the model should be useful in bottleneck identification and its rationalization. Based on these requirements, we developed a customer service rationalization method.
Customer service rationalization method
The customer service rationalization method is composed of three components: service process modeling with Dynamic-Event Process Chain (Dynamic-EPC), performance measurement with simulation techniques, and service process change with performance-based change guidelines.
Service process modeling
Dynamic-EPC originates from the Event-Process Chain (EPC) modeling method (Kim, 1995) that supports the modeling and redesign of business process by adopting a strong customer perspective. Dynamic-EPC has five
constructs as in Figure 4:event, process, branching, flowandwait.Eventis a
change of status perceived by customers. Here the customer means any person or organization, both internal or external, which has a need that the server organization attempts to satisfy. If the change is implicit or not perceived by the customer, it does not need to be modeled explicitly. But if the perceived change affects the customer’s next behaviors, then it should be modeled explicitly for enhanced understanding of the business situation from the customer perspective.
Process is an activity or series of activities performed by the customer or between the customer and server organization. Activities performed solely by a server organization without customer involvement are not of interest, and thus not shown on the Dynamic-EPC diagram. Time for such activities is treated as
Figure 4.
Dynamic-EPC constructs
BPMJ
7,2
144
a ``wait’’ in service. For example, if a customer orders food at a restaurant, the
time between ordering and receiving the food is treated as await. The customer
does not need to know details of how the order was processed inside the kitchen.
Waitis defined as the customer’s delay before start of an event or a process
after requesting service due to the internal process of the server organization and represented by the letter W. It means the duration between customer’s requesting service and receiving it. During that period, internal processes of the server organization will be performed without customer’s involvement to meet customer’s needs, and are not shown to customers. While a queue waiting at a station means the delay for getting service before interacting with the server, the wait means the delay after initiating the service. If customers feel that the
waitis too time consuming, then we can analyze and rationalize it. If customers
accept thewait, however, then we do not have to change it. Not only theProcess
but also thewaitcan be exploded into lower level Dynamic-EPC model where
customer object derived from the external customer takes the role of the
internal customer. By exploding the wait, we can analyze and model the
internal process of the organization along the customer object’s movement. Again, using the restaurant example, even though the internal process of the kitchen is hidden at the top level Dynamic-EPC diagram, it can be exploded into a lower level diagram.
Branch is a conditional splitting of an event-process into sub-flows. Flow means the customer or customer object’s movement across time and stations.
Each modeling construct is specified with the Backus-Naur Form (BNF) for performance simulation and information management. The creation interval of
event construct is specified for simulation. Process is specified with its
processing time for simulation, its input and output, rule such as constraint, resource required for performing the process, and actor who is performing it.
Flowcan be optionally specified with either its customer or a customer object
depending on the movement along the process. The moving time is used for
simulation. The waiting time ofwaitconstruct is optionally used for conceptual
understanding about the situation. Branching is specified with its branching
condition and ratio for simulation. Finally, station is specified with its name
and the number of servers for simulation.
Figure 5 is a simple Dynamic-EPC diagram illustrating the customer’s visiting process at a restaurant with some specifications. The modeling constructs are drawn on two dimensions: station dimension vertically and time dimension horizontally. Customers receive service as they move through these processes and events.
Performance measurement
Based on the process model, we can simulate the customer service process for performance measurement. For the service measurement, we selected customer service-related criteria such as throughput time, moving time, and queue waiting time from the service quality model (Cronin and Taylor, 1992;
Rationalizing the
customer service
process
145
Parasuraman et al., 1988). For the organizational performance measurement,
we selected three factors from the rational goal dimension of the effectiveness model (Quinn and Rohrbaugh, 1983): utilization, efficiency, and productivity. Utilization means the station’s usage against its work capacity. Efficiency can be measured with customer’s throughput time and delay time. Productivity can be measured with throughput. Table I summarizes the simulation functions transformed from the above factors.
Throughput time is the total amount of time customers spend over the entire service process cycle. It consists of customer’s moving time, queue waiting time, and processing time along the service process. Customer’s delay time at a station is the summation of his/her moving time to a station and queue waiting time for getting service. The delay time at each station should be minimized as much as possible for customer satisfaction. Delay time is the average summation of customer’s moving time to a station and queue waiting time for service at a station. Utilization of each station indicates how much work it does against its work capacity. When organizational change takes place, stations with many differences such as too low or too high utilization compared to other stations are frequently targeted. Throughput is the total number of customers or outputs passing through the service process, which directly affects organizational performance in terms of productivity.
Figure 5.
Dynamic-EPC diagram for a customer’s visit to a restaurant
BPMJ
7,2
146
Service process change
Performance of a service process needs to be improved in two ways: first, to maximize customer’s satisfaction, and second, to do it as efficiently as possible. For customer satisfaction, we focused on the process throughput time and its most critical component, the customer’s delay time. Second, for the
organization’s management performance, we focused on improved
productivity and each station’s utilization. Based on the customer’s delay time and the station’s utilization considering the common applicability to any domain, we can classify service processes at stations into four situations and suggest change guidelines as in Figure 6 (Kim and Kim, 1997).
Table I.
Simulation functions
Factor Function
Customer’s throughput time Pt pˆ1
Pt kˆ1
Pn jˆ1
…moving timejpk‡waiting timejk‡processing timejk†
n
Customer’s delay time at stationk P t
pˆ1
Pn jˆ1
…moving timejpk‡waiting timejk†
n
Utilization of stationk …working timeworking amountk£number of serversk k†
Productivity n at stationk=t
Key:where
k = station number, where k = 1..t j = the customer at stationk, where j = 1..n
p = a station participating in the service process, where p = 1..t t = total number of stations in the service process
n = total number of customers that have passed through stationk working_amountk= server’s actual working time at stationk working_timek= server’s arranged working time at stationk number_of_serversk= total number of servers at stationk waiting_timejk= thejth customer’s queue waiting time at stationk
processing_timejk= server’s processing time for thejth customer at stationk
moving_timejpk= thejth customer’s moving time in the process flow from stationpto stationk
Figure 6.
Performance-based change guidelines
Rationalizing the
customer service
process
147
In situation 1, customers pass through a highly utilized station with short delay time. Since the station is also highly utilized, it is an ideal situation for
management. It requires no change action (G1).
Situation 2 occurs when the station is highly utilized but customer delay time is long. From the customer perspective, we need to shorten the delay time
by minimizing customer’s frequent moving/waiting time (G2). For this
purpose, we can relocate stations to minimize distance between them. Also we can rearrange the processes and/or events to take place more in parallel because sequential processing is generally more time consuming than the parallel. From the organization perspective, we need to increase the station’s
work capacity (G3). For this purpose, we can standardize or integrate the
redundant processes to reduce the number of processes. And we can consider shortening the processing time by automating some manual tasks when they cannot be eliminated. If the work capacity cannot be increased by any information technology or procedural change, then we should consider adding more human servers or installing additional hardware facilities.
In situation 3, customers pass through a less busy station with short delay time. From the customer’s perspective, they can receive service rapidly, possibly as soon as they arrive at the station. But it is not a preferable situation from the management perspective, because the station is under-utilized. Therefore we should allocate some work performed at other overloaded stations to this station or transfer surplus work capacity to other overloaded ones (G4).
Situation 4 occurs when customers experience long delays while the stations are under-utilized. This may result from either a peak-load condition or a batch-oriented work policy. If the peak-time rush is the cause, we may try to change the customers’ arrival pattern (G5). For instance, providing time period-related incentives may be considered to balance the peak-time utilization. On the other hand, the station’s batch-oriented work policy may be the cause. For instance, if account adjustment and expense handling tasks are performed once a week in the accounting department, we can consider changing the work processing
mode from batch to interactive (G6) since the batch processing model may
boost internal efficiency at the expense of more critical customer satisfaction.
Comparison with other service process models
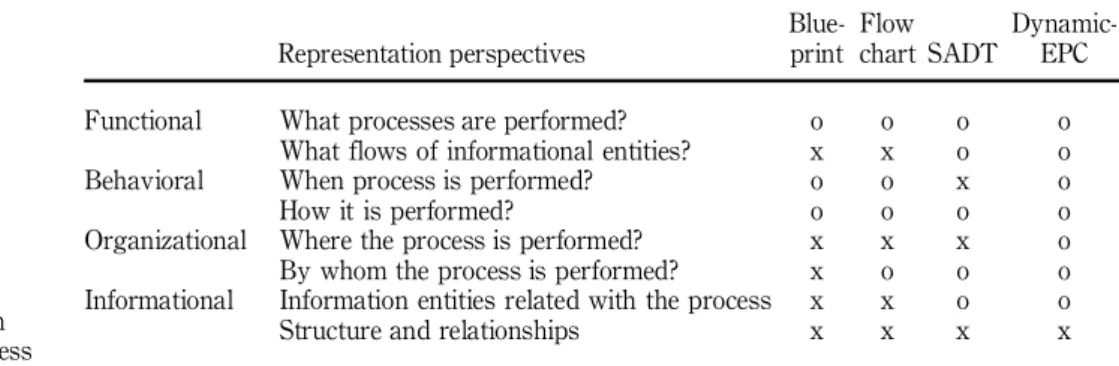
The proposed Dynamic-EPC can be compared to other service process models ±
Blueprint(Shostack, 1984), SADT (Cronin and Taylor, 1992), and Flow chart
(Ramaswamy, 1996) ± as in Table II from the four representation perspectives of Curtiset al. (1992): functional, behavioral, organizational, and informational.
WhileBlueprint(Shostack, 1984) deals with the behavioral perspective using
time dimension, it does not reflect other perspectives such as place and server elements in the model. As modeling constructs, process and service elements are used in this model. And the ``line of visibility’’ has been adopted to classify the customers’ actions and internal operations in the model. For the service process change, simple profitability analyses are conducted based on the model.
BPMJ
7,2
148
Flow chart (Ramaswamy, 1996) has adopted the conventions of the Blueprint.
This model deals with the organizational perspective using server element in
addition to the behavioral perspective. For the service process change, Flow
chartsupports identification of service process. Although it is not directly used for simulation, it becomes a preliminary basis for it. And this model is used for service process design and management.
SADT(Cronin and Taylor, 1992) focuses on information management rather
than service process flow. Although it deals with functional perspective, it cannot fully reflect behavioral and organizational perspectives because it does not consider place and time dimensions in the model. However, it models a service process with input, output, control, and mechanism. The primary objective of this model is the representation of a business systems structure with data flow, not the behavior of the system over time. For this reason, it is difficult to use this model for customer service process change because of its static characteristics.
Compared to other service process models, Dynamic-EPC supports service process representation with the diagram and its information management with the specification from the four perspectives. Although Dynamic-EPC deals with the informational entities related with the process of informational perspective, it does not model the structure and relationships between information entities which
can be used for database system development. The modeling construct, wait,
takes a similar role to the ``line of visibility’’ in Blueprint. For the service process change, we can measure the responsiveness dimension of customer service quality and process performance using simulation techniques while it is difficult to test the performance using other models. From the comparison, we can know that the proposed service rationalization method with Dynamic-EPC seems most appropriate for customer service process analysis, management, and change.
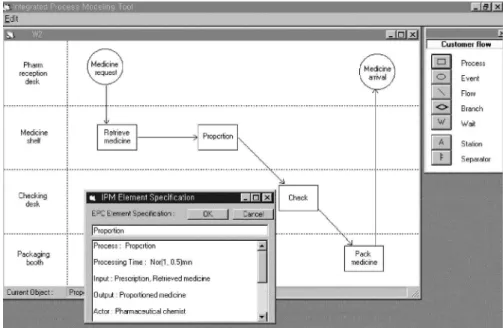
Application
To support service process modeling, we developed a modeling tool called Integrated Process Modeling Tool (IPMT) with Visual Basic in a PC Windows environment. In this paper, we will introduce the application case of the method
Table II.
Comparison of dynamic-EPC with other service process models Representation perspectives Blue-print Flow chart SADT Dynamic-EPC
Functional What processes are performed? o o o o
What flows of informational entities? x x o o
Behavioral When process is performed? o o x o
How it is performed? o o o o
Organizational Where the process is performed? x x x o
By whom the process is performed? x o o o
Informational Information entities related with the process x x o o
Structure and relationships x x x x
Rationalizing the
customer service
process
149
at the Seoul Adventist Hospital. Seoul Adventist Hospital operates 17 departments and has 110 doctors and 406 beds. The hospital keeps the annual/ monthly/daily number of patients of each department, from which we could assume the customer’s arrival pattern and branching ratio. On average, about 1,100 outpatients come to the hospital for doctor consultations each day. We picked the outpatient’s consultation process across the internal medicine (IM) department, testing room, and pharmacy, because it is representative of the most critical and time-consuming processes.
Analysis and performance measurement of the current situation
The top level of the outpatient’s visit process is shown in Figure 7. The process is initiated by a patient’s arrival at the hospital. Patients arrive at the hospital randomly or by appointment with a rate of 1 patient/0.45min. It follows an exponential distribution. Arrived patients register and pay in advance the doctor’s fee after waiting for a while in a queue. This process can be performed by one of the eight servers with an average processing time of two minutes (here, processing time follows a normal distribution). Registered outpatients walk to the internal medicine department and the moving time follows a normal distribution with a mean of one minute and standard deviation of 0.5 minute. Arriving at the internal medicine department’s waiting room, the patient waits for his turn. During that time, the patient chart will be delivered from the chart room to the department (W1), which takes about 15 minutes. Those data about processing time at each step came from the measurement, time analysis. Those specification data about the number of servers at a station, input, and output were gathered from interview. These several process-related data can be specified and managed using the tool.
There are four doctors in the internal medicine department. Each out-patient will be consulted by one of them for about ten minutes. After the consultation, those who need additional step(s) ± medicine or testing ± have to pay again for the step(s) in advance. Arriving at the testing room, the patient submits the pre-paid slip and is tested. Arriving at the pharmacy desk, the patient submits his/ her prescription slip to request medicine. The amount of time the customer has to wait for his medicine is represented as ``wait’’. It can be exploded into a lower level Dynamic-EPC (Figure 8) where the prescription slip (customer object) takes the customer’s (patient) role and goes through the internal pharmacy process. The ``Proportion’’ process is specified using the tool. After receiving the medicine, the patient leaves the hospital.
The current situation about the outpatient’s visit process is simulated with SIMPROCESS II.5 (CACI, 1993). The visualization capability enables us to verify the simulation model easily. After verifying the model, we should set three parameters (warm-up period, run-length, number of replications) for the simulation. In the hospital case, the run-length is eight hours because the hospital operates from 8 a.m. to 5 p.m. except for one hour lunch time with zero warm-up period. The number of replications can be set by choosing the
BPMJ
7,2
150
variables selected. We set it at 19 times with the 95 per cent confidence interval based on 3.87 as half width of the confidence interval and 8.66 as standard deviation.
Figure 7.
Outpatient’s visit process: current case
Rationalizing the
customer service
process
151
The simulation results are summarized in Table III. The throughput time of the process is 75.5 minutes. Patients have to wait too long at the internal medicine department (31.2 min) and at the pharmacy (21.9 min), while these two stations’ utilization is higher (internal medicine department: 97.4 per cent; pharmacy: 96.4 per cent) than that of others. And the number of outpatients consulted by the doctors at the internal medicine department is 182 according to the simulation. However a small portion of arrived patients cannot be consulted because of the IM department’s limited capacity.
Organizational change and performance measurement
We should investigate which station incurs a long delay time based on the suggested change guidelines. From the performance measurement results about the current case, delay times at the internal medicine department (31.2 minutes) and the pharmacy (21.9 minutes) are longer than those at other stations. And, the utilization of those two stations is higher (IM dept: 97.4 per cent; pharmacy: 96.4 per cent) than others. These two cases, therefore, belong to
Figure 8. Dynamic-EPC exploded from W2 Table III. Performance measurement results about the current case Customer service perspective Organizational performance perspective
Delay time Recept. desk 5.8 min Utilization Recept. 81.9%
IM dept. 31.2 min Desk 97.4%
Pharmacy 21.9 min IM dept. 96.4%
Exam. room 1.6 min Pharmacy 71.4%
Test. room
BPMJ
7,2
152
situation 2 ± long delay time and high utilization± in Figure 3. We need to
change the service processes between these two stations.
According to the change guideline (G2. Minimize customer’s delay time) in
situation 2, we consider performing process/event parallel. That is, the medicine request/testing is transmitted electronically to the pharmacy or the testing room during the patient’s consultation with the doctor by using a new consultation support system. Also we consider automating most of the activities inside the pharmacy to shorten the processing time. By the time the patient arrives at the pharmacy, his/her medicine is already waiting for him or her. Or, the patient can be tested without any delay at the testing room.
Also, the internal medicine department is a change target as it falls into
situation 2. According to the change guideline (G3), we should increase the
station’s work capacity. The internal medicine department’s work capacity depends on the number of doctors because the consultation, by nature, is a manual process. Since adding more servers (doctors) usually incurs high organizational costs, however, we need to recommend such an alternative very carefully and after all other alternatives are first applied.
Next, we consider patients at the reception desk. Since the current registration is performed manually, it is slow and time-consuming. Also, there are redundant tasks ± Register and pay, Pay for the next step ± in Figure 7.
According to the change guideline (G2. Minimize customer’s delay time) in
situation 2, we integrated the registration and payment processes by issuing each patient a smart card with all their personal health history and bank account information. When the patient arrives at the doctor’s office after checking his/her card at the reception desk with the registration system server (not human server), the patient is registered and the consultation history data is already prepared. Using the smart card, we can change the ``registration and pay’’ process into an event. Also all the patient’s expenses that day will be handled through his or her bank account. All of these changes are reflected in the alternative case 1 (Figure 9).
Case 1 is simulated and its performance measurement results are summarized and compared with the current situation in Table IV. According to the simulation, the throughput time is shortened from 75.5 to 61.1 minutes. Patient’s delay times at each station are shortened except at the internal medicine department. And the utilization of the reception desk is reduced from 81.9 per cent to 34.7 per cent with the help of IT ± smart card. Finally, the shortened throughput time increased the throughput, the number of consulted outpatients, from 182 to 194. More patients can be consulted in the changed case than the current one.
Case 1 reveals some improvements in throughput time, patient’s delay time, and stations’ utilization. But, we can expect more improvement because case 1 still shows long delay time at the internal medicine department and too low utilization of the reception desk. Patients at the internal department still belong to situation 2 ±long delay time and high utilization. The reception desk belongs to situation 3 ±short delay time and low utilization. For this reason, we decided
Rationalizing the
customer service
process
153
to increase the internal medicine department’s work capacity according to the suggested action guideline (G3. Increase the station’s work capacity). Since the doctor’s consultation work cannot be automated, we added two more doctors to the internal medicine department in the redesigned case 2. Also, according to
the guideline (G4. Transfer some of work capacity) in situation 3, we reduced
the number of servers at the reception desk from eight to three without any procedural change.
Performance measurement results about case 2 and its comparison with current situation are summarized in Table V. The throughput time is shortened from 75.5 minutes to 18.2 minutes. Customer’s delay times at each station are significantly shorter than the current one. Also workload balancing among those stations is more even than in case 1, except the reception desk consists of registration system servers, not employees. The throughput is also increased from 182 to 213. From these results, we can know that all of the stations belong
Figure 9.
Changed visit process: case 1
Table IV.
Performance measurement results about current and case 1
Factor Current case Case 1 Difference
Station’s utilization Reception desk % 81.9 34.7 ± 47.2
IM department % 97.4 98.8 +1.4
Pharmacy % 96.4 78.1 ± 18.3
Testing room % 71.4 77.0 ± 5.4
Delay time Reception desk (min) 5.8 0.2 ± 5.6
IM department (min) 31.2 47.4 +16.2
Pharmacy (min) 21.9 1.2 ± 20.7
Testing room (min) 1.6 1.2 ± 0.4
Throughput time Mean time (min) 75.5 61.1 ± 14.3
Standard deviation 8.7 5.6
BPMJ
7,2
154
to situation 1. We tested that there is difference between the current case and case 2 using the null hypothesis test ata= 0.05.
We can compare the results from the organizational performance and
customer service dimensions. From the organizational performance
perspective, productivity of throughput and efficiency of throughput time have been improved. The use of resource with utilization is lower than the current situation except the reception desk, while those stations in the current situation are overloaded. Case 2, however, achieved a more even use of resources than the current situation across the IM department, pharmacy, and testing department. From the customer service perspective, shortened delay times at several stations and the dramatically shortened throughput time imply that the responsiveness of customer service is enhanced in case 2.
Discussion
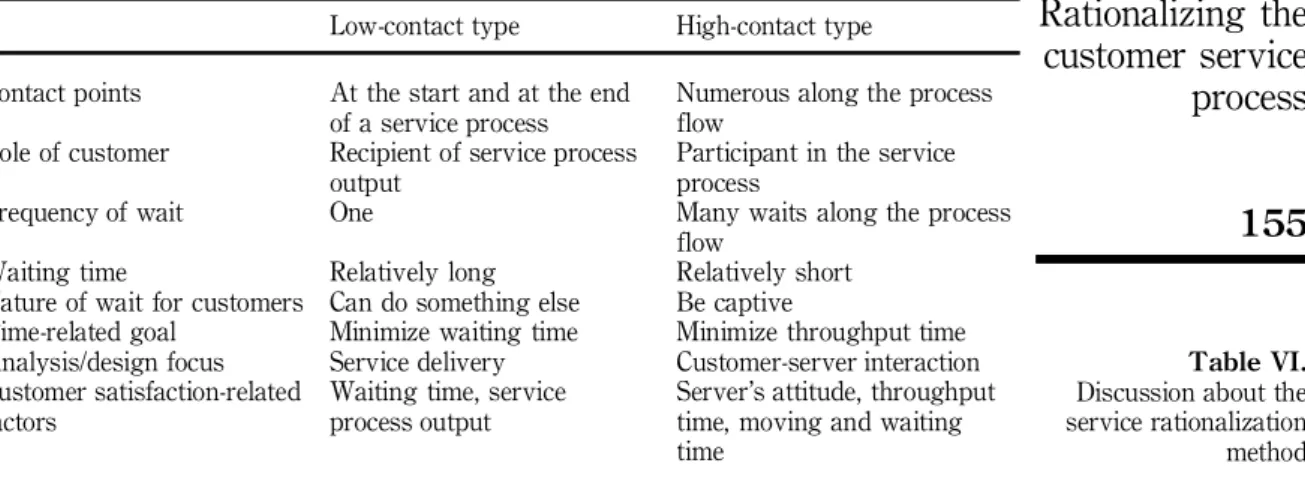
In addition to the hospital case, the method and tool have been applied to several real cases such as order processing at a cable-TV home shopping company and project order tracking process at an advertising agency (Kim, 1998). We can classify customer service processes by the frequency of contacts between customer and server-organization: low-contact type and high-contact type. Based on the classification, we can discuss the applications of the proposed method as in Table VI. In the low-contact type, customers initiate the server-organization’s service process and wait for the process output without participating in it such as customer’s order cycle process. There is just one wait between the start and the end of a service process. Since the waiting time takes the entire throughput time of a service process performed inside the server-organization, it is relatively longer than that of the high-contact type. Since customers do not participate in the server-organization’s process, they can do something else during the wait. For this reason, a time-related goal of this type is minimizing the waiting time. The focus of service process analysis and
Table V.
Comparison between current and case 2
Criteria Current with s.d. Case 2 with s.d. Difference Confidence interval Utilization Recept. desk 81.9% (3.4) 92.4% (5.1) +13.5% (± 15.4, ± 5.6)***
IM dept. 97.4% (2.1) 65.9% (6.2) ± 31.5% (26.6, 36.5)* Pharmacy 96.4% (2.3) 79.5% (4.3) ± 16.9% (13.3, 20.5)* Test. room 71.4% (6.8) 78.4% (6.7) ± 7.0% (± 11.5, ± 2.5)*** Delay time Recept. desk 5.8 min (1.3) 0.9 min(0.2) ± 4.9 min (4.3, 5.5)*
IM Dept. 31.2 min (4.6) 2.4 min(0.7) ± 28.8 min (26.6, 31.0)* Pharmacy 21.9 min (3.2) 1.3 min(0.4) ± 20.6 min (19.0, 22.2)* Test. room 1.6 min (0.5) 1.5 min(0.5) ± 0.1 min (± 0.2, 0.4)** Through-put time Mean time 75.5 min(8.7) 18.2 min(2.1) ± 57.3 min (51.9, 62.7)* Through-put Consulted
patients 182 (5.1) 213 (6.3) + 32 (± 34.7, ± 27.2)***
Rationalizing the
customer service
process
155
design in this type is the service delivery. Therefore, a customer’s main concerns are service process output and waiting time.
In the high-contact type, there are numerous contact points in this type of patient’s visit process at a hospital because customers initiate a service process and also participate in it along the process flow. While the customer’s role in the low-contact type is the recipient of service process output, the customer’s role in the high-contact type is as the participant in performing the service process. For this reason, several waits can be created along the process flow which take a relatively shorter time when compared to the low-contact type. The participation characteristic inhibits customers from doing something else during not only the wait but also during the entire service process. For this reason, a time-related goal of this type is minimizing the throughput time. And the focus of service process analysis and design is the customer-server interaction. Therefore, customer satisfaction in this type is mainly related to the server’s attitude and the responsiveness-related factors such as throughput time and delay time (moving and waiting time).
Conclusion
In this research, we suggested a service process rationalization method composed of a service process model, performance measurement, and change guidelines. This research sets forth a way to explicitly link the customer view to a service process model and yet have the process model be able to support simulation. Compared to other service process models, Dynamic-EPC incorporates not only the customer viewpoint but also reflects four representation perspectives in it. Second, the performance simulation results provide a more objective basis for service change decisions, which reduce the risk inherent in service process change. Third, the proposed change guidelines can be used by practitioners in devising a contingency approach to service process change projects. While some general change principles have been suggested previously, the classified customer service process situations and the
Table VI.
Discussion about the service rationalization method Low-contact type High-contact type
Contact points At the start and at the end of a service process
Numerous along the process flow
Role of customer Recipient of service process output
Participant in the service process
Frequency of wait One Many waits along the process
flow
Waiting time Relatively long Relatively short
Nature of wait for customers Can do something else Be captive
Time-related goal Minimize waiting time Minimize throughput time Analysis/design focus Service delivery Customer-server interaction Customer satisfaction-related
factors
Waiting time, service process output
Server’s attitude, throughput time, moving and waiting time
BPMJ
7,2
156
contingent guidelines have advantages in identifying the service situation and devising situation-specific change alternatives. However, we need to expand the performance measurement about customer service from quantitative to qualitative factors.
References
CACI Products Company (1993),SIMFACTORY II.5 and SIMPROCESS Manual.
Congram, C. and Epelman, M. (1995), ``How to describe your service: an invitation to the structured analysis and design technique’’, International Journal of Service Industry Management, Vol. 6 No. 2, pp. 6-23.
Cronin, J.J. and Taylor, S.A. (1992), ``Measuring service quality: a reexamination and extension’’,
Journal of Marketing, Vol. 56, July, pp. 55-63.
Curtis, B., Keller, M.I. and Over, J. (1992), ``Process modeling’’,Communications of the ACM, Vol. 35 No. 9, pp. 75-90.
Fisk, R.P., Brown, S.W. and Bitner, M.J. (1993), ``Tracking the evolution of the service marketing literature’’,Journal of Retailing, Vol 69 No 1, Spring, pp. 61-103.
Galbraith, J.R. (1993),Competing with Flexible Lateral Organizations, 2nd ed., Addison-Wesley, Reading, MA.
Innis, D.E. and LaLonde, B.J. (1994), ``Customer service: the key to customer satisfaction, customer loyalty, and market share’’,Journal of Business Logistics, Vol. 15 No. 1, pp. 1-27.
Kim, H.W. (1998),Enhancement of Organizational Performance Using Dynamic Process Modeling and Simulation, PhD Dissertation, Korea Advanced Institute of Science and Technology. Kim, H.W. and Kim, Y.G. (1997), ``Dynamic process modeling for BPR’’, Information &
Management, Vol. 32 No. 1, pp. 1-13.
Kim, Y.G. (1995), ``Process modeling for BPR: event-process chain approach’’, Proceedings of International Conference on Information Systems, pp. 109-21.
LaLonde, B.J. and Zinszer, P.H. (1976),Customer Service: Meaning and Measurement, National Council of Physical Distribution Management, Chicago, IL.
Lovelock, C.H. (1996),Service Marketing, 3rd ed., Prentice-Hall, Englewood Cliffs, NS.
Mackenzie, K.D. (1989), ``The process approach to organizational design’’, Human Systems Management, Vol. 8, pp. 31-43.
Parasuraman, A., Zeithaml, V.A. and Berry, L.L. (1988), ``SERVQUAL: a multiple-item scale for measuring consumer perceptions of service quality’’,Journal of Retailing, Vol. 6 No. 1, pp. 12-40.
Quinn, R.E. and Rohrbaugh, J. (1983), ``A spatial model of effectiveness criteria: towards a competing values approaches to organizational analysis’’,Management Science, Vol. 29 No. 3, pp. 363-77.
Rakowski, J.P. (1981-82), ``The customer service concept’’, Review of Business & Economic Research, No. 2, Winter, pp. 55-66.
Ramaswamy, R. (1996),Design and Management of Service Process, Addison-Wesley Publishing Company, Reading, MA.
Shostack, G.L. (1984), ``Designing services that deliver’’, Harvard Business Review, January-February, Vol. 62, pp. 133-9.