Cause-Specific Excess Deaths Associated
With Underweight, Overweight, and Obesity
Katherine M. Flegal, PhD Barry I. Graubard, PhD David F. Williamson, PhD Mitchell H. Gail, MD, PhD
I
N A PREVIOUS STUDY,1WE ESTI-mated excess all-cause mortality as-sociated with underweight, over-weight, and obesity in the United States in 2000 using data from na-tional surveys. We found significantly increased all-cause mortality in the un-derweight and obese categories and sig-nificantly decreased all-cause mortal-ity in the overweight category compared with normal weight. To gain further in-sight into these findings, we now ex-tend that work, using additional mor-tality data with longer follow-up, to examine the association of cause-specific mortality with different weight categories among US adults in 2004. METHODS
The general approach used to esti-mate excess deaths builds on that of Al-lison et al.2Numbers of deaths in 2004 for people 25 years and older came from US vital statistics.3We used underly-ing cause-of-death information that had been recoded using a standard list of 113 causes of death; details of the cor-respondingInternational Classifica-tion of Diseases, Ninth Revision (ICD-9)
and ICD-10codes are shown else-where.4We grouped deaths into 3 ma-jor categories: cardiovascular disease (CVD), cancer, and all other causes (ie, noncancer, non-CVD deaths). For some analyses, these categories were di-vided further.TABLE1shows the group-ings and the total number of deaths from each cause in the United States,
based on 2004 mortality data3for people 25 years and older. Following the Na-tional Cancer Institute Obesity and Cancer Fact Sheet,5we considered deaths from colon cancer, breast cer, esophageal cancer, uterine can-cer, ovarian cancan-cer, kidney cancan-cer, and pancreatic cancer to be deaths from obe-sity-related cancers.
All other data came from the Na-tional Health and Nutrition Examina-tion Survey (NHANES) program of the National Center for Health Statistics. In
each survey a different nationally rep-resentative cross-sectional sample of the US population was examined. To esti-mate relative risks, we used baseline Author Affiliations:National Center for Health Sta-tistics, Centers for Disease Control and Prevention, Hy-attsville (Dr Flegal) and Division of Cancer Epidemi-ology and Genetics, National Cancer Institute, Bethesda (Drs Graubard and Gail), Maryland; and Division of Diabetes Translation, Centers for Disease Control and Prevention, Atlanta, Georgia (Dr Williamson). Corresponding Author:Katherine M. Flegal, PhD, Na-tional Center for Health Statistics, Centers for Dis-ease Control and Prevention, 3311 Toledo Rd, Room 4201, Hyattsville, MD 20782 ([email protected]). Context The association of body mass index (BMI) with cause-specific mortality has not been reported for the US population.
Objective To estimate cause-specific excess deaths associated with underweight (BMI ⬍18.5), overweight (BMI 25-⬍30), and obesity (BMIⱖ30).
Design, Setting, and Participants Cause-specific relative risks of mortality from the National Health and Nutrition Examination Survey (NHANES) I, 1971-1975; II, 1976-1980; and III, 1988-1994, with mortality follow-up through 2000 (571 042 person-years of follow-up) were combined with data on BMI and other covariates from NHANES 1999-2002 with underlying cause of death information for 2.3 million adults 25 years and older from 2004 vital statistics data for the United States.
Main Outcome Measures Cause-specific excess deaths in 2004 by BMI levels for categories of cardiovascular disease (CVD), cancer, and all other causes (noncancer, non-CVD causes).
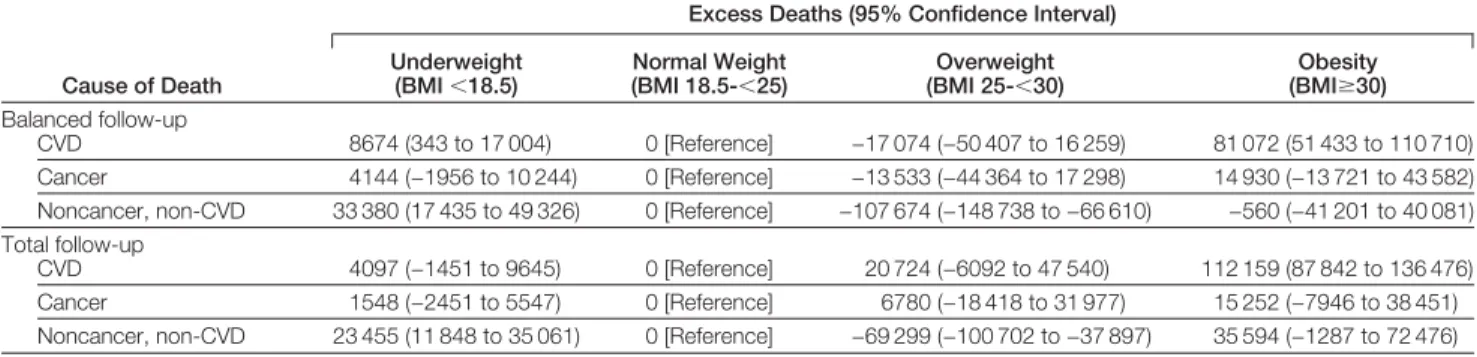
Results Based on total follow-up, underweight was associated with significantly in-creased mortality from noncancer, non-CVD causes (23 455 excess deaths; 95% con-fidence interval [CI], 11 848 to 35 061) but not associated with cancer or CVD mor-tality. Overweight was associated with significantly decreased mortality from noncancer, non-CVD causes (−69 299 excess deaths; 95% CI, −100 702 to −37 897) but not as-sociated with cancer or CVD mortality. Obesity was asas-sociated with significantly in-creased CVD mortality (112 159 excess deaths; 95% CI, 87 842 to 136 476) but not associated with cancer mortality or with noncancer, non-CVD mortality. In further analy-ses, overweight and obesity combined were associated with increased mortality from diabetes and kidney disease (61 248 excess deaths; 95% CI, 49 685 to 72 811) and decreased mortality from other noncancer, non-CVD causes (−105 572 excess deaths; 95% CI, −161 816 to −49 328). Obesity was associated with increased mortality from cancers considered obesity-related (13 839 excess deaths; 95% CI, 1920 to 25 758) but not associated with mortality from other cancers. Comparisons across surveys sug-gested a decrease in the association of obesity with CVD mortality over time. Conclusions The BMI-mortality association varies by cause of death. These results help to clarify the associations of BMI with all-cause mortality.
JAMA. 2007;298(17):2028-2037 www.jama.com
data from NHANES I, 1971-1975; NHANES II, 1976-1980; NHANES III, 1988-1994, and underlying cause-of-death mortality data through 2000 for these surveys (TABLE2).6-12Height and weight were measured using standard-ized procedures. Body mass index (BMI) was calculated as weight in ki-lograms divided by height in meters squared. Baseline age was age at the time of the examination.
We calculated relative risks for each category of causes of death using Cox proportional hazard models with age as the time scale.13 Because the propor-tional hazards assumption was not met across age, we divided the data into 3 age strata, 25 to younger than 60 years, 60 to younger than 70 years, and 70 years and older and fit models sepa-rately within each age stratum. Be-cause age is the time scale, these age strata refer to attained age, rather than to age at baseline. For all analyses, we used BMI categories of 18.5 or less (un-derweight), 18.5 to less than 25 (nor-mal weight, reference category), 25 to less than 30 (overweight), 30 to less than 35 (obesity grade 1), and 35 or greater (obesity grades 2 and 3).14,15The model included BMI categories, sex, smoking status (never, former, cur-rent), race (white, black, other), and al-cohol consumption categories in ounces per day (none,⬍0.07, 0.07-⬍0.35, and
ⱖ0.35).
To calculate the proportion of deaths in 2004 associated with each BMI level, we first calculated the relative risks for specific causes of death for all covari-ates from a data set that combined data from all 3 surveys (Table 2). We then applied each set of cause-specific rela-tive risks from a given age group to the current distribution of the covariates (BMI group and all other covariates) in that age group in the general popula-tion, as estimated from the NHANES 1999-2002 cross-sectional survey data; for these purposes, non-Hispanic whites and blacks were categorized as white and black. Race was assessed by obser-vation in NHANES I and II and by par-ticipant self-report in NHANES III and NHANES 1999-2002.
As described previously,1we calcu-lated cause-specific attributable frac-tions for each BMI category by com-paring the estimated risks from the current distribution of covariates with the estimated risks with BMI category set to normal weight, holding all else constant. The estimated number of ex-cess deaths for each cause was then cal-culated by multiplying the total num-ber of deaths in that age group in 2004 by the corresponding attributable frac-tion and summing over age. Standard errors were calculated by applying a delta method for complex sample
de-signs that takes into account uncertain-ties in the relative risks for BMI catego-ries, the distribution of BMI, the distribution of covariates, and the es-timated effects of covariates, as well as the added variability due to the com-plex sample designs of the NHANES surveys.16-18
Secondary analyses examining sub-groups of mortality categories were per-formed by dividing the major mortal-ity categories into finer groupings. The sum of the estimated excess deaths from these secondary analyses differs slightly from the estimated excess deaths in the Table 1.Cause of Death and Number of Deaths Among US Adults 25 Years and Older in 2004 by Specified Cause
Cause of Death
Corresponding Numbers From 113-Causes-of-Death Lista
No. (%) of Deaths of Persons
in 2004, Agedⱖ25 y
CVD 53-74 858 723 (36.9)
Coronary heart disease 58-63 451 161 (19.4) Other CVD 55-57, 64-74 407 562 (17.5)
Cancer 19-43 550 687 (23.7)
Lung cancer 27 158 058 (6.8)
Considered obesity-relatedb 21, 23, 25, 29, 31, 32, 34 173 717 (7.5) All other cancers All other numbers within cancer
category
218 912 (9.4)
Noncancer, non-CVD disease All other numbers 915 229 (39.4) Diabetes and kidney disease 46, 97-113 115 115 (5.0) Chronic respiratory disease 82-86 121 605 (5.2) Acute respiratory and infectious disease 1-18, 76-81, 87-89 167 057 (7.2)
Injuries 112-135 137 640 (5.9)
Miscellaneous All other numbers within noncancer, non-CVD categories
373 812 (16.1)
Total 2 324 639 (100)
Abbreviation: CVD, cardiovascular disease.
aBased on Anderson et al.4
bColon cancer, breast cancer, esophageal cancer, uterine cancer, ovarian cancer, kidney cancer, and pancreatic cancer.
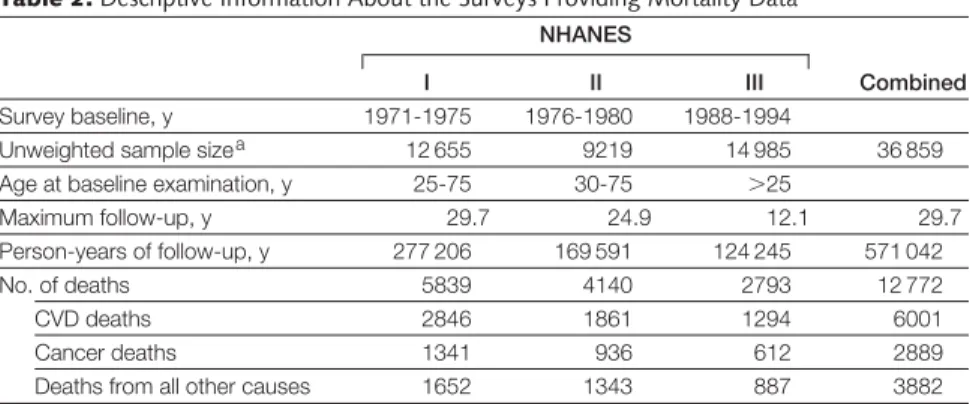
Table 2.Descriptive Information About the Surveys Providing Mortality Data NHANES
Combined
I II III
Survey baseline, y 1971-1975 1976-1980 1988-1994
Unweighted sample sizea 12 655 9219 14 985 36 859 Age at baseline examination, y 25-75 30-75 ⬎25
Maximum follow-up, y 29.7 24.9 12.1 29.7 Person-years of follow-up, y 277 206 169 591 124 245 571 042 No. of deaths 5839 4140 2793 12 772
CVD deaths 2846 1861 1294 6001
Cancer deaths 1341 936 612 2889
Deaths from all other causes 1652 1343 887 3882
Abbreviations: CVD, cardiovascular disease; NHANES, National Health and Nutrition Examination Survey.
aAfter exclusions for missing body mass index data.
whole category because they are de-rived from separately fitting different proportional hazard regressions, but the differences are small.
Estimates were made from the combined data to obtain more preci-sion and to represent the US popula-tion over the more than 2 decades (1971-1994) covered by the baseline years of these surveys. Several issues arise in combining the surveys. For the present analyses, follow-up through 2000 was available for all surveys. As a result, NHANES I had more than 29 years of follow-up, NHANES II had more than 24 years of follow-up, and NHANES III had slightly more than 12 years of follow-up. Accordingly, the number of deaths contributed by the earlier sur-veys is larger than the number con-tributed by NHANES III.
One approach is to combine all data for all surveys, which gives the most weight to NHANES I, with its higher number of deaths. Another is to hold follow-up roughly constant across sur-veys. Willett et al1 9 have recom-mended that for studies of weight and mortality follow-up should not con-tinue more than 10 or 15 years with-out remeasurement to limit weight mis-classification. We report results from both approaches, using roughly bal-anced follow-up by limiting follow-up to no more than 15 years for each sur-vey,balanced follow-up, or using all fol-low-up data for all surveys,total follow-up. Both approaches give less emphasis to the most recent data, since NHANES III has less than 15 years of follow-up and the fewest number of deaths.
Data were analyzed using the SAS System for Windows (Release 9.1) (SAS Institute Inc, Cary, North Caro-lina) and Research Triangle Institute’s SUDAAN (Release 9.0) software pro-grams (RTI International, Research Triangle Park, North Carolina). All analyses included sample weights that account for the varying probabilities of selection due to sampling and non-response. NHANES III and NHANES 1999-2002 underwent institutional review board approval and included
written informed consent. Institu-tional review board approval using current standards was not obtained for NHANES I or NHANES II, but internal human subject review was conducted. Estimates were considered significantly different from 0 if the 95% confidence interval (CI) did not include 0.
RESULTS
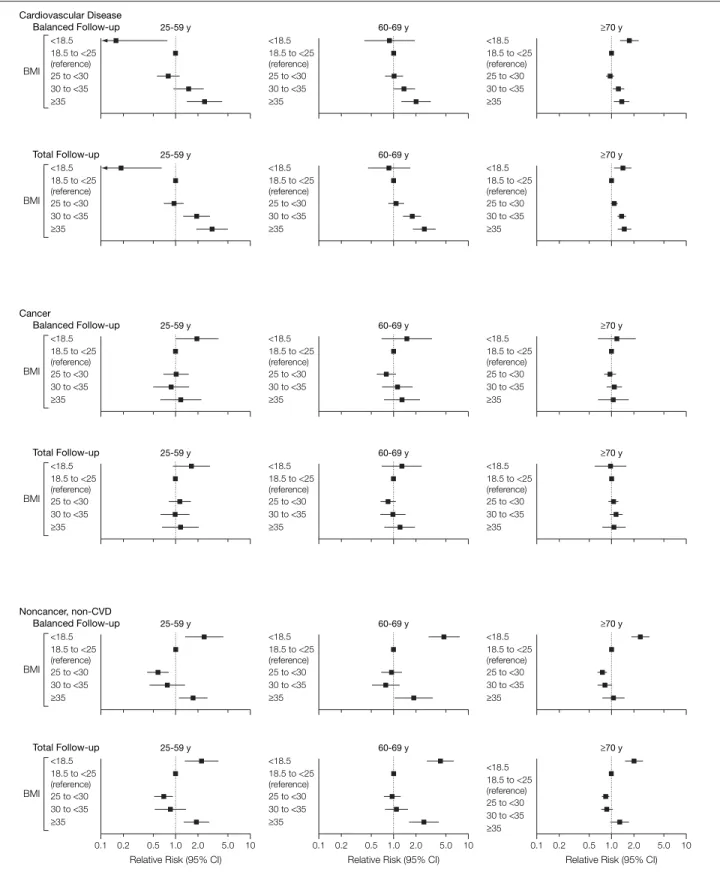
Cause-specific relative risks and 95% CIs for balanced and total follow-up are shown in FIGURE 1. The esti-mated numbers of excess deaths and 95% CIs by BMI category for CVD, cancer, and noncancer, non-CVD causes are shown in TABLE 3. The excess deaths from Table 3 expressed as a percentage of total deaths from the corresponding cause are shown in TABLE 4. For example, the 8674
excess CVD deaths associated with underweight shown in Table 3 repre-sent 1% of the total 858 723 deaths from CVD in the United States that is shown in Table 1.
CVD Mortality
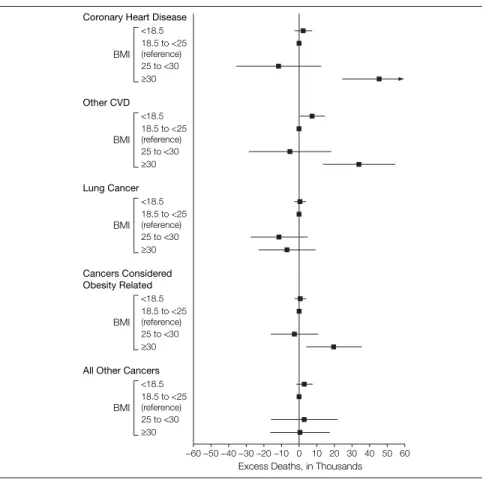
For CVD, obesity, but not overweight, was significantly positively associated with excess mortality (Table 3). In secondary analyses, deaths due to CVD were subdivided into deaths from coronary heart disease (CHD) and deaths from other cardiovascular causes (including stroke). Estimates of excess deaths with balanced follow-up are shown in FIGURE 2 for these 2 subgroups. In balanced follow-up, obesity was associated with signifi-cantly increased mortality from both CHD (45 544 excess deaths; 95% CI, 24 785-66 303) and other forms of CVD (34 097 excess deaths; 95% CI; 13 848-54 346). Estimates from total follow-up were somewhat higher (CHD, 66 572 excess deaths; 95% CI, 50 582-82 562; other CVD, 42 650 excess deaths; 95% CI, 24 888-60 413). Neither underweight nor overweight was associated with sig-nificantly increased or reduced mor-tality from CHD or from other forms of CVD.
Cancer Mortality
For cancer, there was no significant as-sociation of excess mortality with any BMI category with either type of fol-low-up (Table 3). To investigate fur-ther, we subdivided cancer deaths into 3 subgroups: deaths from lung cancer, deaths from cancers considered in the literature to be obesity related (colon, breast, esophageal, uterine, ovarian, kidney, and pancreatic cancer), and deaths from all other cancers. Esti-mates of excess deaths with balanced follow-up are shown in Figure 2 for each of these 3 subgroups.
Lung cancer deaths showed no sig-nificant association with any BMI cat-egory; overweight and obesity were as-sociated with a nonsignificantly reduced number of lung cancer deaths. Overall, obesity was associated with a signifi-cantly increased number of deaths from cancers considered obesity related, 19 732 excess deaths (95% CI, 4166-35 299), representing 11.4% of deaths from obesity-related cancers. With total follow-up, estimates were slightly lower (13 839 excess deaths; 95% CI, 1920-25 758). Overweight was not associ-ated with excess deaths from cancers considered obesity related (Figure 2). Deaths from all other cancers had no re-lation with BMI (Figure 2).
Noncancer, Non-CVD Mortality For noncancer, non-CVD mortality, un-derweight was associated with a sig-nificantly positive number of excess deaths and overweight with a signifi-cantly negative number of excess deaths (Table 3). Obesity was not associated with any significant positive or nega-tive excess noncancer, non-CVD mortality.
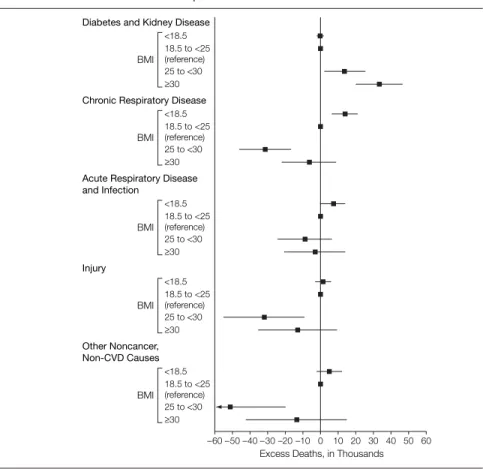
To investigate further, we divided noncancer, non-CVD deaths into 5 sub-groups: (1) diabetes and kidney dis-ease; (2) chronic respiratory disease, in-cluding bronchitis and emphysema; (3) acute respiratory and infectious dis-ease, including pneumonia, tuberculo-sis, septicemia, and other infections; (4) injuries, including unintentional inju-ries, suicides, and homicides; (5) all other noncancer, non-CVD causes,
Figure 1.Cause-Specific Relative Risks by Age Group and Body Mass Index Category for Balanced and Total Follow-up Cardiovascular Disease Balanced Follow-up 25-59 y <18.5 ≥35 18.5 to <25 (reference) 25 to <30 30 to <35 Total Follow-up 25-59 y <18.5 ≥35 18.5 to <25 (reference) 25 to <30 30 to <35 60-69 y <18.5 ≥35 18.5 to <25 (reference) 25 to <30 30 to <35 60-69 y <18.5 ≥35 18.5 to <25 (reference) 25 to <30 30 to <35 ≥70 y <18.5 ≥35 18.5 to <25 (reference) 25 to <30 30 to <35 <18.5 ≥35 18.5 to <25 (reference) 25 to <30 30 to <35 ≥70 y BMI BMI <18.5 ≥35 18.5 to <25 (reference) 25 to <30 30 to <35 Cancer Balanced Follow-up 25-59 y Total Follow-up 25-59 y <18.5 ≥35 18.5 to <25 (reference) 25 to <30 30 to <35 60-69 y <18.5 ≥35 18.5 to <25 (reference) 25 to <30 30 to <35 60-69 y <18.5 ≥35 18.5 to <25 (reference) 25 to <30 30 to <35 <18.5 ≥35 18.5 to <25 (reference) 25 to <30 30 to <35 <18.5 ≥35 18.5 to <25 (reference) 25 to <30 30 to <35 ≥70 y ≥70 y BMI BMI Noncancer, non-CVD Balanced Follow-up 25-59 y <18.5 ≥35 18.5 to <25 (reference) 25 to <30 30 to <35 Total Follow-up 25-59 y <18.5 ≥35 18.5 to <25 (reference) 25 to <30 30 to <35 60-69 y <18.5 ≥35 18.5 to <25 (reference) 25 to <30 30 to <35 60-69 y <18.5 ≥35 18.5 to <25 (reference) 25 to <30 30 to <35 <18.5 ≥35 18.5 to <25 (reference) 25 to <30 30 to <35 <18.5 ≥35 18.5 to <25 (reference) 25 to <30 30 to <35 ≥70 y ≥70 y 10 1.0 0.5 0.1
Relative Risk (95% CI)
0.2 2.0 5.0 0.1 0.5 1.0 10
Relative Risk (95% CI)
0.2 2.0 5.0 0.1 0.5 1.0 10
Relative Risk (95% CI)
0.2 2.0 5.0
BMI
BMI
BMI indicates body mass index which is calculated as weight in kilograms divided by height in meters squared; CI, confidence interval (shown by error bars); CVD, cardiovascular disease.
including Alzheimer disease, Parkin-son disease, liver disease, and any other noncancer, non-CVD causes not fall-ing into the 4 categories above, includ-ing 303 deaths with no cause attrib-uted. Diabetes and kidney disease were grouped together because there were too few diabetes deaths in the youngest age group to make acceptably precise esti-mates and because diabetes is an impor-tant cause of end-stage renal disease.
Balanced follow-up results are shown inFIGURE3. Diabetes and kidney dis-ease combined were associated with sig-nificantly increased mortality in over-weight (13 904 excess deaths; 95% CI, 2534-25 273) and obesity (33 643 ex-cess deaths; 95% CI, 20 640-46 645) categories. Results were higher with total follow-up (overweight, 15 872 ex-cess deaths; 95% CI, 7973-23 772; obe-sity, 45 376 excess deaths; 95% CI, 35 532-55 219).
Ineachoftheother4subgroupsofnon-cancer, non-CVD deaths, overweight was associatedwithreducedmortality,andthis association was statistically significant ex-cept for acute respiratory and infectious disease (Figure 3). Overall, obesity was not associated with noncancer, non-CVD mortality. However, for each of these 4 subgroups of noncancer, non-CVD deaths, grade 1 obesity tended to be as-sociatedwithreducedmortalityandgrades 2 and 3 obesity with increased mortality. We then combined all 4 of these sub-groups of noncancer, non-CVD deaths and found significantly reduced mortal-ity among overweight (−89 680 deaths;
95% CI, −122 901 to −56 458) and grade 1 obesity (−39 595 deaths; 95% CI, −61 807 to −17 382) and significantly in-creased mortality among grades 2 and 3 obesity (23 702 deaths; 95% CI, 1736 to 45 669) with total follow-up. Overall, overweight and obesity combined were associated with increased mortality from diabetes and kidney disease combined (61 248 excess deaths; 95% CI, 49 685 to 72 811) and decreased mortality from other noncancer, non-CVD causes (−105 572 excess deaths; 95% CI, −161 816 to −49 328). With balanced follow-up, all estimates were lower than with total follow-up (diabetes and kidney disease combined: 47 546 excess deaths; 95% CI, 29 356-65 737; other noncancer, non-CVDcauses:−133 310excessdeaths; 95% CI, −212 272 to −54 348).
Trends Over Surveys and Length of Follow-up
Cause-specific estimates of excess deaths associated with obesity were calculated using survey-specific relative risks (FIGURE4). Because relative risks were applied to the NHANES 1999-2002 dis-tribution of covariates, these esti-mates of excess deaths are not affected by differences between surveys in the prevalence of smoking and of other co-variates. All-cause specific estimates were higher when using the NHANES I relative risks than when using the rela-tive risks from the other surveys.
The major difference was for CVD mortality. Estimates for 2004 using NHANES I relative risks indicated that
161 290 excess CVD deaths (95% CI, 123 788 to 198 791) were associated with obesity, representing 19% of all CVD deaths. The estimate for 2004 using the NHANES II relative risks was 88 657 excess CVD deaths (95% CI, 51 151 to 126 164), representing 10% of all CVD deaths, and using the NHANES III relative risks was 46 915 excess CVD deaths (95% CI, −5694 to 99 524), representing 5% of all CVD deaths. The higher estimates using NHANES I were not due to the longer follow-up in that survey because ex-cess CVD mortality associated with obe-sity in NHANES I varied little by length of follow-up (15 years, 155 955 excess deaths; 95% CI, 103 844 to 208 065; 20 years, 168 383 excess deaths; 95% CI, 127 689 to 209 077; 25 years, 158 647 excess deaths; 95% CI, 119 053 to 198 242). Overweight was not signifi-cantly associated with positive excess CVD, cancer, or noncancer, non-CVD mortality based on any of the survey-specific or combined relative risks. Sensitivity Analyses
To address the issue of potential con-founding by illness-induced weight loss or smoking, sensitivity analyses for the major categories were conducted by si-multaneously limiting the sample to never smokers without a history of the relevant disease (CVD, cancer, or chronic obstructive pulmonary dis-ease) at baseline whose weight and height were measured before age 70 years and who did not die within the Table 3.Estimated Number of Excess Deaths in the United States in 2004 Associated With Body Mass Index Levels, Based on the Combined NHANES I, II, and III Data Set
Cause of Death
Excess Deaths (95% Confidence Interval) Underweight (BMI⬍18.5) Normal Weight (BMI 18.5-⬍25) Overweight (BMI 25-⬍30) Obesity (BMIⱖ30) Balanced follow-up CVD 8674 (343 to 17 004) 0 [Reference] −17 074 (−50 407 to 16 259) 81 072 (51 433 to 110 710) Cancer 4144 (−1956 to 10 244) 0 [Reference] −13 533 (−44 364 to 17 298) 14 930 (−13 721 to 43 582) Noncancer, non-CVD 33 380 (17 435 to 49 326) 0 [Reference] −107 674 (−148 738 to −66 610) −560 (−41 201 to 40 081) Total follow-up
CVD 4097 (−1451 to 9645) 0 [Reference] 20 724 (−6092 to 47 540) 112 159 (87 842 to 136 476) Cancer 1548 (−2451 to 5547) 0 [Reference] 6780 (−18 418 to 31 977) 15 252 (−7946 to 38 451) Noncancer, non-CVD 23 455 (11 848 to 35 061) 0 [Reference] −69 299 (−100 702 to −37 897) 35 594 (−1287 to 72 476)
Abbreviations: BMI, body mass index, which is calculated as weight in kilograms divided by height in meters squared. CVD, cardiovascular disease; NHANES, National Health and Nutrition Examination Survey.
first 3 years of follow-up. We used the BMI hazard ratios from this subgroup combined with hazard ratios from the full sample for other covariates to cal-culate a set of synthetic attributable frac-tions. This method isolates the effect on estimates of excess deaths for the whole population of the BMI hazard ratios in a selected subgroup while keeping the estimated risks for smoking and other covariates constant. These are sensitiv-ity analyses and not estimates of attrib-utable fractions either for the whole US population or for the selected subgroup. For CVD mortality, with balanced follow-up, these exclusions reduced the attributable fractions for obesity and in-creased the attributable fraction for un-derweight. The attributable fraction for overweight became more negative. With total follow-up, changes were less than 1 percentagepointforanyBMIcategory,and the attributable fraction for underweight decreased from 0.5% to −0.3%.
For cancer mortality, with balanced follow-up, all attributable fractions were closer to 0 after the exclusions. With total follow-up, the attributable frac-tion for obesity increased from 2.8% to 4.8%, and attributable fractions for other BMI categories became closer to 0 after the exclusions.
For noncancer, non-CVD mortal-ity, the attributable fraction for under-weight became closer to 0 and for over-weight increased from −11.8% to −7.7% for balanced follow-up or from −7.6% to −5.2% for total follow-up after ex-clusions. For obesity, the attributable fraction increased from −0.1% to 6.4% for balanced follow-up and from 3.9% to 7.4% for total follow-up.
COMMENT
We estimated the association of specific causes of mortality with BMI categories. Foreachcause,weestimatedexcessdeaths in each BMI category, defined as deaths in 2004 in excess of those expected based on individuals of normal weight (BMI 18.5-⬍ 25).Thisapproachprovidesamet-ric that can be summed over age groups while still allowing for variation in rela-tive risks by age. It uses age-specific in-formation on the prevalence of BMI
cat-egories and the population occurrence of specific causes of death, combined with relative risk information, to estimate the population-levelburdenofBMI-associated mortality, which cannot be assessed from relative risk estimates alone.
CVD Mortality
Cardiovascular disease accounted for 37% of adult deaths in the United States in 2004. Based on total follow-up, we found that 13% of total CVD mortality was associated with obesity (BMIⱖ30); Table 4.Excess Deaths as a Percentage of All Deaths from Specified Cause in the United States in 2004 Associated With Body Mass Index Levels, Based on the Combined NHANES I, II, and III Data Set
Cause of Death
Excess Deaths as Percentage of Specified Cause (95% Confidence Interval) Underweight (BMI⬍18.5) Normal Weight (BMI 18.5-⬍25) Overweight (BMI 25-⬍30) Obesity (BMIⱖ30) Balanced follow-up CVD 1.0 (0.0 to 2.0) 0 [Reference] −2.0 (−5.9 to 1.9) 9.4 (6.0 to 12.9) Cancer 0.8 (−0.4 to 1.9) 0 [Reference] −2.5 (−8.1 to 3.1) 2.7 (−2.5 to 7.9) Noncancer, non-CVD 3.6 (1.9 to 5.4) 0 [Reference] −11.8 (−16.3 to −7.3) −0.1 (−4.5 to 4.4) Total follow-up
CVD 0.5 (−0.2 to 1.1) 0 [Reference] 2.4 (−0.7 to 5.5) 13.1 (10.2 to 15.9) Cancer 0.3 (−0.4 to 1.0) 0 [Reference] 1.2 (−3.3 to 5.8) 2.8 (−1.4 to 7.0) Noncancer, non-CVD 2.6 (1.3 to 3.8) 0 [Reference] −7.6 (−11.0 to −4.1) 3.9 (−0.1 to 7.9)
Abbreviations: BMI, body mass index, which is calculated as weight in kilograms divided by height in meters squared; CVD, cardiovascular disease; NHANES, National Health and Nutrition Examination Survey.
Figure 2.Excess Deaths by Body Mass Index Category for Subgroups of Cardiovascular Disease and Cancer Deaths—Balanced Follow-up
–40 –30 –20
–60 –50 –10 0 10 20 30 40 50 60
Excess Deaths, in Thousands
<18.5
≥30 18.5 to <25 (reference) 25 to <30
Coronary Heart Disease
BMI Other CVD <18.5 ≥30 18.5 to <25 (reference) 25 to <30 BMI Lung Cancer <18.5 ≥30 18.5 to <25 (reference) 25 to <30 BMI Cancers Considered Obesity Related <18.5 ≥30 18.5 to <25 (reference) 25 to <30 BMI
All Other Cancers
<18.5 ≥30 18.5 to <25 (reference) 25 to <30 BMI
BMI, body mass index, which is calculated as weight in kilograms divided by height in meters squared; CVD, car-diovascular disease. Error bars indicate 95% confidence intervals.
when balanced follow-up was used, giv-ing less weight to the earlier data, our estimate was 9%. We found no signifi-cant association of overweight with CVD mortality. Simultaneously
exclud-ing participants who reported a his-tory of CVD, had ever smoked, died in the first 3 years of follow-up, or were measured after age 70 years had only small and nonsystematic effects on these
estimates. Thus, there was no indica-tion that our results were biased by ill-ness-induced weight loss prior to base-line (“reverse causation”) or residual confounding due to smoking.
Direct comparison of our results with other studies is difficult because studies use different BMI categories and refer-ent groups and many lack measured heights and weights. Our attributable fraction estimates are somewhat higher than those from the Framingham Heart Study. Wilson et al20used the Framing-ham data to estimate that relative to nor-mal weight (BMI 18.5-⬍25), obesity
(BMI ⱖ30) accounted for 0.0%
of CVD deaths in men and 10% of CVD deaths in women. In the Framingham study, relative to normal weight, over-weight (BMI 25-⬍30) accounted for 2% of CVD deaths in men and −9% of CVD deaths in women, consistent with our finding of no significant association between overweight and CVD mortality. Several recent studies20-23that used measured heights and weights and the same normal weight range as the refer-ent BMI category used in our study found that CVD mortality had little relation to overweight with hazard ratios ranging between 0.9 and 1.1. Body mass index categories of 30 or higher, however, showed hazard ratios typically in the range of 1.4 to 1.8, similar to those ob-served in our study. Similar results were also found in a pooled analysis of 26 data sets with measured or self-reported heights and weights.24
Cancer Mortality
Cancer accounted for approximately 24% of total deaths among US adults in 2004. Our results showed little or no association of excess all-cancer mor-tality with any of the BMI categories. None of the estimates of excess deaths was statistically significantly different from 0. Simultaneously excluding par-ticipants who reported a history of can-cer, had ever smoked, died in the first 3 years of follow-up, or were mea-sured after age 70 years had only small and unsystematic effects on these esti-mates; thus, there was no apparent bias due to illness-induced weight loss prior Figure 3.Excess Deaths by Body Mass Index Category for Subgroups of Noncancer,
non-CVD Deaths—Balanced Follow-up
–40 –30 –20
–60 –50 –10 0 10 20 30 40 50 60
Excess Deaths, in Thousands
<18.5
≥30 18.5 to <25 (reference) 25 to <30
Diabetes and Kidney Disease
BMI
Chronic Respiratory Disease
<18.5 ≥30 18.5 to <25 (reference) 25 to <30 BMI
Acute Respiratory Disease and Infection <18.5 ≥30 18.5 to <25 (reference) 25 to <30 BMI Injury <18.5 ≥30 18.5 to <25 (reference) 25 to <30 BMI Other Noncancer, Non-CVD Causes <18.5 ≥30 18.5 to <25 (reference) 25 to <30 BMI
BMI, body mass index, which is calculated as weight in kilograms divided by height in meters squared; CVD, cardiovascular disease. Error bars represent 95% confidence intervals.
Figure 4.Cause-Specific Excess Deaths Associated With Obesity by Survey—Total Follow-up
–100 –50 0 50 100 150 200
Excess Deaths, in Thousands
Noncancer, Non-CVD NHANES I NHANES III NHANES II Cancer NHANES I NHANES III NHANES II Cardiovascular Disease NHANES I NHANES III NHANES II
NHANES indicates National Health and Nutrition Examination Survey; CVD, cardiovascular disease. Error bars represent 95% confidence intervals.
to baseline or residual confounding by smoking.
We divided cancers into lung can-cer (29% of cancan-cer deaths among adults in the United States), cancers consid-ered in the literature to be associated with obesity (32% of cancer deaths), and other cancers (40% of cancer deaths). We found that obesity was sig-nificantly associated with 11% of deaths from cancers considered to be obesity-related. Mortality from lung cancer and other cancers showed no significant as-sociation with underweight, over-weight, or obesity.
Our findings about cancer mortality are consistent with several recent re-ports. Danaei et al25estimated that 3% of cancer mortality in developed coun-tries was associated with overweight and obesity. Ni Mhurchu et al,26using a years-of-life-lost approach, estimated that 4% of cancer mortality in New Zealand was associated with having a BMI higher than 21. Kuriyama27found that 4.5% of can-cer deaths in Japanese women and −0.2% in Japanese men were associated with overweight and obesity. Calle et al28 found significantly reduced cancer mor-tality in the overweight category for men in the large Cancer Prevention Study II cohort, based on self-reported heights and weights. Calle et al28estimated that 4.3% of cancer deaths among men and 14.3% of cancer deaths among women in the United States were associated with obesity, although their attributable frac-tion estimates were not fully adjusted for the covariates in their models.29Our find-ing of nonsignificant relative risks of all-cancer mortality among overweight and obese individuals is in agreement with a number of other studies.21,30-36In ad-dition, relative incidence rates for all can-cer tend to be null or small for the over-weight category and modestly elevated for categories of obesity,28,37consistent with our results.
Noncancer, non-CVD Mortality Noncancer, non-CVD deaths ac-counted for approximately 39% of total deaths among adults in 2004. Although noncancer, non-CVD causes make up a substantial portion of adult mortality,
they are often not considered to be weight-related. However, we found that these other deaths were significantly el-evated in the BMI category of under-weight, were significantly reduced in the BMI category of overweight, showed a negative or null association with obe-sity grade 1, and showed a modest sig-nificantly positive association with obe-sity grades 2 and 3. Several other studies have reported similar results. The large Cancer Prevention Study II study showed an inverse or null relation between BMI and noncancer, non-CVD mortality among never smokers who were healthy at baseline, up to a BMI of approxi-mately 32 for men and 28 for women.38 The British Regional Heart Study of men found a statistically significant inverse re-lation between BMI and noncancer, non-CVD mortality.39
Combined diabetes and kidney dis-ease mortality, however, was signifi-cantly positively associated with in-c r e a s e d m o r t a l i t y i n b o t h t h e overweight and obese categories. The other 4 subgroups of noncancer, non-CVD causes (chronic respiratory dis-ease, acute respiratory and infectious disease, injuries, and miscellaneous causes) showed significantly de-creased mortality in the overweight and grade 1 obesity categories and signifi-cantly increased mortality in the obe-sity grades 2 and 3 category.
Excess Mortality by BMI Categories It has been suggested that excess mor-tality in the underweight is due to weight loss associated with cancer or cardiovascular disease.40Our results, however, as well as those of Jee et al,41 He et al,42and others, suggest that ex-cess mortality among the under-weight is primarily associated with non-cancer, non-CVD causes and not with cancer or cardiovascular disease. Jee et al41found significantly increased mor-tality from respiratory causes (includ-ing tuberculosis, chronic obstructive pulmonary disease, asthma, and pneu-monia) with decreasing BMI in a large Korean cohort; this inverse associa-tion was seen both in smokers and in nonsmokers and persisted when the
first 5 years of deaths were excluded. He et al42found that underweight was associated with increased mortality even after the simultaneous exclusion of ever-smokers or those with cancer, CVD, chronic obstructive pulmonary disease, or end-stage renal disease at baseline and those who died within the first 3 years of follow-up. In our re-sults, excess mortality among the un-derweight was primarily related to chronic respiratory conditions, as oth-ers have found.32,33,41This finding may be partly due to weight loss associated with chronic obstructive pulmonary disease, although among such pa-tients, low BMI has also been shown to be a risk factor for mortality indepen-dently of disease severity.41,43-45
The primary contribution to excess mortality among the obese was CVD, with smaller contributions from obe-sity-related cancers and from diabetes and kidney disease combined. Com-parisons across surveys suggested a de-crease in the association of obesity with CVD mortality over time. This finding is consistent with a number of popu-lation trends. National mortality data for 2004 showed a decrease in age-adjusted death rates to a historically low figure.3Age-adjusted CVD mortality rates have been decreasing over the pre-vious 4 decades.3The prevalence of sev-eral CVD risk factors has decreased at all weight levels.46
Some evidence suggests that mod-estly higher weights may improve sur-vival in a number of circumstances,47-52 which may partly explain our findings regarding overweight. Overweight is not strongly associated with increased can-cer or CVD risk, but may be associ-ated with improved survival during re-covery from adverse conditions, such as infections or medical procedures, and with improved prognosis for some dis-eases. Such findings may be due to greater nutritional reserves or higher lean body mass associated with overweight.
Some limitations of our study should be noted. The results depend on pro-jecting the experience of past cohorts onto the present, which may be
curate. The underlying cause of death may be misidentified on death certifi-cates. In particular, diabetes may be underreported as an underlying cause. One study showed that only 39% of the death certificates of individuals with diabetes who died of CVD mentioned diabetes.53This misclassification could lead to underestimating the excess obe-sity-associated deaths for diabetes as the underlying cause and overestimating the excess obesity-associated deaths for CVD as the underlying cause. The es-timates reported herein are for statis-tical associations of BMI with mortal-ity. A variety of other factors associated with both weight and mortality, how-ever, such as physical activity levels, body composition, and differences in medical treatment by weight, could be responsible for part or all of the ob-served associations.54Our study does not address the association of BMI lev-els with risk factors such as hyperten-sion or dyslipidemia nor with disease incidence or morbidity. In addition, our study does not address potential ef-fects of weight loss or gain on associa-tions between BMI and mortality.
Although it is desirable to use the ex-perience of recent cohorts, doing so lim-its the follow-up time. The experience of cohorts with long follow-up may not reflect current conditions, however. Over a long follow-up, baseline values of BMI or other covariates may change considerably. For example, as fol-low-up lengthens, individuals who were overweight at baseline may move into the obese category and acquire the higher risks more characteristic of the obese category but would still be clas-sified as overweight rather than obese in the analysis. Such changes could dis-tort the apparent risk associated with overweight. Thus inaccuracies might be introduced either by including data from less recent cohorts with long fol-low-up or by including data from a more recent cohort with shorter follow-up. We found little or no change with increasing follow-up in estimated cause-specific excess deaths associated with obesity. When similar lengths of fol-low-up were used for each survey,
es-timates were slightly lower, in part be-cause of an apparently weaker obesity-CVD mortality association in more recent surveys. Estimates for total fol-low-up thus tended to be higher than those for balanced follow-up, not cause follow-up was longer but be-cause they gave more weight to the ear-lier surveys, particularly NHANES I, in which the association of obesity with mortality was stronger.
Many factors influence mortality risk in addition to weight. Some variability among studies in estimates of associa-tion between BMI and all-cause mor-tality may reflect differences in age, sex, and other risk factors, apart from BMI, including secular effects on studies con-ducted at different times. The relative proportions of different causes of death in various cohorts can also influence this association. Study exclusions de-signed to control confounding may al-ter the observed BMI-mortality asso-ciation by changing the relative proportions of different causes of death.55The associations of BMI with all-cause mortality represent the net effect of a variety of associations that vary by cause of death. Understanding these cause-specific associations helps interpret our previous findings for all-cause mortality1and may help explain differing associations between BMI and all-cause mortality found in the litera-ture.
CONCLUSIONS
We found that underweight was asso-ciated with increased mortality, pri-marily from noncancer, non-CVD causes. Overweight was associated with significantly increased mortality from diabetes and kidney disease com-bined; was associated with signifi-cantly decreased mortality from other noncancer, non-CVD causes; and was not associated with mortality from can-cer or cardiovascular disease. The net result was that overweight was associ-ated with significantly decreased all-cause mortality overall. Obesity was as-sociated with significantly increased mortality from CVD, from some can-cers, and from diabetes and kidney
dis-ease combined but showed little or no association with other cancers and with other causes of death. Obesity also was associated with increased mortality overall, primarily due to its associa-tion with CVD mortality. Thus, our data indicate that the association of BMI with mortality varies considerably by cause of death. These results help to clarify our earlier findings1of excess overall mortality associated with under-weight and obesity but not with over-weight.
Author Contributions:Dr Flegal had full access to all of the data in the study and takes responsibility for the integrity of the data and the accuracy of the data analysis.
Study concept and design:Flegal, Graubard,
Williamson, Gail.
Acquisition of data:Flegal, Graubard.
Analysis and interpretation of data:Flegal, Graubard,
Williamson, Gail.
Drafting of the manuscript:Flegal, Graubard,
Williamson, Gail.
Critical revision of the manuscript for important
in-tellectual content:Flegal, Graubard, Williamson, Gail.
Statistical analysis:Graubard, Gail.
Financial Disclosures:None reported.
Funding/Support:There was no external funding for this work.
Role of the Sponsor:All data used in this study were collected by the National Center for Health Statistics (NCHS), Centers for Disease Control and Prevention. The NCHS was responsible for the design and con-duct of the surveys and collected and managed the original data. The Centers for Disease Control and Pre-vention and the National Cancer Institute reviewed and approved this report before submission. Disclaimer:The findings and conclusions in this re-port are those of the authors and not necessarily those of the agency.
Additional Contributions:We thank Christine S. Cox, MA, and Robert N. Anderson, PhD, both of the Na-tional Center for Health Statistics, Centers for Dis-ease Control and Prevention, for her assistance with the NHANES I, II, and III mortality data and for his as-sistance with the 2004 mortality data. We also thank Rachel Ballard-Barbash, MD, and D. Michal Freed-man, PhD, of the National Cancer Institute; Edward Gregg, PhD, and Juliette Kendrick, MD, of the Na-tional Center for Chronic Disease Prevention and Health Promotion, Centers for Disease and Prevention, and Susan Yanovski, MD, of the National Institute for Dia-betes and Digestive and Kidney Diseases for review-ing and commentreview-ing on earlier drafts of the manu-script, all of whom reviewed this as part of their regular duties.
REFERENCES
1.Flegal KM, Graubard BI, Williamson DF, Gail MH. Excess deaths associated with underweight, over-weight, and obesity.JAMA. 2005;293(15):1861-1867.
2.Allison DB, Fontaine KR, Manson JE, Stevens J, Van Itallie TB. Annual deaths attributable to obesity in the United States.JAMA. 1999;282(16):1530-1538. 3.Minin˜o AM, Heron MP, Murphy SL, Kochanek KD. Deaths: final data for 2004.Natl Vital Stat Rep. 2007;55(19):1-120. http://www.cdc.gov/nchs/data /nvsr/nvsr55/nvsr55_19.pdf. Accessed August 30, 2007.
4.Anderson RN, Minino AM, Hoyert DL, Rosenberg HM. Comparability of cause of death betweenICD-9
andICD-10: preliminary estimates.Natl Vital Stat Rep.
2001;49(2):1-32. http://www.cdc.gov/nchs/data /nvsr/nvsr49/nvsr49_02.pdf. Accessed June 17, 2007. 5.National Cancer Institute Fact Sheet. Obesity and cancer: questions and answers. Bethesda, MD: Na-tional Cancer Institute; March 16, 2004. http://www .cancer.gov/cancertopics/factsheet/Risk/obesity. NCI fact sheet 3.70. Accessed February 21, 2007. 6.Miller HW. Plan and operation of the health and nu-trition examination survey: United States–1971-1973.
Vital Health Stat 1. 1973;(10a):1-46.
7.Engel A, Murphy RS, Maurer K, Collins E. Plan and operation of the HANES I augmentation survey of adults 25-74 years United States, 1974-1975.Vital
Health Stat 1. 1978;(14):1-110.
8.McDowell A, Engel A, Massey JT, Maurer K. Plan and operation of the Second National Health and Nu-trition Examination Survey, 1976-1980.Vital Health
Stat 1. 1981;(15):1-144.
9.Plan and operation of the Third National Health and Nutrition Examination Survey, 1988-94. Series 1: pro-grams and collection procedures.Vital Health Stat 1. 1994;(32):1-407.
10.Cohen BB, Barbano HE, Cox CS, et al. Plan and operation of the NHANES I Epidemiologic Followup Study: 1982-84.Vital Health Stat 1. 1987;(22):1-142.
11.Cox CS, Mussolino ME, Rothwell ST, et al. Plan and operation of the NHANES I Epidemiologic Fol-lowup Study, 1992.Vital Health Stat 1. 1997;(35): 1-231.
12.Loria CM, Sempos CT, Vuong C. Plan and op-eration of the NHANES II Mortality Study, 1992.Vital
Health Stat 1. 1999;(38):1-16.
13.Korn EL, Graubard BI, Midthune D. Time-to-event analysis of longitudinal follow-up of a survey: choice of the time-scale.Am J Epidemiol. 1997;145 (1):72-80.
14.National Heart, Lung, and Blood Institute. Clini-cal guidelines on the identification, evaluation, and treatment of overweight and obesity in adults Web page. http://www.nhlbi.nih.gov/guidelines/obesity /ob_home.htm. Accessed October 10, 2007. 15.World Health Organization. Physical status: the use and interpretation of anthropometry. Report of a WHO Expert Committee.World Health Organ Tech
Rep Ser. 1995;854:1-452.
16.Shah BV. Discussion of the paper on “Lineariza-tion variance estimators for survey data.”Surv
Methodol. 2004;30:29.
17.Korn EL, Graubard BI.Analysis of Health Surveys. New York, NY: Wiley; 1999.
18.Graubard BI, Flegal KM, Williamson DF, Gail MH. Estimation of attributable number of deaths and stan-dard errors from simple and complex sampled cohorts.
Stat Med. 2007;26(13):2639-2649.
19.Willett WC, Dietz WH, Colditz GA. Guidelines for healthy weight.N Engl J Med. 1999;341(6):427-434.
20.Wilson PWF, D’Agostino RB, Sullivan L, et al. Over-weight and obesity as determinants of cardiovascu-lar risk.Arch Intern Med. 2002;162(16):1867-1872.
21.Krueger PM. Rogers RG, Hummer RA, et al. Body mass, smoking, and overall and cause-specific mor-tality among older U.S. adults.Res Aging. 2004;26 (1):82-107. http://roa.sagepub.com/cgi/content
/abstract/26/1/82?eaf. Accessed October 10, 2007.
22.Yan LL, Daviglus ML, Liu K, et al. Midlife body mass index and hospitalization and mortality in older age.JAMA. 2006;295(2):190-198.
23.McTigue K, Larson JC, Valoski A, et al. Mortality and cardiac and vascular outcomes in extremely obese women.JAMA. 2006;296(1):79-86.
24.McGee DL; Diverse Populations Collaboration. Body mass index and mortality: a meta-analysis based on person-level data from twenty-six observational studies.Ann Epidemiol. 2005;15(2):87-97. 25.Danaei G, Vander Hoorn S, Lopez AD, Murray CJ, Ezzati M. Comparative Risk Assessment collabo-rating group (Cancers). Causes of cancer in the world: comparative risk assessment of nine behavioural and environmental risk factors.Lancet. 2005;366(9499): 1784-1793.
26.Ni Mhurchu C, Turley M, Stefanogiannis N, et al. Mortality attributable to higher-than-optimal body mass index in New Zealand.Public Health Nutr. 2005; 8(4):402-408.
27. Kuriyama S. Impact of overweight and obesity on medical care costs, all-cause mortality, and the risk of cancer in Japan.J Epidemiol. 2006;16(4):139-144. 28.Calle EE, Rodriguez C, Walker-Thurmond K, Thun MJ. Overweight, obesity, and mortality from cancer in a prospectively studied cohort of US adults.N Engl
J Med. 2003;348(17):1625-1638.
29.Flegal KM, Williamson DF, Graubard BI. Obesity and cancer.N Engl J Med. 2003;349(5):502-504. 30. Lee IM, Manson JE, Hennekens CH, Paffen-barger RS Jr. Body weight and mortality: a 27-year fol-low-up of middle-aged men.JAMA. 1993;270(23): 2823-2828.
31.Seidell JC, Verschuren WM, van Leer EM, Krom-hout D. Overweight, underweight, and mortality: a prospective study of 48 287 men and women.Arch
Intern Med. 1996;156(9):958-963.
32.Baik I, Ascherio A, Rimm EB, et al. Adiposity and mortality in men.Am J Epidemiol. 2000;152(3): 264-271.
33.Thorogood M, Appleby PN, Key TJ, Mann J. Re-lation between body mass index and mortality in an unusually slim cohort.J Epidemiol Community Health. 2003;57(2):130-133.
34.Batty GD, Shipley MJ, Jarrett RJ, Breeze E, Mar-mot MG, Smith GD. Obesity and overweight in rela-tion to organ-specific cancer mortality in London (UK): findings from the original Whitehall study.Int J Obes
(Lond). 2005;29(10):1267-1274.
35.Gu D, He J, Duan X, et al. Body weight and mor-tality among men and women in China.JAMA. 2006; 295(7):776-783.
36.Bender R, Zeeb H, Schwarz M, Jockel KH, Berger M. Causes of death in obesity: relevant increase in car-diovascular but not in all-cancer mortality.J Clin
Epidemiol. 2006;59(10):1064-1071.
37.Samanic C, Chow WH, Gridley G, Jarvholm B, Frau-meni JF Jr. Relation of body mass index to cancer risk in 362 552 Swedish men.Cancer Causes Control. 2006; 17(7):901-909.
38.Calle EE, Thun MJ, Petrelli JM, Rodriguez C, Heath CW Jr. Body-mass index and mortality in a prospec-tive cohort of US adults.N Engl J Med. 1999;341 (15):1097-1105.
39.Shaper AG, Wannamethee SG, Walker M. Body weight: implications for the prevention of coronary heart disease, stroke, and diabetes mellitus in a
co-hort study of middle aged men.BMJ. 1997;314(7090): 1311-1329.
40.Hu FB, Willett WC, Stampfer MJ, Spiegelman D, Colditz GA. Calculating deaths attributable to obesity.
Am J Public Health. 2005;95(6):932.
41.Jee SH, Sull JW, Park J, et al. Body-mass index and mortality in Korean men and women.N Engl J Med. 2006;355(8):779-787.
42.He J, Gu D, Wu X, et al. Major causes of death among men and women in China.N Engl J Med. 2005; 353(11):1124-1134.
43.Martinez FJ, Foster G, Curtis JL, et al; NETT Re-search Group. Predictors of mortality in patients with emphysema and severe airflow obstruction.Am J Respir
Crit Care Med. 2006;173(12):1326-1334.
44.Landbo C, Prescott E, Lange P, Vestbo J, Almdal TP. Prognostic value of nutritional status in chronic ob-structive pulmonary disease.Am J Respir Crit Care Med. 1999;160(6):1856-1861.
45.Celli BR, Cote CG, Marin JM, et al. The body-mass index, airflow obstruction, dyspnea, and exer-cise capacity index in chronic obstructive pulmonary disease.N Engl J Med. 2004;350(10):1005-1012. 46.Gregg EW, Cheng YJ, Cadwell BL, et al. Secular trends in cardiovascular disease risk factors accord-ing to body mass index in US adults [published cor-rection appears inJAMA. 2005;294:182].JAMA. 2005; 293(15):1868-1874.
47. Romero-Corral A, Montori VM, Somers VK, et al. Association of bodyweight with total mortality and with cardiovascular events in coronary artery disease: a sys-tematic review of cohort studies.Lancet. 2006;368 (9536):666-678.
48.O’Brien JM Jr, Phillips GS, Ali NA, Lucarelli M, Marsh CB, Lemeshow S. Body mass index is indepen-dently associated with hospital mortality in mechani-cally ventilated adults with acute lung injury.Crit Care Med. 2006;34(3):738-744.
49.Tremblay A, Bandi V. Impact of body mass index on outcomes following critical care.Chest. 2003; 123(4):1202-1207.
50.Curtis JP, Selter JG, Wang Y, et al. The obesity paradox: body mass index and outcomes in patients with heart failure.Arch Intern Med. 2005;165(1): 55-61.
51.Fonarow GC, Srikanthan P, Costanzo MR, Cin-tron GB, Lopatin M; ADHERE Scientific Advisory Com-mittee and Investigators. An obesity paradox in acute heart failure: analysis of body mass index and inhos-pital mortality for 108 927 patients in the Acute De-compensated Heart Failure National Registry.Am Heart J. 2007;153(1):74-81.
52.Garrouste-Orgeas M, Troche G, Azoulay E, et al. Body mass index: an additional prognostic factor in ICU patients.Intensive Care Med. 2004;30(3):437-443.
53.McEwen LN, Kim C, Haan M, et al; TRIAD Study Group. Diabetes reporting as a cause of death: re-sults from the Translating Research Into Action for Dia-betes (TRIAD) study.Diabetes Care. 2006;29(2): 247-253.
54.Flegal KM. Excess deaths associated with obe-sity: cause and effect.Int J Obes (Lond). 2006;30 (8):1171-1172.
55. Breeze E, Clarke R, Shipley MJ, Marmot MG, Fletcher AE. Cause-specific mortality in old age in re-lation to body mass index in middle age and in old age: follow-up of the Whitehall cohort of male civil servants.Int J Epidemiol. 2006;35(1):169-178.