Working Paper No. 694
Reducing Economic Imbalances in the Euro Area: Some Remarks on the Current
Stability Programs, 2011–14
by
Gregor Semieniuk, Till van Treeck,
and
Achim Truger
*
Macroeconomic Policy Institute (IMK), Hans Böckler Foundation, Berlin
October 2011
*Corresponding author: Till van Treeck ([email protected])
The Levy Economics Institute Working Paper Collection presents research in progress by Levy Institute scholars and conference participants. The purpose of the series is to disseminate ideas to and elicit comments from academics and professionals.
Levy Economics Institute of Bard College, founded in 1986, is a nonprofit, nonpartisan, independently funded research organization devoted to public service. Through scholarship and economic research it generates viable, effective public policy responses to important economic problems that profoundly affect the quality of life in the United States and abroad.
Levy Economics Institute P.O. Box 5000
Annandale-on-Hudson, NY 12504-5000 http://www.levyinstitute.org
ABSTRACT
This paper evaluates whether the 2011 national stability programs (SPs) of the euro area countries are instrumental in achieving economic stability in the European Monetary Union (EMU). In particular, we analyze how the SPs address the double challenge of public deficits and external imbalances. Our analysis rests, first, on the accounting identities of the public, private, and foreign financial balances; and second, on the consideration of all SPs at once rather than separately. We find that conclusions are optimistic regarding GDP growth and fiscal consolidation, while current account rebalancing is neglected. The current SPs reach these conclusions by assuming strong global export markets, entrenched current account imbalances within the EMU as well as the deterioration of private financial balances in the current account deficit countries. By means of our simulations we conclude, on the one hand, that the failure of favorable global macroeconomic developments to materialize may lead to the opposite of the desired stability by exacerbating imbalances in the euro area. On the other hand, given symmetric efforts at rebalancing, the simulation suggests that for surplus countries that reduce their current account, a more expansionary fiscal policy will likely be required to maintain growth rates.
Keywords: Euro Area; Stability Programs; Current Account Imbalances; Fiscal Policy;
Stability and Growth Pact
1. INTRODUCTION
The economic crisis in the euro area continues to galvanize its member states’ governments in 2011. In particular, Greece and increasingly other countries in the so-called periphery of the monetary union are facing the threat of defaulting on their debt. Nearly all euro area governments are currently in breach of the public deficit and debt criteria enshrined in the European Stability and Growth Pact (SGP).
Over and above the pressing default problem, which is exacerbated by the lack of country-level exchange rate flexibility and monetary policy, euro area governments need to achieve the longer-term macroeconomic stability required for a functioning monetary union. This stability, which includes the reduction of external imbalances, is widely recognized as essential for the euro area to achieve robust growth. Without growth it is feared that unemployment cannot be reduced, foreboding more social unrest and possibly threatening the very project of European integration.
In striving for stability, euro area governments therefore face two challenges: the reduction of public deficits and the reduction of external imbalances. However, while the public deficits are in the limelight ever since the inception of the monetary union, the attention paid to external imbalances has been meager. The present crisis has finally alerted some policy makers to the large variations in current accounts of the member countries. In its proposal for reform of the SGP, the European Commission therefore suggests new enforcement measures to correct “excessive macroeconomic imbalances” in the euro area (European Commission 2010). However, the governments still largely ignore the importance of reducing current account imbalances in a coordinated manner. This is evident in their
latest version of national Stability Programmes (SPs) from April 2011.1 If these SPs roughly
reflect both perceptions about economic developments and intended policies in European governments, then their analysis helps in evaluating whether the euro area is on track to stability and, thereby, finding its way out of the crisis.
1 SPs project macroeconomic developments and government plans for achieving stability over the next four
years. The April 2011 version of the SPs, on which this paper focuses, makes forecasts for 2011–2014. The SPs are submitted annually by each member government to the European Commission and play an important role in the EU’s supranational budgetary surveillance. Members of the euro area have to explain how they intend to bring their budgets in balance or in surplus in the medium term as required by the SGP.
In this paper, we argue that the projections for achieving stability in the current SPs
are very likely too optimistic.2 We aver that by ignoring the importance of external
rebalancing and assuming an overly buoyant world economy, the SPs either forecast unrealistic growth rates or improbably successful fiscal consolidation. Toward this, we examine the interrelatedness of public deficit reduction and external imbalances reduction. We derive our argument mainly from evaluating the SPs against the logic of simple
accounting identities, which clarify the connections of financial balances and thereby of the two challenges. Thus, we intend to transcend the SPs’ narrow focus only on the government balance. We shed light instead on the SPs’ explicit or implicit projections of the financial balances of all three sectors in the economy (foreign, private, and public) and how they are intertwined with the overall macroeconomic development. Merely the final brief sketch of feasible alternative policy recommendations that would address both challenges
(sustainability of public deficits and current account positions) in lieu of neglecting one (current account rebalancing) requires a greater sophistication of the economic argument and thus involves more judgment.
The paper is subdivided into nine short sections. In the next one, we briefly discuss the relevance of the public deficit and external imbalances in the European context. In Section 3, we recall the accounting relationships of the three financial balances. Section 4 discusses the related notion of the “sustainability” of government, private, and foreign sector financial balances, concluding that one balance can be called “sustainable” only if the other two balances can be described as “sustainable.” Section 5 analyzes financial balances in the euro area from 1999 until 2010. Section 6 recalls the preceding set of SPs from 2010 and contrasts their projections with those of the current ones. Section 7 details the analysis of the current SPs’ forecast of macroeconomic development until 2014. We analyze the SPs’ assumptions and conclusions based on May 2011 data from the European Commission’s Annual Macroeconomic (AMECO) database, which largely correspond to the data used for the SPs, by means of our simple financial balances toolkit. We show that, individually, the SPs rely on optimistic assumptions about GDP growth; collectively, they require an improvement of the euro area’s current account with the rest of the world, the continuation
of significant current account imbalances within the euro area, and a steep drop of private
balances in some countries. This is followed by a closer look at the German SP: the
2 A similar argument for the Stability Programmes of the previous reporting period can be found in Brecht et al.
(2010). The present contribution is previewed in a shorter and simplified version of our analysis of this year’s SPs (Semieniuk, van Treeck, and Truger 2011).
continuation of the export-led growth model by the largest economy within the euro area clearly hinges upon the persistence of significant current account imbalances within the euro area and beyond. To illustrate how monetary union stability depends on controlling external imbalances, Section 8 then simulates several scenarios with more unfavorable euro area current account constraints. On the one hand, when assuming that the current account surplus countries in these scenarios realize the projections of their SPs, we conclude that either the “PIGS” countries (Portugal, Ireland, Greece, Spain) would find it impossible to realize their rebalancing plans, or new “pigs” countries, such as France or Italy, would have
to bear the current account deficit.3 These counterfactuals indicate that projected public
deficit reduction in these countries would have to come at the cost of worryingly large current account and private sector deficits. On the other hand, we find that if surplus countries were faced with constraints on the foreign balance, they would have to acquiesce into increasing their public spending and violate their public deficit goals, in order to uphold their growth projections, but that the numbers in this simulation do not look as worrying as in the simulations that constrain the deficit countries. Section 9 concludes that failure to consider external imbalances is likely to entrench existing instability in the euro area and portends long-lasting economic stagnation. Further we conclude that a symmetric effort at rebalancing current accounts would slow down fiscal consolidation (in the current account surplus countries) but would address both macroeconomic challenges and thereby not only allow for consolidation in the medium term but also lead to the desired stability. Yet, important open questions remain, above all the challenge of reducing differences in price and nonprice competitiveness in the absence of nominal exchange rates. The intention of the present analysis is simply to make explicit the dangerous absence of macroeconomic policy coordination within the monetary union that is apparent in the national governments’ SPs.
2. TWO POSSIBLE MEASURES OF MONETARY UNION STABILITY: FISCAL CONSOLIDATION AND EXTERNAL BALANCING
Functioning monetary unions require a degree of homogeneity within member economies. In the European context, the aim to establish or maintain this homogeneity is usually subsumed under the codeword “stability.” Hitherto, creating stability was associated with reducing
3 It should be obvious from our analysis that we reject the one-sided blaming of the current account deficit
countries as being responsible for the current Euro crisis. We use this term here merely to remind that the pro-jected current account surpluses by Germany and the Netherlands (and some other smaller member states) necessitate the existence of a certain number of “pigs” countries, i.e., countries with worryingly large current account deficits.
public deficits and public debt-to-GDP ratios. This is enshrined in the Stability and Growth Pact (SGP). Recently, however, calls have been heard to also address external imbalances which are manifested in both very positive and negative current account balances.
2.1 Reducing Public Deficits
The SGP for the euro area countries allows for government deficits of no more than 3 percent of GDP. Failure to comply may result in sanctions. Yet, in 2010 this limit was breached by all member countries save Estonia, Finland, and Luxembourg. Greece, Portugal, and Spain even reported a public deficit of more than 9 percent of GDP; France ran a deficit of 7 percent. Ireland topped the list with a 32 percent deficit, owing to large bank bail-outs. The unweighted euro area average measured 6.9 percent of GDP (see Table 1b),
deteriorating 0.4 percentage points from 2009. The Council of the European Union has stipulated deadlines ranging from 2011 for Malta to 2015 for Ireland to return below the 3 percent threshold.
Furthermore, the SGP demands that the debt-to-GDP ratio should not surpass 60
percent.4 Actual debt levels were never below that mark in Belgium, Greece, and Italy and
the debt-to-GDP level for the euro area as a whole has never been below 66 percent of GDP ever since the inception of the euro in 1999. Due to large government deficits and guarantees notably for financial institutions at risk of default, debt levels across member countries have surged during the crisis. In 2010 the euro area’s average public debt level had increased from 2007 by almost 20 percentage points to 85.4 percent of GDP. The current debt crisis has moreover given a boost to demands to make the SGP’s threat of sanctions credible and also require countries to keep their government budget close to balance or in surplus over the medium term.
The euro area rules may be supplemented by national laws: In Germany, the constitution was amended by the “debt brake” law in 2009. It states that the “structural” deficit of the federal government must not exceed 0.35 percent from 2016 onward. On the regional plane, governments will even face sanctions if they incur any “structural” deficit in or after 2020.
4 Given a government deficit of 3 percent and nominal GDP growth of 5 percent every year, the public
2.2 Reducing Current Account Imbalances
The global imbalances characterized by large current account deficits and surpluses are widely held to be one of the major macroeconomic distortions that fueled the global economic crisis starting in 2008. Many economists argue that the reduction in global imbalances is one of the central prerequisites for a sustainable global recovery and for the stabilization of the world economy more generally (e.g., Blanchard and Milesi-Ferretti 2009; Horn, Joebges, and Zwiener 2009; IMF 2009).
In line with this argument, many sizeable economies had current accounts significantly different from zero in 2007: the US deficit stood at 5.2 percent of GDP, the UK’s at 2.6 percent, and Spain ran a 10 percent current account deficit. Conversely, China, Germany, and Japan displayed surpluses of 11, 7.6, and 5.8 percent of GDP respectively.
Meanwhile, the euro area as a whole has sustained only relatively small current account balances with the rest of the world since its creation in 1999. Yet, within the
monetary union, individual countries display both large surpluses and deficits (see Table 1a): Germany’s 7.6 percent were topped by the Netherlands’ surplus of 8.4 percent of GDP by 2007. On the flipside, Greece, Portugal, and Spain ran current account deficits of more than 10 percent of GDP by 2007. These imbalances are particularly hard to address by one country alone in a monetary union: The inability to adjust exchange rates renders it difficult for a country that imports more than it exports to change this trend, as it does not have a depreciating exchange rate to help its exports become cheaper for the rest of the world.
While the SGP does not address such imbalances, it is now being recognized that a reform of this pact should include also the avoidance of “excessive imbalances” in general, notably divergences in current account positions. This has been argued by the so-called Van Rompuy task force and has been incorporated into the European Commission’s proposals for a reform of the SGP (van Rompuy 2010; see Hacker and van Treeck 2010 for a discussion). However, it still remains unclear whether current account surpluses will also be considered an “excessive imbalance” or whether there will be an asymmetric focus on current account deficits. As we show below, the newly updated SPs certainly do not reflect a coordinated, symmetric approach to current account imbalances.
3. FINANCIAL BALANCES: A QUICK REMINDER
3.1 The Three Financial Balances
Before analyzing the SPs with respect to reducing public deficits and external imbalances,
we introduce the accounting relationships of public, private, and foreign financial balances.5
These will inform our analysis.6
The following accounting identity holds:
(1) Public sector financial balance + Private sector financial balance + Financial balance
of the foreign sector ≡ 0.
Hence, any particular sector in the economy can only run a surplus, if it is offset by a deficit of equal magnitude in the remaining two sectors of the economy. For the foreign balance, it moreover holds that if one country runs a current account surplus, then at least in one other country the government or the private sector has to sustain a financing deficit.
3.2 GDP and Balances
Given certain assumptions, the (projected) evolution of the financial balances of the three sectors also has implications for the (projected) growth contributions of the different
components of GDP (see Appendix for a more detailed discussion). In order to elucidate the link between the composition of GDP and the sectoral financial balances, recall that:
(2) GDP ≡ C + I + G + X – M,
where
C = Private consumption, I = Private investment,
G = Government expenditures in final goods, X = Exports,
5 The balances are annual flow variables. The public financial balance is the negative of the government deficit.
The foreign financial balance is the negative of the current account. The private financial balance is net savings of households and firms.
M = Imports, and that
(3) GNI ≡ GDP + NIA,
where
GNI = Gross national income,
NIA = Net income and current transfers received from abroad.
Gross national income will be used to derive consumption, saving (S), and tax payments to the government net of government transfer payments and subsidies (NT).
(4) GNI ≡ C + S + NT,
It follows from (3) and (4) that
(5) (NT – G) + (S – I) + [(M – X) – NIA] ≡ 0,
where (NT – G), (S – I), and [(M – X) – NIA] are the financial balances of the public, private, and foreign sectors, respectively. Hence, changes in any of the components of GDP also impinge on the balances.
3.3 Desired and Actual Balances
The financial balances of the three sectors must sum to zero. Clearly, any particular sector will only be able to adjust its financial balance in the desired way, if the other two sectors
wish to adjust their joint financial balance by the same amount in the opposite direction. If
this is not the case, and the sum of the desired balances exceeds, or falls short of, zero, then
GDP will adjust to bring the actual balances in accordance with each other.
To illustrate, when private demand is weak, the private sector financial balance (S – I) is typically positive and large (or increasing). When desired private saving exceeds desired private investment and foreign demand is equally insufficient, i.e., (X – M) < (S – I) ex ante, there will be involuntary unemployment as a result of insufficient aggregate demand, in the
absence of government intervention. Suppose government desired to keep a balanced budget, then the ex post balances would still have to match. Likely, government would be forced into deficit by automatic stabilizers, whereas private sector savings would fall due to
unemployment. Thus, the actual balances would sum to zero but at a lower than desired output level. This downward spiral is made worse if the government attempts to counteract the automatic stabilizers by a procyclical discretionary fiscal policy in an attempt to achieve its desired balance.
Since the onset of the current crisis in 2008 and unlike in the above example, govern-ments proactively sought to reduce unemployment by means of discretionary measures, thus reducing the public sector financial balance and allowing for the desired surge in the private balance. Yet, over the medium term such a policy may imply that the government deficit and the public debt-to-GDP ratio eventually increase to what many fear (and the SGP posits) to be “unsustainable” levels.
4. WHEN ARE FINANCIAL BALANCES “UNSUSTAINABLE”?
While the SGP strictly defines allowed government spending to be maximally 3 percent of GDP, there is no clear-cut economic definition of “unsustainable.” However, if one subscribes to the notion that public deficits can be too large and moreover recognizes that current account balances cannot grow without bound, it automatically follows that there must be an upper limit to the extent to which the private sector can be allowed to run a surplus.
Considering the private balance, one can conclude furthermore that not only private surpluses but also private deficits should be kept moderate: First, a large private deficit would increase the danger of a solvency crisis. Second, should such a solvency crisis set in, as seen in the subprime crisis, the government—through automatic stabilizers and
discretionary measures—would subsequently incur large deficits. These deficits may then suddenly be deemed “unsustainable” according to the perception of the SGP or to the
willingness of creditors to refinance the government’s debt.7
However, this leads logically to the conclusion that the government financial position cannot be considered “sustainable” by itself, but only when the private sector financial
7 Unlike sovereign states which control their own currency, euro area governments can indeed become
position is deemed “sustainable” simultaneously. For instance, in Ireland the public debt-to-GDP ratio was very low until recently, but it almost quadrupled between 2007 and 2010 as a result of the current crisis. Similarly, over the past two years, the Spanish government had to run very large deficits and substantially increase the public debt relative to GDP, after it had run surpluses for several years before. In both countries the private sector had run large deficits prior to the crisis. Intriguingly, the SGP does not address this issue of linked balances but focuses on the public sector deficit only. In its opinion on the Stability Programme of Spain, 2006–2009, the Council of the European Union considered that “the medium term budgetary position is sound and the budgetary strategy provides a good example of fiscal policies conducted in compliance with the Stability and Growth Pact” (Council of the EU 2007, p. 3). Exactly the same assessment was given in the Council opinion on the Irish SP. Similarly, “the financial markets” seemed to consider the public finances of all euro area member states “sustainable” between 1999 and 2008/9, but then suddenly changed their minds in view of rapidly rising public deficits and debt. Yet, the current account balance and the foreign debt-to-GDP ratio are much more accurate ex ante indicators of the sustainability of national debt, given that the current account position reflects the joint financing situation of the private and public sectors of the country in question.8
In conclusion, declaring the financial balance of any particular sector as “unsustainable” necessitates calling the balances of the two other sectors equally “unsustainable,” irrespec-tive of how this term is defined.
5. FINANCIAL BALANCES AND MACROECONOMIC DEVELOPMENT IN THE EURO AREA, 1999–2010
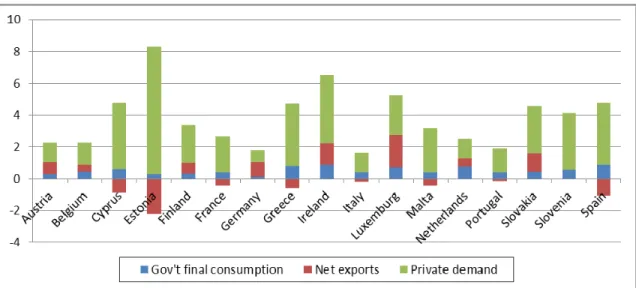
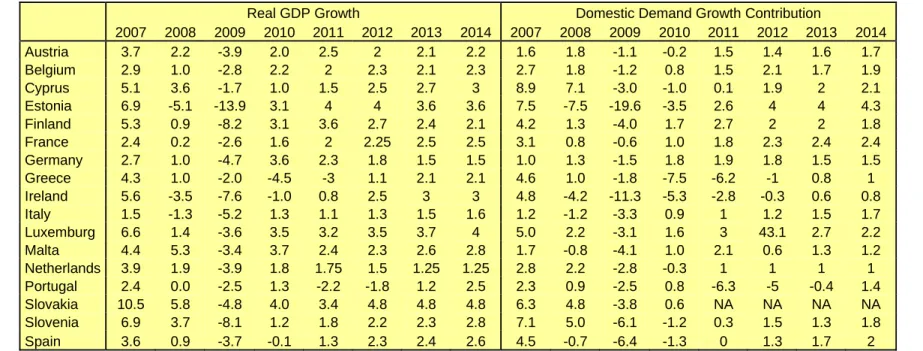
Section 3.2 outlines the connection between financial balances and GDP. The following account of the macroeconomic development in the euro area until 2010 illustrates these connections. First, note that Figure 1 plots the average real growth contributions of the three sectors for selected euro area countries for 1999–2007. Comparing these growth
contributions to the financial balances of 2007 in Table 1a, it is evident that countries with relatively strong private demand growth on average display lower, partly even negative private financial balances in this year. From the accounting relationships we know that the
8 This is true both for sovereign countries, where the state controls the national currency but where foreign debt
is denominated in foreign currency, and for countries within a currency union, where the individual state has lost control over the currency and is, therefore, at risk of default.
private balance is (S – I). High private demand growth, i.e., consumption and investment, would imply that saving (S) is low and investment (I) is high, hence depressing the balance.
Second, note the evolution of public and private financial balances before and during the crisis. In 2007, government deficits were below 3 percent in most countries, but the private sector ran large deficits especially in the “PIGS” countries, reflected in large current account deficits (see Table 1a). When the private debt bubbles burst and the private sector suddenly increased its net savings across euro area countries, government jumped into the breach as a consequence of rising unemployment and solvency problems in the private sector: The public balance fell because government spending soared and revenues plummeted (see Table 1b).
The turbulences in private and public sectors were reflected in the rate of GDP growth (see Figure 2 for eight countries). As analyzed in section 3.3, if desired financial balances (more saving in the private sector, less deficits in government) are incompatible with the accounting restriction, a change in GDP growth aids in bringing the balances to the necessary size. Here, the slowdown of economic growth made the respective private sectors gain less income and therefore save less and the governments increase its deficit by foregone tax income and automatic stabilizers and discretionary spending. As a result, the combined actual balances matched the foreign balance.
Third, Figure 3 shows that current account and trade balances over the past decade were closely linked in most of eight euro area countries (France, Germany, Greece, Ireland, Italy, Netherlands, Portugal, and Spain—most of the analysis will focus on these countries). That is, current account deficits or surpluses are linked to trade imbalances rather than diverging majorly due to large primary or secondary income flows (formerly known as “income” and “current transfers”). Ireland is the exception. What is remarkable about the plotting of the net exports is that it highlights how most countries experienced a trend reversal in their balances. Surplus countries would see their surplus shrink, deficit countries would see their balance improve. However, this observation was not true for France and Italy. Both countries have seen a steady decline of the current account and trade account position, apparently uninfluenced by the crisis. This trend is to be borne in mind for the following analysis.
Fourth, the export matrices in Table 2 show that in 2007 the intra-euro area exports constitute more than 40 percent of total exports for eight euro area countries. This
patterns. Anticipating the analysis to follow, this large part of trade being conducted between members of the currency union implies that any reduction of current account deficits by member countries is more likely to succeed if other countries of the euro area diminish their respective surpluses.
6. COMPARISON OF THE STABILITY PROGRAMMES OF 2010 WITH ACTUAL DEVELOPMENTS IN 2010 AND THE STABILITY PROGRAMMES OF 2011
Before analyzing the 2011 version of the SPs in detail, it might be insightful and a test to the usefulness of accounting analysis to compare the already familiar eight country subset of the SPs to their predecessors from 2010 to understand how the SPs respond to the evolving macroeconomics situation. The previous year’s SPs from 2010 are called “old” for the rest of the section, the SPs of 2011 “new.” In general, the SPs extrapolate the given macroeconomic data some four years into the future. Based on these assumptions about the macroeconomic development, they draw conclusions about GDP growth and the ability of the public sector to reduce its deficit.
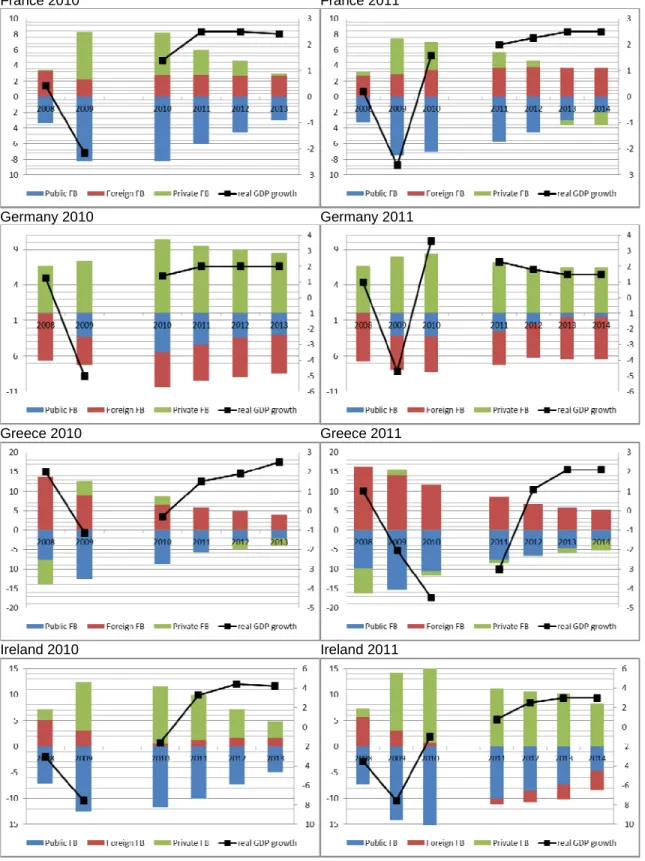
The differences between old and new SPs can be traced in Figure 4. It plots two graphs next to each other for each of the eight countries. The left one depicts the actuals and projections of the financial balances and the real growth rate of GDP as per the old SPs. The right one does the same for the new SPs. For intra-country comparability the ordinate scale is the same for each pair of graphs. Note that even the “actual” values for 2008 and 2009 may change slightly from old to new SPs, as the AMECO data underlying these has been updated between the publication of the two sets of SPs.
It can be seen that countries have generally revised their growth prospects downward. One exception is Germany’s higher growth for 2011 fueled by an unexpectedly good
performance in 2010, while its medium term growth outlook was actually reduced from 2 to 1.5 percent. An opposite exception is France, whose growth was reduced for 2011 in the new SP, but whose medium term growth projection has been held steady at 2.5 percent. Across the six remaining countries the growth rates have fallen.
Taking a look at the financial balances the picture is less even. In the new SPs the “PIGS” countries save Greece are all improving their current account with respect to the old SP projection. The surplus countries, Germany and Netherlands, too, revise their current account forecast upward (i.e., the foreign financial balance becomes more negative). For
Greece, the more negative current account reflects the deterioration in the public and private positions since the publication of the old SPs, which has to be financed by foreign inflows. Intriguingly, however, France and Italy, too, are seeing their current account projections deteriorate along with their private sector balance, as they project the public deficit to diminish. As already noted in section 5, this deterioration is the continuation of a trend of current account deterioration, which was hitherto buffered by large public deficits. Abiding by the SGP, however, implies that the public deficit has to become smaller and by
implication both France and Italy—in the new unlike the old SP—see their private balance flip from positive to negative.
The evolution of the balances and the adjustment of the SPs from the old to the new version confirm the analysis by Brecht et al. (2010) of the old SPs. With regard to the
slowdown of growth, we concluded based on the “old” evidence that a rebalancing of current accounts would most certainly not occur at growth rates projected in those SPs. Rather, GDP growth would decelerate, reflecting the forced adjustments made from ex ante diverging desired balances to the ex post exertion of the accounting identity (ibid. p. 14).
Similarly, Brecht et al. (2010) noted that absent a reduction in current account surpluses of the surplus countries, deficit countries (“PIGS”) would be prone to sustaining these high deficits with deteriorating financial balances. The news that the new SPs are conveying is that the countries thus destabilized might be changing: the former “PIGS” countries (with the exception of Greece) are actually reducing their imbalance in the foreign financial balance at the cost of slower GDP growth and shed their role of being the
counterparts to the surpluses incurred by the likes of Germany and the Netherlands.
Meanwhile, the downward trend in current account and private financial balances of France and Italy observable so clearly with the new SP data indicates that the “pigs” role then is to an increasing extent assumed by France and Italy.
7. ASSUMPTIONS AND IMPLICATIONS OF THE NATIONAL STABILITY PROGRAMMES FOR 2011–2014
7.1 Analysis of the Stability Programmes
With this comparison of old and new SPs in mind, we turn to the analysis of the SPs of 2011. Their projections of public financial balances and current account balances as a percentage of GDP for 2011–2014 are depicted in Table 3. Moreover, they allow us to determine the
private financial balance as the residual. Because the SPs also provide data on projected GDP growth, we can express the financial balances in euros as well as in percent of GDP. These projections create a system of equations with 3 * 17 = 51 variables for each year. It is depicted in Table 4 for the year 2014. Each row sums to zero, and hence implies the private financial balance. In the second and the third part of Table 4, column totals also sum to the respective financial balance of the euro area, including its foreign balance vis-à-vis the rest of the world (either in euros or percent of euro area GDP). Table 5 shows the projected real growth contributions of the euro area countries. Inspection of these projections for all SPs combined rather than only separately reveals intriguing features.
1.) Overall projected GDP growth rates appear quite optimistic, given the degree of
fiscal consolidation: By the end of the projection period, private financial balances in the current account deficit countries would have worsened dramatically to -1.7 percent of GDP in France, -2.7 percent in Greece, -2.8 percent in Italy, -1.1 percent in Portugal, and -0.3 percent in Spain from mostly positive values in 2010. Recalling the discussion about desired and actual financial balances, if the private sector does not desire to reduce saving by as much, the adjustment process between a
consolidating government and a cautious private sector will cause frictions in the economy and loss of growth. This relationship is frequently not explicitly discussed, but movement in the remaining balances is a necessary consequence of fiscal consolidation. The next two points discuss whether it is likely that the foreign balance could act as a buffer. Meanwhile, the surplus countries forecast private net saving to fall but remain at high levels of 7.1 percent in Austria, 4.5 percent in Belgium, 6.5 percent in Germany, and 11.2 percent in the Netherlands.
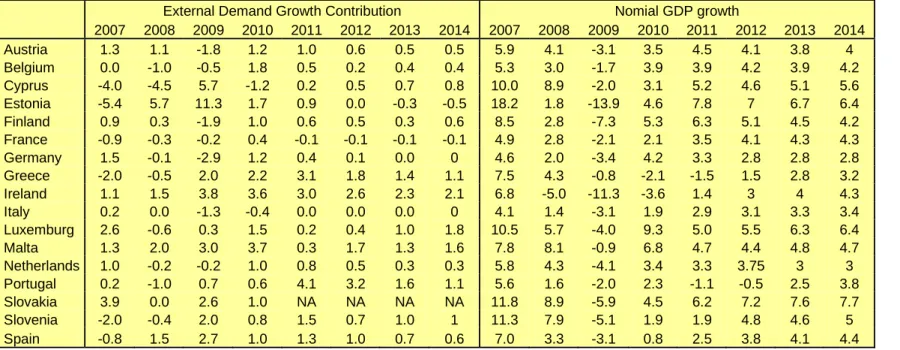
2.) Adding up the national current accounts in 2010 and 2014, the euro area as a whole
has to improve its current account position by 1.3 percentage points of GDP from 2010 until 2014. This requires that exporters in the euro area benefit from strong global demand, while imports grow less. It also runs contrary to efforts at global rebalancing. Hence, if global rebalancing is nonetheless to take place and the large deficit countries, in particular the US and the UK, attempt to reduce their deficits, the SPs projections shift the surplus adjustment burden entirely on the other world’s large surplus countries, in particular China and Japan.
3.) Despite the improvement of the euro area-wide current account, within the euro area
current accounts continue to diverge significantly in 2014. At first look, the improvement in current account of the “PIGS” countries looks promising. Note, however, that part of this improvement in projections rests on the assumption of slow or even negative growth. On the other hand, the surplus countries Germany and Netherlands would augment their current account surpluses from roughly 5 to 6 and 7 to 10 percent of GDP, respectively, in the period 2010 to 2014. Greece, Portugal, and Spain would rebalance but still run deficits of more than 2 percent. The only two countries that fare badly with their balances according to the projections are Italy and France. Italy never reduces its current account deficit below 3 percent while France’s actually steadily deteriorates to 3.6 percent.
In short, the GDP growth projections and the fiscal consolidation may be jeopardized by non-realization of the optimistic assumptions about private sector’s ability to drive GDP growth and about the euro area current account development.
The contemplation of the private financial balance projection necessitates another word of caution: the deterioration of private financial balances in those countries, in which the increase in private indebtedness has been also strong during the years prior to the financial crisis, is remarkable (compare Figure 2 and the right hand diagrams of Figure 4). The deterioration would be triggered by renewed private demand booms, implying zero or even negative net private saving as in Ireland or Spain before the onset of the crisis. Against this backdrop, the implicit assumption about negative private financial balances for 2014 looks worrying, in particular for France, Greece, and Italy.
7.2 Analysis of the German Stability Programme Separately
In order to detail the analysis of the SPs, it may be useful to also inspect one individually. We look in more depth at the German SP’s assumptions and its projections, which may be particularly insightful due to Germany being the largest economy in the euro area that has moreover contributed most to the current account imbalances. It is remarkable that the German SP plans for continually large and increasing current account surpluses for the largest euro area economy with about one quarter of euro area GDP. It is forecasted that exports will grow by 4 percent per year by 2013 and that “(t)hanks to its high level of price and non-price competitiveness, the German economy will especially benefit from the upturn in the volume of world trade, such that it will be able to defend its market shares into the
medium-term as well” (German SP, p. 8). The German SP does not even entertain the notion that a rebalancing may be in order. Nowhere was the idea to be found that the continued export growth may pose an obstacle to euro area stability. While the current account balance rises comparatively slowly (from 5.1 percent in 2010 to roughly 6 percent in 2014), this is not due to any proactive efforts at correcting imbalances. Rather, strong domestic demand growth contributions of 1.5 percentage points per annum (see Table 5) is forecasted to stimulate imports (German SP, p. 10).
Instead of considering a proactive stance of surplus countries in the current account rebalancing, called symmetric rebalancing, German authorities wish the monetary union’s stability to be maintained solely by measures at the European level, namely a combination of stricter rules for fiscal consolidation and “structural reforms” that are to enhance
competitiveness (German SP, pp. 5–6). This is then asymmetric rebalancing, where only the deficit “culprits” have to make an effort to improve their external balance. If structural reforms enabled deficit countries to increase their competitiveness vis-à-vis the surplus countries and thus their exports, this would mitigate the imbalances. However, this would not be an easy task: With more than 40 percent of Germany’s exports being imported by other euro area countries and more than 60 percent by EU member states, Germany’s export growth and indeed overall growth strategy continues to rest on sustained deficits (public or private) in other European countries, and hence on its competitiveness in the euro area. Hence, German producers, too, have an incentive to stay competitive vis-à-vis the euro area and asymmetric rebalancing may prove difficult. Moreover, inability to adjust exchange rates vis-à-vis Germany makes other euro area countries particularly susceptible to imports from Germany. This rejection of responsibility for rebalancing by the biggest surplus country may easily pave the way back to precrisis level current account imbalances within the euro area.
8. THREE ALTERNATIVE SCENARIOS FOR THE EVOLUTION OF THE EURO AREA CURRENT ACCOUNTS
Returning to the assumptions for the euro area as a whole, in this section we want to drive home that failure to heed the importance of all three balances instead of only the public one is likely to either prevent the realization of projected GDP growth or of public deficit reduction. This is done by means of a very simple simulation analysis. For this, we simulate what would have to happen to the financial balances of all euro area countries in 2014 and
by extension to growth contributions, if the euro area as a whole failed to improve its current account vis-à-vis the rest of the world and the individual countries still realized the projected public deficit reductions and the desired growth rates.
We pick the euro area current account as the variable to be manipulated because we find the SPs’ assumptions about it to be optimistic and because it is an emergent variable from all SPs together rather than set by individual SPs. The failure of euro area current account improvement might happen for a number of reasons at the time of writing (see for instance IMF 2011): Growth may slow in China among fears of overheating and a housing bubble, depressing world economic activity as a result; fears of a double-dip recession in the US are substantiated by dismal economic data from the world’s largest economy and
continuing partisan arguments about the speed of fiscal consolidation (deemed too slow by many) and the public debt ceiling (which many argue should be raised no further); volatile food and oil prices may also pose threats especially to emerging markets’ health; and financial market turbulences in Europe and elsewhere may further increase, should current growth projections prove to be overly optimistic. All of these threats make a strong case for the euro area to develop a growth strategy that is not so overly reliant on “the upturn in the volume of world trade” as it is optimistically projected in the German SP (p. 8).
8.1. Methodology
We construct the simulation so that we receive twelve different scenarios of foreign and private balances of all euro area countries. First, we let the euro area foreign financial balance vary between its projected level of net lending to the rest of the world or of approximately 0.9 percent of euro area GDP (i.e., an outflow of funds and therefore -0.9 percent in the foreign financial balance) and our imposed constraint of keeping the financial balance at 0.4 percent, implying a continued inflow of foreign funds. We thus have two scenarios. Furthermore, we differentiate between surplus countries reducing their current accounts (symmetric rebalancing) and deficit countries having to incur even larger deficits to meet the constrained euro area current account (“business as before”). In the symmetric rebalancing case, we record results for the case that all deficit countries reduce their current account deficit to 2 or 3 percent of their GDP. In the “business as before” case, deficit countries have to divide the additional deficit amongst them and surplus countries achieve their SP aims. This gives 2 * 3 = 6 scenarios. Finally, the adjustment burden is determined in two different ways for each case (making it twelve scenarios in all): either the adjustment
that each country must bear is made proportionally to the size of its actual current account
balance in 2010 or to that of the SP-projected one in 2014.9
Since we are interested in the medium term effects of a change in the financial balances, we do not calculate the exact balances for each year. Rather, we stipulate that the balances change by one fourth of the required amount in every of the four years. On this basis we compute average growth contributions of the three sectors (public, private, foreign). The Appendix guides through the calculation method of these growth contributions.
8.2 Results
The results for eight euro area countries are recorded in Table 6. Some of the twelve
scenarios have been left out, since their numbers are very similar to others already depicted. The symmetric rebalancing cases (deficit countries reduce their deficits to two or three percent of their GDP) are displayed in the left and middle columns. The business as before case (surplus countries achieve their SP projections) is in the right column. Note that the bottom right corner case uses the SP assumptions, except that growth contributions have been calculated according to our average method in the Appendix. This case can thus be used to compare with the simulation results in the other parts of the table. We discuss only some scenarios:
1.) Upper right corner of Table 6 – surplus countries realize their SP plans, while the euro area balance fails to improve and deficit countries sustain higher deficits in proportion to their 2010 deficits: Obviously, the implications for the balances of the deficit countries, i.e.,
the current “PIGS” countries, are devastating. In Greece and Portugal, private sector and current account deficits would once more soar to more than 10 percent of GDP. Italy and Spain would both run current account deficits of over 5 percent and incur private deficits of almost 5 and over 3 percent respectively. Note that France’s current and private accounts deteriorate only modestly as compared to their SP values: France projects a continually large current account deficit anyway. In terms of growth rates, private sector demand in the deficit countries has to sustain a larger part of the growth part, with the growth contribution of the public locked in at the SP implied value since public deficits and GDP growth have been
9 A schematic example illustrates: say France has a current account deficit of 10 units, which is 20 percent of
all current account deficits in the euro area since these add to 50 units. Now, if we impose that the cumulated deficits rise to 60 units, then France has to bear 20 percent of this increase. Hence, France will sustain a new deficit of 12 units instead. As discussed above, France’s share of the overall deficit according to the projections for 2014 is larger than that in 2010. Hence, varying the year of reference affects countries’ account
held constant, and the growth contribution of the foreign sector being negative for each country.
2.) Right and second from the top – like scenario 1 but deficit countries sustain higher deficits in proportion to their 2014 deficits: This is the scenario of the emergence of new
“pigs.” France and Italy would incur enormous current account deficits of 6.3 and 5.1 percent of GDP respectively. The resulting positive foreign financial balance would finance both the public and private deficits. The latter would be at -4.3 and -4.9 percent of GDP respectively. These numbers smack of those of Ireland and Spain before the crisis: While the public balance is small, the negative private balance makes it liable to spiraling into large negative numbers, if an inclement economic atmosphere triggers government stabilizers and bailouts. The remaining countries in contrast would be significantly better positioned, benefiting from the relatively small share that they have in the euro area combined deficit thanks to their projections of improved current accounts by 2014, from which the
adjustments are derived in this scenario.
3.) Top left corner – the surplus countries must adjust as deficit countries improve their current account balance to -2 percent of GDP: This has the surplus countries, Germany and
the Netherlands, starkly reduce their balances. With Germany accounting for some 62 percent of the euro area’s surplus in 2010, it bears the lion’s share of the adjustment burden. Clearly, Germany would require even stronger private domestic demand (as government spending is taken over from the SP) than in the optimistic baseline in the bottom right corner. While the sustained private demand growth contribution of 1.3 percentage points projected in the German SP already are large compared to historic averages of 0.75 points (compare Figure 1), the 2.3 percentage points required in all four years for achieving the desired GDP growth seem impossible to be realized. The deficit countries meanwhile reduce their inflow of foreign funds to 2 percent of GDP. As a consequence, all countries except Italy can maintain positive private balances, while also reducing their public deficits according to SP projections. Rebalancing among surplus countries according to 2014 weights (box directly below the one of scenario 3 would differ but imperceptibly, since the projected surplus shares are virtually the same as in 2010).
4.) Left column, third box from top – the surplus countries must adjust but only to
projected: This mild scenario actually depicts how a rebalancing could take place under
otherwise unchanged SP assumptions. Here, thanks to the demand from the rest of the world, the dent in the surplus countries’ foreign balances is so small that they retain nonnegative growth contributions of the foreign sector. The situation of the deficit countries is the same as in scenario 3, since they diminish their current account to 2 percent regardless of the euro
area current account balance.10
Contemplating the ensemble of results—the first two scenarios even exacerbating the position of the deficit countries and the second two depicting an attempt at rebalancing—the overwhelming current account deficits and private sector deficits of scenarios 1 and 2 show that such a development would spell a high risk of instability: The public sector of deficit countries might have to come to the rescue of the indebted private sector, erasing hopes of abiding by the SGP rules or the rest of the world might refuse further credit lines, as witnessed in Greece in 2010 and 2011, forcing the other two balances closer to zero and quenching GDP growth. These scenarios show that rebalancing of foreign balances is a very important factor in achieving the stability required for the monetary union, and thereby both public deficit reduction and desired GDP growth.
Scenario 3 was already identified as being unrealistic in terms of German private growth contribution. Hence, it is likely that GDP growth would slow, except if the government is willing to fill the demand gap by increasing its spending, i.e., the public deficit. But apart from this, scenario 3 looks more stable than the first two scenarios, meaning the surplus countries can weather a deterioration in their outlook and might even reach the desired GDP growth if they are willing to ramp up their public spending.
Scenario 4, lastly, illustrates the possibility of symmetric rebalancing which was already discussed in section 7.2. It can be seen that surplus countries would only slightly reduce their foreign growth contribution, while allowing deficit countries to reduce their imbalances. Rebalancing under these favorable conditions would yield actual stability for the euro project at little immediate cost (and likely large longer-term benefits, e.g., the absence of crises such as the current one).
10 Further scenarios: The middle column is similar to scenarios 1 and 2, but assumes less radical rebalancing:
deficit countries improve their foreign financial balance to 3 percent of GDP. The left and middle columns second from top box and bottom box and the right column second from bottom box are less interesting in the present analysis, as they present only minor variations of scenarios 3 and the SP baseline respectively.
Summarizing, if there is a commitment to symmetric rebalancing regardless of the development of the euro area foreign balance, a collapse in growth rates in surplus countries
could be avoided, provided their governments willingly accepted higher public deficits over
an extended time period. These deficits would thus compensate for the reduced borrowing of the rest of the world, implied by the reduced current account balance. In such a scenario, it is clear from the analysis above that the German government may well have to accept deficits of significantly more than 3 percent of GDP for several years, if the officially projected GDP growth rates and current account rebalancing are to be achieved within the euro area.
Although such a policy would currently be considered a breach of the “debt brake” rule, the deficit would still appear quite modest by international standards.
9. CONCLUDING DISCUSSION
This paper has evaluated whether the 2011 national Stability Programmes (SPs) of the euro area countries are instrumental in achieving economic stability in the monetary union. In particular, we analyzed how the SPs address the double challenge of public deficits and external imbalances. Our analysis rests, first, on the accounting identities of the public, private, and foreign financial balances and, second, on the consideration of all SPs at once rather than separately. We found that conclusions are optimistic regarding GDP growth and fiscal consolidation, while current account rebalancing is neglected. The current SPs reach these conclusions by assuming strong global export markets, entrenched current account imbalances within the monetary union as well as the deterioration of private financial balances in the current account deficit countries. By means of our simulations we conclude, on the one hand, that the failure of favorable global macroeconomic developments to materialize may lead to the opposite of the desired stability by exacerbating imbalances in the euro area. On the other hand, given symmetric efforts at rebalancing, the simulation suggests that for surplus countries that reduce their current account, a more expansionary fiscal policy will likely be required to maintain growth rates. For Germany as a case in point we reason that—if fiscal consolidation were to hold sway—forecast GDP growth would presuppose a private sector demand boom unprecedented in recent history. Hence, admitting to the unlikelihood of such a boom, the only alternative way to achieve the GDP growth rates projected in the SPs by means of domestic economic activity would be higher
government activity. This holds for the surplus countries in general. In terms of the financial balances this could be achieved by running higher deficits and thus a deterioration in the
public sector balance or by taxing away private sector savings and thus a deterioration in the private sector balance.
Our approach to presenting our argument is overwhelmingly simple. Focusing on accounting identities, we say little about economic theory that would explain the behavior causing changes in desired financial balances or the adjustment process that leads to the ex post balance of zero. We do not attempt to explain how macroeconomic policies, unit labor cost differentials, demographic factors, productivity growth differentials, or financial market turbulences, and so on, play a role in determining actual financial balances. For instance, we eschew a discussion in how far it is realistic to assume that euro area countries with current account deficits would benefit from a reduction in the current account surpluses of Germany and other surplus countries. While these questions merit closer attention, they would also necessitate more assumptions than we deemed necessary for the purpose of this paper. Given our aim of elucidating the interrelatedness of financial balances in the euro area context, it was beyond the scope of this article to address these more nuanced issues. But we could reveal by focusing on the accounting identities that the project of achieving the stability necessary for a functioning of a monetary union is jeopardized.
It should also be repeated that our counterfactual exercises involve several
assumptions, which are appropriate to considering the approximate medium term effects of the change of current account adjustments, but may not appear overly realistic for every single year. This is in line with our aim to provide qualitative conclusions about the direction in which euro area economies are headed until 2014 rather than with estimating precise annual numbers.
With the qualification inherent in our approach duly noted, our straightforward calculations suggest that euro area governments should not be surprised to see real macroeconomic developments diverge substantially from their SP projections. A trace of divergence is already discernible, when contrasting the current SPs with the old ones from 2010. In particular, barring higher public deficits on the part of current account surplus and low debt-to-GDP ratio countries, a continued breach of the euro area stability rules by countries with current account deficits is to be expected. In fact, accepting higher than 3 percent public deficits (or increasing government spending while taxing away excessively high private net savings) in surplus countries may prove to be the only way to effectively stabilize the European Monetary Union without worsening the growth projections.
REFERENCES
AMECO. 2011. Annual Macro-economic Database of the European Commission's
Directorate General for Economic and Financial Affairs (DG ECFIN). Last accessed on 9 October 2011 at:
http://ec.europa.eu/economy_finance/db_indicators/ameco/index_en.htm
Blanchard, O. and G.M. Milesi-Ferretti. 2009. “Global Imbalances: In Midstream?” IMF Staff Position Note, December 22.
Brecht, M., Tober, S., Truger, A., and T. van Treeck. 2010. “Squaring the Circle in Euroland? Some remarks on the Stability Programmes 2010-13.” IMK Working Paper, March.
Hatzius, J. 2003. “The Private Sector Deficit Meets the GSFCI: A Financial Balances Model of the U.S. Economy.” Goldman Sachs, Global Economics Paper 98.
Council of the EU. 2007. “Council opinion of 27 March 2007 on the updated stability programme of Spain, 2006-2009.” Official Journal of the European Union, 2007/C
89/03. Last accessed on 25 Sep 2011 at:
http://eur-lex.europa.eu/LexUriServ/LexUriServ.do?uri=OJ:C:2007:089:0007:0010:EN:PDF. European Commission. 2010. “EU Economic Governance: The Commission Delivers a
Comprehensive Package of Legislative Measures.” Press Release. IP/10/1199. German SP. National Stability Programmes. 2011. Last accessed on 19 October 2011 at:
http://ec.europa.eu/economy_finance/economic_governance/sgp/convergence/progra mmes/2011_en.htm
Godley, W. 1992. “Maastricht and All That.” London Book Review 14 (19): 3–4.
Godley, W., Papadimitriou, D., Hannsgen, G., and G. Zezza. 2007. “The U.S. Economy Is There a Way Out of the Woods?” Strategic Analysis, 11/2007. Annandale-on-Hudson, NY: Levy Economics Institute of Bard College.
Hacker, B. and T. van Treeck. 2010. “What influence for European Governance.” International Policy Analysis. Friedrich Ebert Stiftung. December.
Horn, G., Joebges, H., and R. Zwiener. 2009. “From the Financial Crisis to the World Economic Crisis (II) Global Imbalances: Cause of the Crisis and Solution Strategies for Germany.” IMK Report 40/2009.
IMF, International Monetary Fund. 2009. “World Economic Outlook: Sustaining the Recovery.” October 2009.
IMF, International Monetary Fund. 2011. “World Economic Outlook: Tensions from the Two-Speed Recovery: Unemployment, Commodities, and Capital Flows.” April 2011.
Semieniuk, G., van Treeck, T., and A. Truger. 2011. “Nothing learned from the crisis? Some remarks on the Stability Programmes 2011-2014 of the euro area governments.” IMK Working Paper 12/2011.
Van Rompuy, Herman. 2010. “Report of the Task Force to the European Council.” 15302/10.
APPENDIX: METHOD FOR CALCULATING GROWTH CONTRIBUTIONS (TABLE 6)
As before, we define the three financial balances as (A1) PFB = Private financial balance = S – I,
(A2) GFB = Government financial balance = T – G – NTR,
(A3) FFB = Financial balance of the foreign sector = M – X – NIA. where
S = Private saving, I = Private investment,
T = Tax receipts including social security contributions, G = Final government expenditures in final goods,
NTR = Net transfers from the government to the private and foreign sectors (interest payments on public debt, social security benefits and subsidies, foreign aid, etc.), NIA = Net income received from abroad (including government and private transfers). We want to calculate the growth contributions of (C + I), G, and (X – M) between t and t + i. Because of GDP = C + I + G + (X – M),
the nominal growth contributions are given by
(A4) (ΔGDPt+i)/GDPt
= (ΔCt+i)/GDPt + (ΔIt+i)/GDPt + ΔGt+i/GDPt + [Δ(X – M)t+i]/GDPt.
We know PFBt, GFBt, FFBt, GDPt, Ct, It, Gt, (X – M)t (variables observed for t = 2009) and we make assumptions about PFBt+i, GFBt+i, FFBt+i, GDPt+i (for i = 1, 2, 3, 4), which are either based on SP projections, or implied by our assumptions in Table 6. Of course, we only
have to calculate the growth contributions of G and (X – M) from (A2) and (A3), and we will then also know the joint nominal growth contribution of (C + I) from (A4).
From (A3) it follows that
(A5) ΔFFBt+i/GDPt
= Δ(M – X)t+i/GDPt – ΔNIAt+i/GDPt
It seems reasonable to assume that11
(A6) ΔNIAt+i = 0
It would then follow that
(A7) Δ(X – M)t+i/GDPt = ΔFFBt+i/GDPt
In Table 6 of the main text, we assume that the foreign financial balance is reduced in four equal steps from 2010 to 2013.
Analogously, from (A2) it follows that
(A8) ΔGt+i/GDPt
= ΔTt+i/GDPt – ΔGFBt+i/GDPt– ΔNTR t+i/GDPt.
Based on the respective SPs’ assumption about the growth of G itself, we can directly calculate ΔGt+i/GDPt.
In order to arrive at the real growth contributions depicted in Table 6, we further assume that the price deflator increases at the same rate for all GDP components.
11 Given rebalancing in order to reduce a current account surplus, it seems reasonable to assume that this would
Figure 1: Arithmetic average of real growth contributions from 1999 to 2007 in percentage
points for euro area countries
Figure 2: Financial balances in per cent of GDP and real GDP growth rate from 1995 to 2010
for eight countries
France Italy
Germany Netherlands
Greece Portugal
Ireland Spain
Figure 3: Current account and net exports in per cent of GDP from 1995 to 2010 for eight countries France Italy Germany Netherlands Greece Portugal Ireland Spain
Figure 4: Financial balances in per cent of GDP (scale on left ordinate) and real GDP growth
rate (scale on right ordinate) from 2008 to 2014, once as forecast of the 2010 Stability Pro-grammes, once as forecast of the 2011 Stability Programmes for eight countries
France 2010 France 2011
Germany 2010 Germany 2011
Greece 2010 Greece 2011
Italy 2010 Italy 2011
Netherlands 2010 Netherlands 2011
Portugal 2010 Portugal 2011
Spain 2010 Spain 2011
Source: AMECO (update May 2010) and Stability Programmes 2010–13; AMECO (update May 2011) and Stability Programmes 2011–14
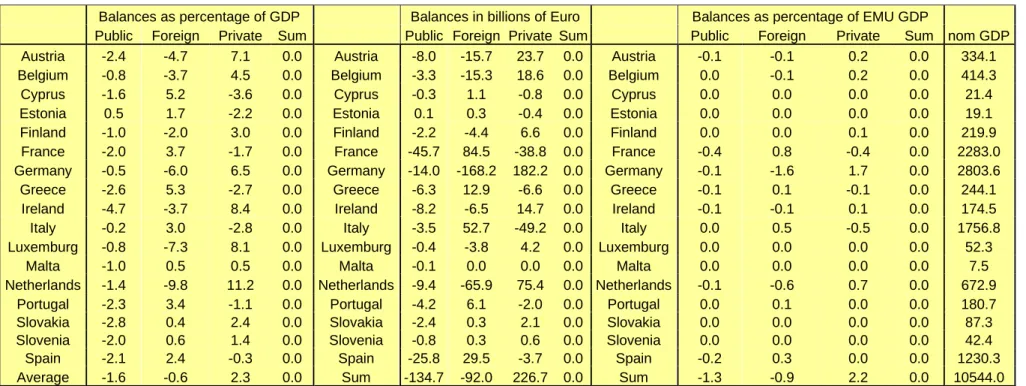
33 Table 1a): Financial balances for 2007 of euro area countries
Balances as percentage of GDP Balances in billions of Euro Balances as percentage of EMU GDP
Public Foreign Private Sum Public Foreign Private Sum Public Foreign Private Sum nom GDP
Austria -0.9 -4.0 4.9 0.0 Austria -2.4 -10.9 13.2 0.0 Austria 0.0 -0.1 0.1 0.0 272.0
Belgium -0.3 -3.9 4.2 0.0 Belgium -1.0 -13.2 14.2 0.0 Belgium 0.0 -0.1 0.2 0.0 335.1
Cyprus 3.4 11.6 -15.0 0.0 Cyprus 0.5 1.8 -2.4 0.0 Cyprus 0.0 0.0 0.0 0.0 15.9
Estonia 2.5 17.2 -19.7 0.0 Estonia 0.4 2.7 -3.1 0.0 Estonia 0.0 0.0 0.0 0.0 15.8
Finland 5.2 -4.2 -1.0 0.0 Finland 9.3 -7.6 -1.8 0.0 Finland 0.1 -0.1 0.0 0.0 179.7
France -2.7 2.2 0.5 0.0 France -51.6 42.0 9.6 0.0 France -0.6 0.5 0.1 0.0 1895.3
Germany 0.3 -7.6 7.4 0.0 Germany 6.6 -185.9 179.4 0.0 Germany 0.1 -2.1 2.0 0.0 2432.4
Greece -6.4 15.6 -9.2 0.0 Greece -14.5 35.3 -20.8 0.0 Greece -0.2 0.4 -0.2 0.0 227.1
Ireland 0.1 5.5 -5.6 0.0 Ireland 0.1 10.4 -10.6 0.0 Ireland 0.0 0.1 -0.1 0.0 189.4
Italy -1.5 1.8 -0.3 0.0 Italy -23.5 28.1 -4.6 0.0 Italy -0.3 0.3 -0.1 0.0 1546.2
Luxemburg 3.7 -10.1 6.4 0.0 Luxemburg 1.4 -3.8 2.4 0.0 Luxemburg 0.0 0.0 0.0 0.0 37.5
Malta -2.4 5.6 -3.2 0.0 Malta -0.1 0.3 -0.2 0.0 Malta 0.0 0.0 0.0 0.0 5.5
Netherlands 0.2 -8.4 8.2 0.0 Netherlands 1.0 -48.1 47.0 0.0 Netherlands 0.0 -0.5 0.5 0.0 571.8
Portugal -3.1 10.2 -7.0 0.0 Portugal -5.3 17.2 -11.9 0.0 Portugal -0.1 0.2 -0.1 0.0 169.3
Slovakia -1.6 5.6 -4.0 0.0 Slovakia -1.0 3.5 -2.5 0.0 Slovakia 0.0 0.0 0.0 0.0 61.6
Slovenia -0.1 4.5 -4.4 0.0 Slovenia 0.0 1.6 -1.5 0.0 Slovenia 0.0 0.0 0.0 0.0 34.6
Spain 1.9 10.0 -11.9 0.0 Spain 20.1 105.3 -125.4 0.0 Spain 0.2 1.2 -1.4 0.0 1053.5
Average -0.1 3.0 -2.9 0.0 Sum -60.1 -21.1 81.2 0.0 Sum -0.7 -0.2 0.9 0.0 9042.5
34 Table 1b): Financial balances for 2010 of euro area countries
Balances as percentage of
GDP Balances in billions of Euro
Balances as percentage of EMU GDP
Public Foreign Private Sum Public Foreign Private Sum Public Foreign Private Sum nom GDP
Austria -4.6 -3.2 7.8 0.0 Austria -13.2 -9.0 22.2 0.0 Austria -0.1 -0.1 0.2 0.0 284.0
Belgium -4.1 -2.7 6.8 0.0 Belgium -14.4 -9.5 23.8 0.0 Belgium -0.2 -0.1 0.3 0.0 352.3
Cyprus -5.3 9.3 -4.0 0.0 Cyprus -0.9 1.6 -0.7 0.0 Cyprus 0.0 0.0 0.0 0.0 17.5
Estonia 0.1 -2.8 2.7 0.0 Estonia 0.0 -0.4 0.4 0.0 Estonia 0.0 0.0 0.0 0.0 14.5
Finland -2.5 -2.8 5.2 0.0 Finland -4.4 -5.0 9.4 0.0 Finland 0.0 -0.1 0.1 0.0 180.3
France -7.0 3.5 3.6 0.0 France -136.5 67.3 69.2 0.0 France -1.5 0.7 0.8 0.0 1947.6
Germany -3.3 -5.1 8.3 0.0 Germany -81.6 -126.6 208.2 0.0 Germany -0.9 -1.4 2.3 0.0 2498.8
Greece -10.5 11.8 -1.3 0.0 Greece -24.2 27.1 -2.9 0.0 Greece -0.3 0.3 0.0 0.0 230.2
Ireland -32.4 0.7 31.7 0.0 Ireland -49.9 1.1 48.8 0.0 Ireland -0.5 0.0 0.5 0.0 153.9
Italy -4.6 4.2 0.4 0.0 Italy -71.2 65.0 6.2 0.0 Italy -0.8 0.7 0.1 0.0 1548.8
Luxemburg -1.7 -7.8 9.5 0.0 Luxemburg -0.7 -3.3 4.0 0.0 Luxemburg 0.0 0.0 0.0 0.0 41.6
Malta -3.6 4.1 -0.5 0.0 Malta -0.2 0.3 0.0 0.0 Malta 0.0 0.0 0.0 0.0 6.2
Netherlands -5.4 -6.7 12.2 0.0 Netherlands -32.0 -39.9 71.9 0.0 Netherlands -0.3 -0.4 0.8 0.0 591.5
Portugal -9.1 9.8 -0.7 0.0 Portugal -15.8 16.9 -1.1 0.0 Portugal -0.2 0.2 0.0 0.0 172.5
Slovakia -7.9 2.9 5.0 0.0 Slovakia -5.2 1.9 3.3 0.0 Slovakia -0.1 0.0 0.0 0.0 65.9
Slovenia -5.6 0.9 4.7 0.0 Slovenia -2.0 0.3 1.7 0.0 Slovenia 0.0 0.0 0.0 0.0 36.1
Spain -9.2 4.5 4.7 0.0 Spain -98.2 48.0 50.2 0.0 Spain -1.1 0.5 0.5 0.0 1062.6
Average -6.9 1.2 5.7 0.0 Sum -550.5 36.0 514.4 0.0 Sum -6.0 0.4 5.6 0.0 9204.3
35
Table 2: Exports of eight euro area countries to each other, China, the UK, US, as percentage of total exports and total exports as percentage of GDP (last column)
a) 2007
China
Euro
area Eu 27 France Germany Greece Ireland Italy
Nether-lands Portugal Spain UK US Exports/GDP
France 2.2 50.7 64.9 0.0 15.3 0.9 0.7 8.9 4.1 1.2 9.3 8.1 6.1 29.5 Germany 3.1 43.8 64.5 9.5 0.0 0.8 0.6 6.7 6.5 0.9 4.9 7.2 7.6 54.4 Greece 0.6 44.2 64.9 4.2 11.5 0.0 0.3 10.8 2.0 0.7 3.4 5.4 4.1 10.4 Ireland 1.5 41.2 63.4 5.8 7.4 0.5 0.0 3.6 4.0 0.5 3.7 18.8 17.8 64.2 Italy 1.7 46.1 60.8 11.5 12.9 2.1 0.5 0.0 2.4 1.0 7.5 5.8 6.6 32.4 Netherlands 0.9 61.0 78.0 8.5 24.4 0.7 0.9 5.1 0.0 0.7 3.6 9.1 4.3 96.5 Portugal 0.5 67.0 77.0 12.6 12.9 0.4 0.5 4.2 3.5 0.0 28.7 6.0 4.7 31.0 Spain 1.2 57.4 70.3 18.9 10.8 1.2 0.6 8.9 3.3 8.7 0.0 7.8 4.0 23.9 b) 2010 China Euro
area Eu 27 France Germany Greece Ireland Italy
Nether-lands Portugal Spain UK US Exports/GDP
France 2.8 49.2 62.0 0.0 16.4 0.7 0.5 8.2 4.2 1.1 7.6 6.8 5.1 26.2 Germany 4.8 43.0 63.3 10.0 0.0 0.6 0.5 6.4 6.9 0.8 3.8 6.5 5.4 48.3 Greece 0.9 43.2 63.2 3.9 10.9 0.0 0.2 10.9 2.3 0.7 2.4 5.3 4.0 9.2 Ireland 1.8 41.1 60.3 5.3 8.1 0.4 0.0 3.2 3.6 0.5 3.9 16.1 22.1 72.9 Italy 2.5 44.2 58.1 11.8 13.2 1.6 0.3 0.0 2.5 1.0 5.9 5.5 5.8 28.5 Netherlands 1.2 62.2 77.8 9.2 26.0 0.6 0.7 4.9 0.0 0.8 3.4 7.7 3.8 96.0 Portugal 0.6 64.7 74.6 11.9 13.1 0.3 0.3 3.8 3.8 0.0 26.8 5.5 3.5 28.1 Spain 1.4 56.8 68.2 18.7 10.7 0.9 0.4 9.0 3.2 9.1 0.0 6.3 3.3 22.7 Source: Ecowin
36
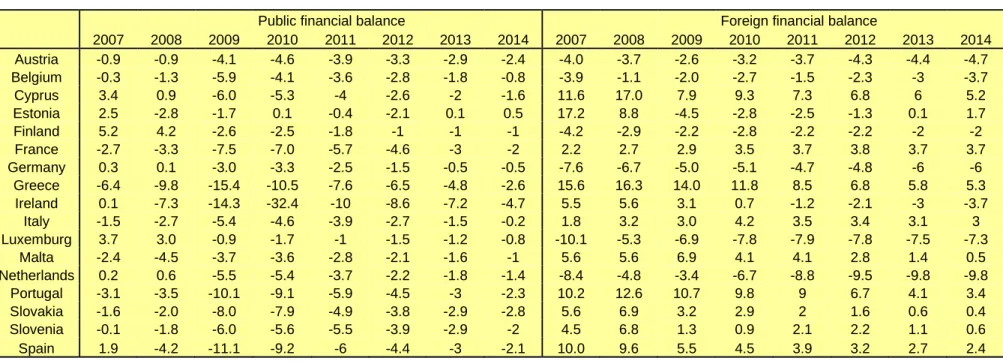
Table 3: Public and foreign balances in per cent of GDP from 2008 to 2014 for euro area countries as projected in the 2011 Stability Programmes
Public financial balance Foreign financial balance
2007 2008 2009 2010 2011 2012 2013 2014 2007 2008 2009 2010 2011 2012 2013 2014 Austria -0.9 -0.9 -4.1 -4.6 -3.9 -3.3 -2.9 -2.4 -4.0 -3.7 -2.6 -3.2 -3.7 -4.3 -4.4 -4.7 Belgium -0.3 -1.3 -5.9 -4.1 -3.6 -2.8 -1.8 -0.8 -3.9 -1.1 -2.0 -2.7 -1.5 -2.3 -3 -3.7 Cyprus 3.4 0.9 -6.0 -5.3 -4 -2.6 -2 -1.6 11.6 17.0 7.9 9.3 7.3 6.8 6 5.2 Estonia 2.5 -2.8 -1.7 0.1 -0.4 -2.1 0.1 0.5 17.2 8.8 -4.5 -2.8 -2.5 -1.3 0.1 1.7 Finland 5.2 4.2 -2.6 -2.5 -1.8 -1 -1 -1 -4.2 -2.9 -2.2 -2.8 -2.2 -2.2 -2 -2 France -2.7 -3.3 -7.5 -7.0 -5.7 -4.6 -3 -2 2.2 2.7 2.9 3.5 3.7 3.8 3.7 3.7 Germany 0.3 0.1 -3.0 -3.3 -2.5 -1.5 -0.5 -0.5 -7.6 -6.7 -5.0 -5.1 -4.7 -4.8 -6 -6 Greece -6.4 -9.8 -15.4 -10.5 -7.6 -6.5 -4.8 -2.6 15.6 16.3 14.0 11.8 8.5 6.8 5.8 5.3 Ireland 0.1 -7.3 -14.3 -32.4 -10 -8.6 -7.2 -4.7 5.5 5.6 3.1 0.7 -1.2 -2.1 -3 -3.7 Italy -1.5 -2.7 -5.4 -4.6 -3.9 -2.7 -1.5 -0.2 1.8 3.2 3.0 4.2 3.5 3.4 3.1 3 Luxemburg 3.7 3.0 -0.9 -1.7 -1 -1.5 -1.2 -0.8 -10.1 -5.3 -6.9 -7.8 -7.9 -7.8 -7.5 -7.3 Malta -2.4 -4.5 -3.7 -3.6 -2.8 -2.1 -1.6 -1 5.6 5.6 6.9 4.1 4.1 2.8 1.4 0.5 Netherlands 0.2 0.6 -5.5 -5.4 -3.7 -2.2 -1.8 -1.4 -8.4 -4.8 -3.4 -6.7 -8.8 -9.5 -9.8 -9.8 Portugal -3.1 -3.5 -10.1 -9.1 -5.9 -4.5 -3 -2.3 10.2 12.6 10.7 9.8 9 6.7 4.1 3.4 Slovakia -1.6 -2.0 -8.0 -7.9 -4.9 -3.8 -2.9 -2.8 5.6 6.9 3.2 2.9 2 1.6 0.6 0.4 Slovenia -0.1 -1.8 -6.0 -5.6 -5.5 -3.9 -2.9 -2 4.5 6.8 1.3 0.9 2.1 2.2 1.1 0.6 Spain 1.9 -4.2 -11.1 -9.2 -6 -4.4 -3 -2.1 10.0 9.6 5.5 4.5 3.9 3.2 2.7 2.4