Fast automatic classification in extremely large data sets:
the RANK approach
Thierry Van de Merckt [email protected]
Vadis Consulting 1070 Brussels, Belgium
Jean-François Chevalier [email protected]
Vadis Consulting 1070 Brussels, Belgium
Philip Smets [email protected]
Vadis Consulting 1070 Brussels, Belgium
Olivier Van Overstraeten [email protected]
Vadis Consulting 1070 Brussels, Belgium
Editor: Gideon Dror, Marc Boullé, Isabelle Guyon, Vincent Lemaire, David Vogel Abstract
This paper presents VADIS’s built-in RANK solution to cope with very large classification problems. This software embeds and automates many important tasks that must be done to provide a good solution for predictive modeling projects, especially when many variables and many lines are present in the data set. This software is not an open toolbox like many other data mining tools. On the contrary it is built to implement a very strict methodology which combining Machine Learning and Statistical Inference theory. On this KDD Cup problem, RANK is particularly at ease: it was possible to build a model for each of the three tasks in a few hours. Then the team spent some days to improve the expected prediction quality using the 10% test set evaluation of the KDD cup submission process. We have worked 7 man-days to gain just a fraction of the initial quality, allowing being in the top winners, but at a cost that is economically not justified.
Keywords: Feature selection, Massive modeling, Classification, regression, very large databases.
1 Introduction
The KDD09 cup this year presents a typical problem for commercial data mining: facing many variables, and different targeted behaviors, how can we quickly build a good solution for all problems, taking into account the specificity of each of them, with limited resources in time, man and machine. This is exactly the kind of problems many data miners are facing in their day-to-day life. The challenge, however is not 100% like a real life case because (1) business understanding of the variables at hand is a very important factor for model optimization, and this was not available; (2) the number of lines was just 50k which is not realistic for real life models where at least 200k or more than 1 million lines are most common; and (3) because the 10% test set feed-back is not available when preparing real life models, unless some tests are performed at a high cost of time and money.
VAN DE MERCKT AND CHEVALIER
However, this challenge allows to spot that many Analytical CRM (Customer Relationship Management) problems can be solved using simple yet well organized methodological steps. In most of our projects we are confronted with these kinds of problems and hence, four years ago we started developing a completely new software that follows a radically different approach from what is seen on the market. While big players compete on the number of available algorithms and components to be assembled, we have taken the opposite route of proposing a single way to best solve CRM class of scoring problems. We do not pretend that RANK method produce the best model each time. However, we are quite sure that it drives the modeling process to a very good solution in a fraction of the time necessary to build one with classical toolboxes. This strategy is rooted into the following observations, issued from many years of modeling projects:
1) What makes the difference between a good – or excellent – and a medium or bad model is the way data is understood by the data miner, mapped with the business problem to solve, and prepared accordingly. As a consequence it is better to spend time and deploy energy on the business side of the problem than on combining many different possible techniques;
2) In the kind of problems that scoring solves in the CRM area, it is very unlikely that highly non-linear techniques improve the quality of predictions. These problems are characterized by many weak variables, high inter-variables correlation, and noisy targets – most of the time the target is a human decision and hence just a faction of the influencing factors are available in data sets. Hence noise overfitting is a common trap that must be avoided;
3) In commercial organizations, building scoring models is done with scarce budget and human resources and the time pressure is high. It might take years for a team to build a good practice and to develop a valid methodology that will make the job the right way from a business and statistical point of view. Why then overloading teams with many possibilities that will never be exploited? Why not focusing on efficiency and good practices embedding?
4) More and more marketers ask their teams higher level of flexibility, responsivity and scaling. We are not talking about one model per months but maybe 100 models to be used, re-build, maintained, and scored every week. Applying a consistent methodology across all models for the construction as well as for the production phases is a key issue. Open architectures can damage the efficiency of the whole data mining team. Our approach is like proposing pre-built LaTeX styles instead of MS Word open templates that will soon flourish with different flavors following the fantasy of each user…
These considerations have led the development of RANK. It builds models using proven methodological steps, allowing the user to influence the outcome through a set of parameters, at a very high speed, leaving rooms for analyzing the problems and the results with the business stakeholders, and using a well documented and robust practice.
2 RANK method
RANK focuses on saving time to the user by automatically performing many important modeling steps like variable recoding, sampling, variable selection and pruning, statistical evaluation of the choices of parameters, probability computation, etc. It is also designed so as to produce robust models, that is, models which estimated performance on the training set will be reproduced as close as possible on fresh data. Noise overfitting is a main concern of the methodological steps included in RANK, and this is why it uses Linear Regression methods.
2.1 Feature space preparation
The first thing to do is the transform the initial feature space into a more relevant one for the classification task at hand. This phase is done automatically by RANK. It analyses the structure
compress the information without losing relevant information.
2.1.1 Variable Recoding
The recoding of variables is an extremely important and time-consuming step in the modeling process. RANK has been extensively developed in order to automate the variable recoding according to different schema depending on the variable type. Many possible recoding are available and in most cases, all of them will be automatically computed by RANK. It’s during model construction that one of them will be chosen against the others for a single variable. The types of recoding are the following:
• For Nominal variables – Modalities will be converted to a numeric value that is related to its relation with the target density. This recoding is known under the name "weight of evidence recoding" [3]. Modalities can also be recoded using dummy variables.
• For Numerical variable – There are two possibilities: simple normalization of the variables or binning of the variable using a proprietary algorithm ('intelligent quantiles') and then treated as nominal variables with order. The intelligent quantiles analyses the distribution of a variable in order to identify most relevant quantiles. In this mode, sudden jumps in the distribution produce dummy variables.
The recoding performed by RANK has two major effects:
• The first one is to get rid of the problem of non-normal distributions that should be a basic assumption when using regression models. The recoding will remove the dissymmetry and make the data more suitable for regression models.
• The second effect is that the recoding allows RANK to spot non-linear relationships of a variable with the target, thus improving the expression power of the model. In fact the recoding allows moving from the initial feature space into a new linearized one, where linear methods will be applied.
2.1.2 Modality Grouping
RANK automatically analyzes all variables along their cardinality. If a nominal variable has many modalities, it will group them in a way that each grouped modality becomes significant. For example, if a Zip code contains 30.000 modalities, only the modalities that are significant will be left as they are. The others will be grouped in a default modality. The grouping will preserve the order relationship in a variable if any. For example, for an ordinal variable like 'number of sms sent', RANK will group only modalities that are adjacent, and will possibly create many grouping modalities.
2.1.3 Missing value
RANK treats missing values in a very careful way. Depending on the type of variable, it will recode missing values in a way such that its effect on the computed score is null. This ensures that the model focuses only on relevant information for the prediction.
2.2 Variable Selection
When the number of variables is high, RANK starts with a forward selection technique based on a highly optimized implementation of the LARS algorithm with LASSO modification of Efron, Hastie, Johnstone & Tibshirani (2004). This method, being greedy, in general selects too much variables with redundant coverage. However, it provides a good initial set of variables in a fast way for the pruning phase.
The backward pruning in RANK is built-in algorithm that tries to remove as many variables as possible using a greedy algorithm. It removes a variable if its removal as no effects or a positive effect on the AUC of the model – which is computed for each variable selection using a
VAN DE MERCKT AND CHEVALIER
cross-validation technique. The Cross-validation for pruning is possible due to the fact that RANK load the whole data set in RAM, using proprietary compression algorithms.
2.3 Robust Regression
RANK uses linear models on the transformed feature space. It is design so as to avoid overfitting and compute the more simple models as possible, using the minimum set of recoded variables.
2.3.1.1 Ridge regression
The regression engine of RANK uses the so-called 'Ridge' regression introduced by Hoerl and Kennard (1970) and Andre Tikhonov (1977), and further developed by M.J.L. Orr (1995). It adds a regulation term to the normal equation, which improves the robustness of the models as well as improving the usage of nominal variables with a lot of modalities, likes zip codes.
2.3.1.2 Cross-Validation & Bootstrap
RANK extensively uses cross-validation technique (Kohavi 1995) when building a model in order to evaluate which recoding is best, to select best variables, etc. This is extremely useful when the target density is very low, which is 90% the case in real life projects. Cross-validation and bootstrap are not only relevant for building a robust models, they are also important for the analyst to observe the volatility of the model quality.
2.3.1.3 Probability Estimation
The output of RANK is not just a score. It also gives for each record the best estimation of the response probability, based on the model score function and the a priori probability of the target in the data file.
2.4 Speed & memory management
In order to extensively use cross-validation and bootstrap sampling, RANK stores all training data in the RAM of the computer.
2.4.1 Speed
Currently, inside many applications, the bottleneck for high-performance-computing is the relatively slow data access. RANK stores all the data required for the computation of the model inside the RAM of the computer. It uses an advanced proprietary compression technique allowing gaining the same order as ZIP gains on pure ASCII files. For the KDD09 Cup, the flat csv file compressed with GZIP is about 250MB. When data is loaded in the RAM by RANK it takes 280MB. It uses advanced memory manager techniques optimizing memory consumption. Thanks to this strategy, the time required to access the data is minimized, allowing to easily and reliability performs multiple-pass model-computations.
RANK is optimized to obtain a high “locality” of the computation, meaning that the data needed to perform a large part of the computations are inside the cache (L1 and L2) of the processor. Much regression software are not optimized along this dimension, and are thus losing the locality effect of their computations. This optimization divides the computing time by roughly ten compared to a classical implementation.
Speed improvement has a direct influence on models quality. Indeed, in the same time frame, RANK can do more computation than much other modeling software and provides thus more accurate models, by the ability to effectively use cross-validation techniques, at all levels of modeling steps, including variable pruning.
RAM usage, it is possible to let RANK know that a sample must be taken. The analyst can specify the number of records he wants to load, or a percentage of them, or he can specify a maximum RAM usage, like 250MB. In that later case, RANK will load a maximum of records in 250MB, taken randomly. If the target density is altered by the sampling RANK will automatically remove this bias when it computes the probability function.
It should be noted that due to the advanced compression technique used to load data in memory, sampling would rarely be used to overcome memory consumption limits. It will be used mainly to speed up the first stages of the modeling process when run on very large data sets.
Figure 1. Rank JAVA Interface
3 The KDD challenge
We started by creating the KDD Cup data universe, which build from the csv file, a meta data file describing the type of the variables, the desired recodings (by default all of them), and other parameters that could influence the creation of the transformed feature space.
Once this Meta data file is ready the Java interface gives the user the ability to modify most important parameters for building the model. It concerns:
• The data portioning schema: number of folds for cross validation and sampling if necessary:
• Forward and backward parameters
• Prior selection of variables: ignore variable, Force to keep in model, missing treatment;
• Selection o a segmented population for the training set (unused for KDD cup) • Definition of Target: list if id, variable, selection;
• Advanced: output definition • Build model and Apply model
For the first run, as usually, we kept all defaults parameters. For all models we used a 4 fold cross-validation technique for the estimation of the quality of the variables and the set-up of the
VAN DE MERCKT AND CHEVALIER
model parameters. An automatic bootstrap sample of 2000 data sets were used to assert the confidence intervals of the models predictions, no sampling was ever used during the leaning phase (remember that the whole data fit in 280 MG Ram). The following table shows some interesting results.
Table 1. Default parameters results
The table shows that Appetency and Upselling were two simple models to compute, in 20’ and 31’ respectively, selecting 13 and 11 variables and producing a Quality of .7442 and .7868 on the whole training data and .712 and .7838 on the validation sets. Models are already good in performance and quite stable. Churn is more difficult to learn: its performance is only .5166 with some loss on the validation sets, and it keeps more variables (27), which is high according to our standards. Obviously this model must be worked on.
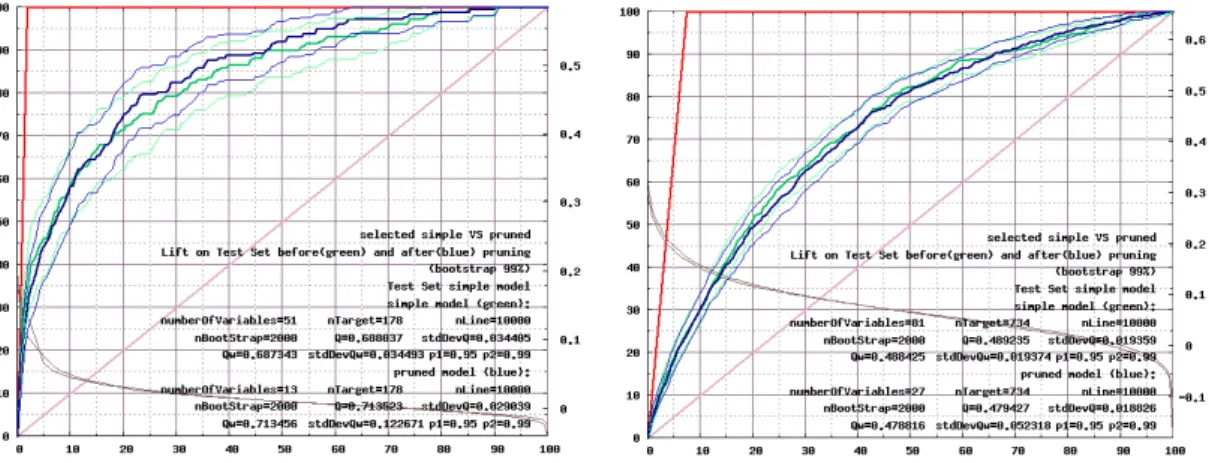
The following figure shows one of the graphs that RANK outputs. It shows the cumulative gain charts on the average training and validation sets with their confidence interval, computed out of 2000 bootstrap samples. We can observe that Appetency exhibits some variance, while Churn is more stable. All this computations are fully automatic. All models were ready at the end of the first day of the Fast challenge.
Figure 2. Cumulative Gain charts for the Appetency and Churn problems
Models
Cross Validation
N-Folds Boostraps # targets
Target density Time to compute model in minutes # initial variables # variables after Forward selection # variables after Pruning Quality on Training Quality on validation Appetency 4 2000 890 1.78% 20.57 13,975 51 13 0.7442 0.712 Churn 4 2000 3,672 7.34% 50.00 13,975 81 27 0.5166 0.4778 Upselling 4 2000 3,682 7.36% 31.65 13,975 36 11 0.7868 0.7838
Using the 10% test set evaluation, we then started to try to improve our results. Some parameters are available in order to decrease model variance, or augment the granularity of the recoding. After one day of test, we quickly reached the best models available within a standard usage of RANK.
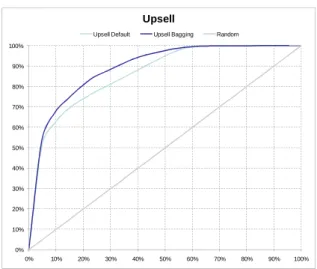
We saw that the differences between us and some teams better ranked in the list was so small that it could possibly be related to sampling issues of the 10% test set. Our strategy was then to try to reduce the influence of chance on our position in the top list, and we started working into two directions: (1) split of the population according to some variables showing major differences in their modalities w.r.t. the target relation, in order to segment the models and (2) usage of a bagging method in order to reduce as much as possible the variance of the predictions (Breiman, 1996). After three days of efforts, we finally improved slightly the performance on the 10% test set of the KDD Cup for Appentency and Upselling problems. Figure 4 shows the comparing Charts.
As we can see, the major positive effect occurs on the Appetency problem for which the variance was the highest among all models. For the churn, as expected because of the low variance of the models, the gain was minor. On these sets of models, in the fast track we were positioned 16th team out of 257. 0% 10% 20% 30% 40% 50% 60% 70% 80% 90% 100% 0% 10% 20% 30% 40% 50% 60% 70% 80% 90% 100% Appetency
Appetency Default Appetency Bagging Random
0% 10% 20% 30% 40% 50% 60% 70% 80% 90% 100% 0% 10% 20% 30% 40% 50% 60% 70% 80% 90% 100% Churn
VAN DE MERCKT AND CHEVALIER
Figure 4. Cumulative Gain charts of Improved model
4 Conclusion
This challenge has convinced us once again that a good method like the one implemented in RANK, based on reliable statistical and machine learning techniques, can do a very good job for most of the problems in the CRM area, as far as classification is concerned. Many companies today suffer from the lack of adequate human resources to massively implement predictive modeling in their decision processes. And our conviction is that most of the software editors do not help. They propose tools for the small number of research students that once in the real life do not have time to cope with all business problems they face. For the other less educated in statistical inference and machine learning people, these tools are too complex. Our position is to defend an approach were the user interaction with the statistical steps is minimized, leaving time for understanding the business issues, and making sure the business leverage of the models is in place. After the first day of work, we had a solution that would today rank in the 22th position. We won 6 positions with an improvement of less than 1% of AUC in average, by spending an additional 7 man days. This is not economically a valid proposition.
References
B. Efron, T. Hastie, I. Johnstone and R. Tibshirani, Least Angle Regression, The Annals of
statistics, Vol 32, No 2, 407-499, 2004.
A. E. Hoerl and R. Kennard, Ridge regression: biased estimation for nonorthogonal problems,
Technometrics 12: 55-67, 1970.
EP Smith, I. Lipkovich, K. Ye, Weight of Evidence (WOE): Quantitative estimation of probability of impact. Blacksburg, VA: Virginia Tech, Department of Statistics; 2002.
A.N. Tikhonov and V.Y. Arsenin, Solutions of Ill-Posed Problems. Winston, Washington, 1977. M.J.L. Orr, Regularisation in the Selection of Radial Basis Function Centres. Neural
Computation, 7(3):606-623, 1995.
Ron Kohavi, A study of cross-validation and bootstrap for accuracy estimation and model selection. In Proceedings of the Fourteenth International Joint Conference on Artificial
Intelligence 2 (12): 1137–1143. (Morgan Kaufmann, San Mateo), 1995.
L. Breiman, Bagging predictors, Machine Learning, 24(2), 123-140, 1996
0% 10% 20% 30% 40% 50% 60% 70% 80% 90% 100% 0% 10% 20% 30% 40% 50% 60% 70% 80% 90% 100% Upsell