Private Sector Education
in Pakistan
in Pakistan
Private Sector Education in Pakistan: Mapping and Musing
Published by:
Institute of Social and Policy Sciences (I-SAPS) House 13, Street 1, G-6/3, Islamabad, Pakistan Tel: 0092-51-111739739; Fax: 0092-51-2825336 E-mail: [email protected]; Website: www.i-saps.org
with the support of:
Department for International Development (DFID)
ISBN: 978-969-9393-05-1 © 2010 I-SAPS, Islamabad
Designed by: CUBIC MEDIA NET
The information and interpretations of the facts expressed in the study are those of I-SAPS and do not necessarily reflect the views of DFID or any other organization. Reproduction is authorized (except for commercial purposes) provided the source is acknowledged. v vii ix 01-03 05-10 11-16 17-21 23-26 27-33 35-41 43-48 49-52 53-65
iii
I-S
A
P
S
P
u
b
lic
a
ti
o
n
s
List of Tables List of Figures Acronyms IntroductionSection 1: The Rise of Private Education: Size and Growth Section 2: Financing of Private Education
Section 3: Diversity in Private Education Section 4: Quality of Teaching and Learning Section 5: Public-Private Partnerships Section 6: Regulation of Private Education Summary and Conclusions
Bibliography
Annex A: Statistical Tables
v
I-S
A
P
S
P
u
b
lic
a
ti
o
n
s
Table 1.1: Number of Educational Institutions: Public versus Private
Table 1.2: Number of Teachers in Private Schools
Table 1.3: Enrolment in Schools: Public versus Private
Table 1.4: Growth of Enrolment in Private Schools by Gender
Table 5.1: Types of PPP Programmes of National and Provincial Education
Foundations (As in March 2010)
Table 5.2: Quality Assurance in PPP Interventions of Education Foundations
(As in March 2010)
Table A1: Number of Educational Institutions
Table A2: Number of Private Educational Institutions by Gender
Table A3: Number of Private Educational Institutions by Location
Table A4: Number of Private Educational Institutions by Region
Table A5: Number of Teachers in Private Schools
Table A6: Enrolment in Educational Institutions: Public versus Private
Table A7: Enrolment in Private Educational Institutions by Gender
Table A8: Enrolment in Private Educational Institutions by Location
Table A9: Enrolment in Private Educational Institutions by Region
LIST OF TABLES
02 06 07 09 31 32 55 56 57 58-59 60 61 62 63 64-65vii
I-S
A
P
S
P
u
b
lic
a
ti
o
n
s
Figure 1.1: Distribution of Institutions by Level (2007-08)
Figure 1.2: Growth of Single-Sex and Mixed Private Educational Institutions (1999-2000 to 2007-08)
Figure 1.3: Growth of Private Educational Institutions by Location (1999-2000 to 2007-08)
Figure 1.4: Distribution of Private Educational Institutions by Region (2007-08) Figure 1.5: Educational Institutions by Region: Public-Private Mix (2007-08) Figure 1.6 Growth of Enrolment in Public and Private Educational Institutions Figure 1.7: Public-Private Mix in Enrolment by Region (2007-08)
Figure 1.8: Enrolment in Private Educational Institutions by Location Figure 2.1 Investment, Receipts and Expenditure of Private Educational
Institutions (1999-2000)
Figure 2.2: Distribution of Expenditure of Private Educational Institutions Figure 2.3: Grants-in-Aid to Private Education Sector
Figure 5.1: Public Financing – Private Provision: Budgetary Allocations for Education Foundations
Figure 5.2 Variation in Balochistan Education Foundation's Average Grant-in-Aid per School 03 04 04 05 06 08 08 09 14 15 16 30 33
ix
I-S
A
P
S
P
u
b
lic
a
ti
o
n
s
AEPAM Academy for Educational Planning and Management AJK Azad Jammu and Kashmir
DFID Department for International Development EMIS Education Management Information System
FANA Federally Administered Northern Areas (now Gilgit-Baltistan) FATA Federally Administered Tribal Areas
ICT Islamabad Capital Territory
I-SAPS Institute of Social and Policy Sciences
KPK Khyber Pakhtunkhwa province (formerly NWFP)
LEAPS Learning and Educational Achievement in Pakistan Schools MDGs Millennium Development Goals
NEAS National Educational Assessment System
NEMIS National Education Management Information System NEMIS National Education Management Information System NRSP National Rural Support Programme
PEC Punjab Examination Commission PETF Pakistan Education Task Force PPPs Public-private Partnerships
PSLM Pakistan Social and Living Measurements Standards Survey
ACRONYMS
1
These figures are derived from; Federal Bureau of Statistics, Ministry of Economic Affairs and Statistics, Census of Private Educational Institutions in Pakistan 1999-2000, Islamabad , and AEPAM, Ministry of Education, Pakistan Education Statistics 2007-08,Islamabad, 2009. A fuller analysis of the rise of private sector education is given in
Section 1 of this study.
01
I-S
A
P
S
P
u
b
lic
a
ti
o
n
s
Over the past decade, private sector has emerged as a key provider of education services in Pakistan both in absolute terms and relative to the public sector. One piece of evidence relates to the number of private schools, which increased by 69%, as compared to mere 8% increase of government schools between 1999-2000 and 2007-08. In 2000, the private sector was catering to the educational needs of about 6 million children. This number increased to 12 million in 2007-08 – equivalent to 34 percent of total enrolment. The number of teachers also doubled in private
1
educational institutions during this period . This massive growth has thrown up many important questions. What has caused the private education institutions to grow so rapidly? How is public schooling affected by this growth? Should the government strictly regulate the private providers of education? To what extent are public-private partnerships effective for meeting the growing demand for education? Are the private schools providing better quality of learning than the government schools? To answer such questions and the like is crucial for identifying the emerging challenges and formulating effective responses and strategies at the policymaking and implementation levels.
The growth of private schools, especially of the low-fee schools, has forced education policymakers and analysts to take cognizance of the promises as well as challenges emanating from this development. While many see the role of the state as the traditional provider of educational services as natural and irreplaceable, a growing number of commentators, both within Pakistan and internationally, favor a laissez faire policy for the private sector to emerge as a key provider of education and argue that the state should not compete with private schools. While the role of the state as the financer and provider of education remains a matter of debate and controversy, the growth of private provision of education is widely interpreted by many as evidence of the parents' lack of faith in the capacity of public sector to
Introduction
03
I-S
A
P
S
P
u
b
lic
a
ti
o
n
s
The study is organized into six sections. The first section describes the expansion of private education in terms of changes in number of institutions, teachers and enrolment between 1999-2000 and 2007-08 and draws key inferences. The second section argues that private sector education is not a homogenous category. It sheds light on different facets of diversity which characterize the private education marketplace in Pakistan. The third section deals with financing of private education. It presents evidence on trends and patterns in government's financing of private education and out-of-pocket expenditure. The fourth section examines the issues concerned with quality of teaching and learning in private schools. The fifth section discusses public-private partnerships as the instruments to promote and support private sector participation in education. The sixth section reviews arguments for and against the regulation of private schools along with a case study of regulation regime for private schools in Islamabad Capital Territory (ICT). The study concludes with a discussion of the policy challenges to address the issues posed by the growth of private sector education.
Introduction
02
I-
S
A
P
S
P
u
b
lic
a
ti
o
n
s
deliver quality education to all children. Some also argue that it is unwise to rely on market-based solutions for massive education while others believe that regulation and public-private partnerships can be effective strategies to spot and rectify the market failures.
The milieu outlined above indicates that private education has become a significant phenomenon in Pakistan and yet little is known about key dynamics of this phenomenon. Keeping this in view, this study examines the state and growth of private education in the country between 1999-2000 and 2007-08. Some data covers the period up to 2010. The analysis focuses on issues and challenges that emanate from its size and growth, diversity in the private provision of education, financing, quality of teaching and learning, public-private partnerships and regulation. The purpose of the study is to identify some areas which require further research and to highlight important existing and emerging issues in the private education which call for an informed debate and policy response.
The evidence presented in different sections of the study is based on desk-based research which was undertaken by Institute for Social and Policy Sciences (I-SAPS) for Pakistan Education Task Force (PETF) with the support of Department for International Development (DFID) UK. Preliminary findings and inferences from the research were shared with PETF in March 2010. This study presents a fuller analysis of the research with a view to facilitate an informed policy debate, suggest recommendations and implement strategies for living up to the challenges associated with the growth of private education.
At this stage, it is pertinent to point out that the analysis presented in the study draws on the existing statistical data and research studies. Description of the expansion in number of institutions, enrollment and teachers is made by combining data from the Census of Private Educational Institutions 1999-2000, National Education Census 2005 and published data from National Education Management Information System (NEMIS) for 2006-07 and 2007-08. The reader is cautioned that these two sets of databases (censuses and NEMIS reports) are not strictly comparable due to some differences in scope and methodology. For example, the census conducted in 2000 does not cover madrassahs because they were excluded from the definition of private schools but subsequently they were covered in 2005 census. Moreover, the data of private education in NEMIS reports is based on estimates derived from the past trends, contrary to the public sector data which is based on annual census. While these differences do not allow an apple-to-apple comparison, there is no other database on which one could rely for drawing a national-level holistic scenario over a longer period. Despite the differences in their scope and methodology, they provide fairly reliable estimates of growth in institutions, teachers and enrolment. However, the reader has to keep in mind these differences while interpreting the data.
In addition to the private schools' censuses and NEMIS reports, research studies dealing with different aspects of private education in Pakistan and other regions were intensively consulted. Key arguments and findings from the studies have been used to supplement the analysis.
03
I-S
A
P
S
P
u
b
lic
a
ti
o
n
s
The study is organized into six sections. The first section describes the expansion of private education in terms of changes in number of institutions, teachers and enrolment between 1999-2000 and 2007-08 and draws key inferences. The second section argues that private sector education is not a homogenous category. It sheds light on different facets of diversity which characterize the private education marketplace in Pakistan. The third section deals with financing of private education. It presents evidence on trends and patterns in government's financing of private education and out-of-pocket expenditure. The fourth section examines the issues concerned with quality of teaching and learning in private schools. The fifth section discusses public-private partnerships as the instruments to promote and support private sector participation in education. The sixth section reviews arguments for and against the regulation of private schools along with a case study of regulation regime for private schools in Islamabad Capital Territory (ICT). The study concludes with a discussion of the policy challenges to address the issues posed by the growth of private sector education.
02
I-
S
A
P
S
P
u
b
lic
a
ti
o
n
s
deliver quality education to all children. Some also argue that it is unwise to rely on market-based solutions for massive education while others believe that regulation and public-private partnerships can be effective strategies to spot and rectify the market failures.
The milieu outlined above indicates that private education has become a significant phenomenon in Pakistan and yet little is known about key dynamics of this phenomenon. Keeping this in view, this study examines the state and growth of private education in the country between 1999-2000 and 2007-08. Some data covers the period up to 2010. The analysis focuses on issues and challenges that emanate from its size and growth, diversity in the private provision of education, financing, quality of teaching and learning, public-private partnerships and regulation. The purpose of the study is to identify some areas which require further research and to highlight important existing and emerging issues in the private education which call for an informed debate and policy response.
The evidence presented in different sections of the study is based on desk-based research which was undertaken by Institute for Social and Policy Sciences (I-SAPS) for Pakistan Education Task Force (PETF) with the support of Department for International Development (DFID) UK. Preliminary findings and inferences from the research were shared with PETF in March 2010. This study presents a fuller analysis of the research with a view to facilitate an informed policy debate, suggest recommendations and implement strategies for living up to the challenges associated with the growth of private education.
At this stage, it is pertinent to point out that the analysis presented in the study draws on the existing statistical data and research studies. Description of the expansion in number of institutions, enrollment and teachers is made by combining data from the Census of Private Educational Institutions 1999-2000, National Education Census 2005 and published data from National Education Management Information System (NEMIS) for 2006-07 and 2007-08. The reader is cautioned that these two sets of databases (censuses and NEMIS reports) are not strictly comparable due to some differences in scope and methodology. For example, the census conducted in 2000 does not cover madrassahs because they were excluded from the definition of private schools but subsequently they were covered in 2005 census. Moreover, the data of private education in NEMIS reports is based on estimates derived from the past trends, contrary to the public sector data which is based on annual census. While these differences do not allow an apple-to-apple comparison, there is no other database on which one could rely for drawing a national-level holistic scenario over a longer period. Despite the differences in their scope and methodology, they provide fairly reliable estimates of growth in institutions, teachers and enrolment. However, the reader has to keep in mind these differences while interpreting the data.
In addition to the private schools' censuses and NEMIS reports, research studies dealing with different aspects of private education in Pakistan and other regions were intensively consulted. Key arguments and findings from the studies have been used to supplement the analysis.
S
E
C
T
IO
N
The Rise of Private Education
Size and Growth
01
I-S
A
P
S
P
u
b
lic
a
ti
o
n
s
Historically, private provision of education is not new in Pakistan. At the time of its inception in 1947, the state promised universal primary education as well as sought 'other actors' to participate in realizing it. It justified the need for participation of the
1
extra-state actors in view of lack of resources . Since then, the private schools have existed in the form of madrassahs, Christian missionary schools as well as schools run by business entrepreneurs and non-governmental organizations. The growth of private schools received a serious setback due to government's drive for nationalization in 1972. Their role was revived after denationalization in late 1980s but little is known about the dynamics of revival and pre- and post-denationalization differences due to absence of data. Minimal research was carried out on the role of the private sector in education after denationalization. This deficiency was partly due to lack of a population census in Pakistan between 1981 and 1998.
Until the late 1990s, it was believed that the private schools were largely serving the elite segments of Pakistani population. After denationalization, growth of private schools was no more an urban elite phenomenon. The schools started spreading in rural areas rapidly and were affordable to middle and even low income groups. Parents could infer quality variation between schools from the fees which
2
responded in predictable ways to measured school inputs . Some view the rise of private schooling as complementary to the governmental efforts for achieving “Education for All”, others consider it as an inevitable change associated with the processes leading to the emergence of marketplaces and shrinking role of the state in the provision of public good.
Over the past few years, data has shown that private provision of education has become a significant phenomenon in Pakistan both in urban as well as rural areas. This is evident from the growing share of private sector in number of educational institutions, national workforce of teachers and enrolment especially
The Rise of Private Education
Size and Growth
1
Ministry of Education (1947), Report of the National Education Conference, Karachi.
2
Andrabi, Tahir, Das J and Khwaja, The Rise of Private Schooling in Pakistan, Catering to the Urban Elite or Educating the Rural Poor? Working paper, Harvard University, 2002, pp. 4-9
03
I-S
A
P
S
P
u
b
lic
a
ti
o
n
s
institutions increased by 69%, as compared to mere 8% increase in government institutions i.e. more than 8 times faster than the public sector (Table 1.1).
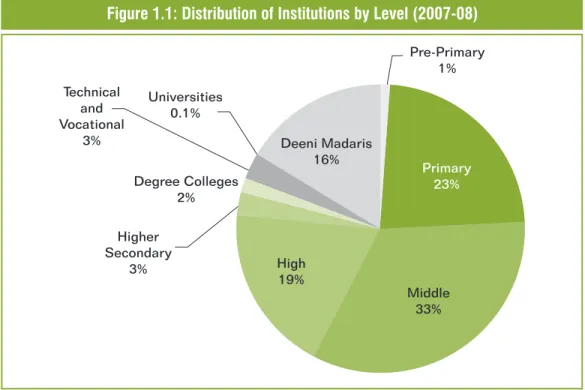
By level of education, the number of private education institutions is the highest at the middle level followed by primary, high and Deeni Madaris. Out of total private educational institutions in 2007-08, the percentage of institutions at these four levels was 33%, 23%, 19% and 16% respectively. Although private provision of higher education and technical and vocational education is expanding fast, the number of such institutions is small in proportional terms (Figure 1.1).
In terms of the distribution by gender, 95% of private educational institutions were mixed in 1999-2000. Analysis of statistical data indicates a significant trend in the growth of single-sex private educational institutions, as the percentage of mixed institutions has decreased rapidly since 1999-2000. This becomes evident when growth of boys, girls and mixed schools is considered. Between 1999-2000 and 2005, private educational institutions for boys increased by 200% and for girls by 237%, as compared to mixed educational institutions which grew by mere 59% during this period. Even if the change is measured over a relatively longer period between 1999-2000 and 2007-08, the same trend continues. Moreover, single-sex schools for girls have grown faster than both boys and mixed private educational institutions (Figure 1.2).
It is commonly believed that parents in rural areas prefer to educate their children, especially girls, in single-sex schools. This partly explains the faster growth of single-sex private schools, given that the number of private educational institutions has increased manifold in rural areas between 1999-2000 and 2007-08. Primary schools increased by 25%, middle schools by 134%, and high schools by
Primary 23% Deeni Madaris 16% Pre-Primary 1% Universities 0.1% Technical and Vocational 3% Degree Colleges 2% Higher Secondary 3% High 19% Middle 33%
Figure 1.1: Distribution of Institutions by Level (2007-08)
Source: I-SAPS' calculations from the NEMIS report for 2007-08
The Rise of Private Education
Size and Growth
01
The Rise of Private Education
Size and Growth
01
02
since 2000. This year is important in the sense that international community began to exert great pressure on developing countries for achieving Millennium Development Goals (MDGs). This pressure was one of the most important forces which moved the Pakistani government to accelerate its efforts for achieving universal primary education and as a result it supported the emergence of private sector education in a liberal policy framework.
This section examines the growth and size of the private sector education in comparison with public sector between 1999-2000 and 2007-08 in terms of three indicators: educational institutions, teachers, and enrolment. The section highlights some of the main issues associated with the private sector's growth and size. The analysis is based on statistical data from Federal Bureau of Statistics' Census of Private Schools 1999-2000, Ministry of Education's National Education Census 2005 and Pakistan Education Statistics for 2000 and 2007-08. A detailed note on sources of data and their comparability has already been given in the introduction.
As far as the number of institutions is concerned, 30% of all educational institutions in Pakistan were private in 2007-08. This size has grown considerably since 1999-2000 when the share of private institutions was mere 19%. Comparative to the public sector, the percentage share of private sector in all educational institutions is very high at middle level (61%) and high level (59%). At the primary level, public sector is still dominant provider of education as 89% of all educational institutions are owned by the government. An important trend evident from the data is that private institutions are expanding at a much faster rate than those in the public sector. Between 1999-2000 and 2007-08, the number of private educational
I-S
A
P
S
P
u
b
lic
a
ti
o
n
s
S.No.Table 1.1: Number of Educational Institutions: Public versus Private
Level Primary Middle High Total (1-3) Total* Type 1999-2000 2005 2007-08 % of Total in 2007-08 Change since 2000 (%) 1 2 3 4 5 Private Public Total Private Public Total Private Public Total Private Public Total Private Public Total 14,748 131,779 146,527 12,550 12,085 24,635 5,940 8,509 14,449 33,238 152,373 185,611 35,889 153,062 188,951 16,911 119,848 136,759 24,115 14,334 38,449 13,484 9,471 22,955 54,510 143,653 198,163 70,365 147,027 217,392 17,250 139,342 156,592 24,847 15,982 40,829 14,053 9,911 23,964 56,150 165,235 221,385 73,529 168,659 242,188 11% 89% 100% 61% 39% 100% 59% 41% 100% 25% 75% 100% 30% 70% 100% 17% 6% 7% 98% 32% 66% 137% 17% 66% 69% 8% 19% 105% 10% 28%
Note: Total* (5) includes educational institutions at all levels i.e. Pre-Primary, Higher Secondary, Degree level, technical and vocational and Deeni Madaris. However, the 1999-2000 data in Table 1.1 does not cover Pre-Primary, Deeni Madaris and public sector degree level and technical and vocational institutions.
03
I-S
A
P
S
P
u
b
lic
a
ti
o
n
s
institutions increased by 69%, as compared to mere 8% increase in government institutions i.e. more than 8 times faster than the public sector (Table 1.1).
By level of education, the number of private education institutions is the highest at the middle level followed by primary, high and Deeni Madaris. Out of total private educational institutions in 2007-08, the percentage of institutions at these four levels was 33%, 23%, 19% and 16% respectively. Although private provision of higher education and technical and vocational education is expanding fast, the number of such institutions is small in proportional terms (Figure 1.1).
In terms of the distribution by gender, 95% of private educational institutions were mixed in 1999-2000. Analysis of statistical data indicates a significant trend in the growth of single-sex private educational institutions, as the percentage of mixed institutions has decreased rapidly since 1999-2000. This becomes evident when growth of boys, girls and mixed schools is considered. Between 1999-2000 and 2005, private educational institutions for boys increased by 200% and for girls by 237%, as compared to mixed educational institutions which grew by mere 59% during this period. Even if the change is measured over a relatively longer period between 1999-2000 and 2007-08, the same trend continues. Moreover, single-sex schools for girls have grown faster than both boys and mixed private educational institutions (Figure 1.2).
It is commonly believed that parents in rural areas prefer to educate their children, especially girls, in single-sex schools. This partly explains the faster growth of single-sex private schools, given that the number of private educational institutions has increased manifold in rural areas between 1999-2000 and 2007-08. Primary schools increased by 25%, middle schools by 134%, and high schools by
Primary 23% Deeni Madaris 16% Pre-Primary 1% Universities 0.1% Technical and Vocational 3% Degree Colleges 2% Higher Secondary 3% High 19% Middle 33%
Figure 1.1: Distribution of Institutions by Level (2007-08)
Source: I-SAPS' calculations from the NEMIS report for 2007-08
02
since 2000. This year is important in the sense that international community began to exert great pressure on developing countries for achieving Millennium Development Goals (MDGs). This pressure was one of the most important forces which moved the Pakistani government to accelerate its efforts for achieving universal primary education and as a result it supported the emergence of private sector education in a liberal policy framework.
This section examines the growth and size of the private sector education in comparison with public sector between 1999-2000 and 2007-08 in terms of three indicators: educational institutions, teachers, and enrolment. The section highlights some of the main issues associated with the private sector's growth and size. The analysis is based on statistical data from Federal Bureau of Statistics' Census of Private Schools 1999-2000, Ministry of Education's National Education Census 2005 and Pakistan Education Statistics for 2000 and 2007-08. A detailed note on sources of data and their comparability has already been given in the introduction.
As far as the number of institutions is concerned, 30% of all educational institutions in Pakistan were private in 2007-08. This size has grown considerably since 1999-2000 when the share of private institutions was mere 19%. Comparative to the public sector, the percentage share of private sector in all educational institutions is very high at middle level (61%) and high level (59%). At the primary level, public sector is still dominant provider of education as 89% of all educational institutions are owned by the government. An important trend evident from the data is that private institutions are expanding at a much faster rate than those in the public sector. Between 1999-2000 and 2007-08, the number of private educational
I-S
A
P
S
P
u
b
lic
a
ti
o
n
s
S.No.Table 1.1: Number of Educational Institutions: Public versus Private
Level Primary Middle High Total (1-3) Total* Type 1999-2000 2005 2007-08 % of Total in 2007-08 Change since 2000 (%) 1 2 3 4 5 Private Public Total Private Public Total Private Public Total Private Public Total Private Public Total 14,748 131,779 146,527 12,550 12,085 24,635 5,940 8,509 14,449 33,238 152,373 185,611 35,889 153,062 188,951 16,911 119,848 136,759 24,115 14,334 38,449 13,484 9,471 22,955 54,510 143,653 198,163 70,365 147,027 217,392 17,250 139,342 156,592 24,847 15,982 40,829 14,053 9,911 23,964 56,150 165,235 221,385 73,529 168,659 242,188 11% 89% 100% 61% 39% 100% 59% 41% 100% 25% 75% 100% 30% 70% 100% 17% 6% 7% 98% 32% 66% 137% 17% 66% 69% 8% 19% 105% 10% 28%
Note: Total* (5) includes educational institutions at all levels i.e. Pre-Primary, Higher Secondary, Degree level, technical and vocational and Deeni Madaris. However, the 1999-2000 data in Table 1.1 does not cover Pre-Primary, Deeni Madaris and public sector degree level and technical and vocational institutions.
I-S
A
P
S
P
u
b
lic
a
ti
o
n
s
04
209% in rural areas. In comparison, the number of primary schools in urban areas increased by 10%, middle schools 73% and high schools by 113%. This shows that at all the three levels, growth of private schools has been much higher (nearly double) in rural areas than urban areas. Even in absolute terms, the number of primary schools in rural areas has exceeded those in the urban areas (rural 8,920; urban 8,330) in 2007-08 (Table A3 in Annex I). This pattern underlines the response of private sector to increasing interest of parents in rural areas to educate their children in private schools.
Figure 1.2: Growth of Single-Sex and Mixed Private Educational Institutions (1999-2000 to 2007-08)
Source: Compiled by I-SAPS from Census of Private Educational Institutions 1999-2000, National Education Census 2005 and NEMIS reports for 2000 and 2007-08
300% 250% 200% 150% 100% 50% 0% 200% 237% 59% 210% 254% 64% Boys Girls Mixed 1999-2000 to 2005 11999-2000 to 2007-08
05
I-S
A
P
S
P
u
b
lic
a
ti
o
n
s
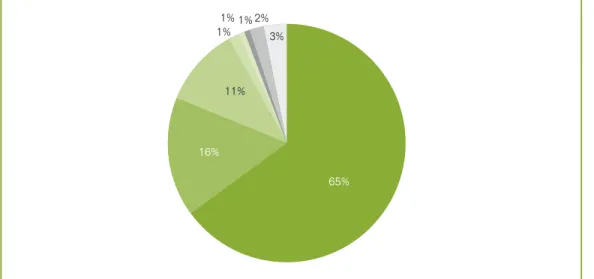
In terms of geographical spread, the largest percentage of all private educational institutions is found in the Punjab (65%) followed by Sindh (16%), Khyber Pakhtunkhwa (KPK) (11%), Azad Jammu and Kashmir (3%), Gilgit-Baltistan (2%) and Balochistan, Islamabad Capital Territory (ICT) and Federally Administered Tribal Areas (FATA) (1% each) (Figure 1.4). If combined growth of primary, middle and high schools is considered between 1999-2000 and 2007-08, Balochistan province is at the top where the private primary, middle and high schools increased by 90% followed by ICT (76%), Punjab (71%), Sindh (66%), KPK (64%) and FATA (33%). The data for comparison of growth rates in Gilgit-Baltistan and AJK is not available for 1999-2000.
Overall, three in every ten educational institutions in Pakistan are private. However, the public-private mix varies in each region. ICT is an outlier as more than half of its total educational institutions are private. In Gilgit-Baltistan, the percentage of private institutions is also very high and stands at 41%. In Balochistan and FATA, private sector has not been able to emerge as a key provider of education as mere 7% educational institutions were private in 2007-08. The percentage shares of public and private sector educational institutions in 2007-08 are shown in Figure 1.5.
The state of teachers in private educational institutions is considerably large due to sheer size of the sector. In 1999-2000, the total number of teachers in private educational institutions was 0.3 million. By 2007-08, the workforce of teachers was doubled (Table 1.2). Out of total 1.4 million teachers in Pakistan, 44% were working in private educational institutions in 2007-08. In private educational institutions, the number of female teachers is twice the number of male teachers. The growth in their number between 1999-2000 and 2007-08 is commensurate with this pattern in primary, middle and high schools. However, the growth in number of male teachers Figure 1.3: Growth of Private Educational Institutions by Location (1999-2000 to
2007-08)
Source: Compiled by I-SAPS from Census of Private Educational Institutions 1999-2000, National Education Census 2005 and NEMIS reports for 2000 and 2007-08
Urban Rural Urban Rural 2 0 0 7 -0 8 1 9 9 9 -2 0 0 0 2,000 4,000 6,000 8,000 10,000 12,000 14,000 0 High Middle Primary
Figure 1.4: Distribution of Private Educational Institutions by Region (2007-08)
Source: Compiled by I-SAPS from the NEMIS report for 2007-08
Punjab Sindh KPK Balochistan ICT FATA Gilgit-Baltistan AJK
1% 1% 1% 2% 3% 65% 16% 11%
The Rise of Private Education
Size and Growth
01
The Rise of Private Education
Size and Growth
I-S
A
P
S
P
u
b
lic
a
ti
o
n
s
04
209% in rural areas. In comparison, the number of primary schools in urban areas increased by 10%, middle schools 73% and high schools by 113%. This shows that at all the three levels, growth of private schools has been much higher (nearly double) in rural areas than urban areas. Even in absolute terms, the number of primary schools in rural areas has exceeded those in the urban areas (rural 8,920; urban 8,330) in 2007-08 (Table A3 in Annex I). This pattern underlines the response of private sector to increasing interest of parents in rural areas to educate their children in private schools.
Figure 1.2: Growth of Single-Sex and Mixed Private Educational Institutions (1999-2000 to 2007-08)
Source: Compiled by I-SAPS from Census of Private Educational Institutions 1999-2000, National Education Census 2005 and NEMIS reports for 2000 and 2007-08
300% 250% 200% 150% 100% 50% 0% 200% 237% 59% 210% 254% 64% Boys Girls Mixed 1999-2000 to 2005 11999-2000 to 2007-08
05
I-S
A
P
S
P
u
b
lic
a
ti
o
n
s
In terms of geographical spread, the largest percentage of all private educational institutions is found in the Punjab (65%) followed by Sindh (16%), Khyber Pakhtunkhwa (KPK) (11%), Azad Jammu and Kashmir (3%), Gilgit-Baltistan (2%) and Balochistan, Islamabad Capital Territory (ICT) and Federally Administered Tribal Areas (FATA) (1% each) (Figure 1.4). If combined growth of primary, middle and high schools is considered between 1999-2000 and 2007-08, Balochistan province is at the top where the private primary, middle and high schools increased by 90% followed by ICT (76%), Punjab (71%), Sindh (66%), KPK (64%) and FATA (33%). The data for comparison of growth rates in Gilgit-Baltistan and AJK is not available for 1999-2000.
Overall, three in every ten educational institutions in Pakistan are private. However, the public-private mix varies in each region. ICT is an outlier as more than half of its total educational institutions are private. In Gilgit-Baltistan, the percentage of private institutions is also very high and stands at 41%. In Balochistan and FATA, private sector has not been able to emerge as a key provider of education as mere 7% educational institutions were private in 2007-08. The percentage shares of public and private sector educational institutions in 2007-08 are shown in Figure 1.5.
The state of teachers in private educational institutions is considerably large due to sheer size of the sector. In 1999-2000, the total number of teachers in private educational institutions was 0.3 million. By 2007-08, the workforce of teachers was doubled (Table 1.2). Out of total 1.4 million teachers in Pakistan, 44% were working in private educational institutions in 2007-08. In private educational institutions, the number of female teachers is twice the number of male teachers. The growth in their number between 1999-2000 and 2007-08 is commensurate with this pattern in primary, middle and high schools. However, the growth in number of male teachers Figure 1.3: Growth of Private Educational Institutions by Location (1999-2000 to
2007-08)
Source: Compiled by I-SAPS from Census of Private Educational Institutions 1999-2000, National Education Census 2005 and NEMIS reports for 2000 and 2007-08
Urban Rural Urban Rural 2 0 0 7 -0 8 1 9 9 9 -2 0 0 0 2,000 4,000 6,000 8,000 10,000 12,000 14,000 0 High Middle Primary
Figure 1.4: Distribution of Private Educational Institutions by Region (2007-08)
Source: Compiled by I-SAPS from the NEMIS report for 2007-08
Punjab Sindh KPK Balochistan ICT FATA Gilgit-Baltistan AJK
1% 1% 1% 2% 3% 65% 16% 11%
07
I-S
A
P
S
P
u
b
lic
a
ti
o
n
s
enrolment accounted for 34% of total enrolment in educational institutions in 2007-08. This means that one in every three children enrolled in educational institutions was in a private institution (Table 1.3). This proportion is much higher for technical & vocational education and Deeni Madaris, as private sector's share in enrolment at these two stages was 57% and 97% respectively in 2007-08 (Table 5A in Annex I). In terms of growth, data reveals two important findings. First, the increase in overall enrolment has been the lowest at the primary stage (1%) between 1999-2000 and 2007-08. Indeed, public sector enrolment at the primary stage has declined by 2.6% during this period. At middle and high stages, enrolment increased by 35% and 50% respectively. This pattern refers to significant improvement in transition of children from primary to middle and high schools. Secondly, percentage increase in enrolment in private sector institutions has been much higher than the public sector. Between 1999-2000 and 2007-08, public sector witnessed an increase of mere 4% in combined enrolment for primary, middle and high stages, as compared to 29% increase in the private sector enrolment. Thus, enrolment in private sector has expanded 7 times faster than that of the public sector (Table 1.3).
The rapid growth of private schooling entails many implications for the public sector. One piece of evidence comes from changes in the share of private schools in total enrolment between 1999-2000 and 2007-08. As Figure 1.6 shows, public sector schools witnessed a decline of 2% in enrolment at primary, 19% at middle and 10% at high stage. Obviously, this decline came from increase in enrolment in private schools.
06
I-
S
A
P
S
P
u
b
lic
a
ti
o
n
s
was considerably higher than females for private higher secondary and technical and vocational institutions (Table A4 in Annex I).
Like the number of institutions and teachers, private education marks a significant phenomenon in terms of enrolment at various stages. Overall, private sector
S.No.
Table 1.2: Number of Teachers in Private Schools
Level Primary Middle High Total (1-3) Total* Sex 1999-2000 2005 2007-08 % of Total in 2007-08 Change since 2000 (%) 1 2 3 4 5 Male Female Total Male Female Total Male Female Total Male Female Total Male Female Total 17,020 58,904 75,924 28,752 77,629 106,381 27,150 67,459 94,609 72,922 203,992 276,914 81,264 213,638 294,902 18,846 67,605 86,451 48,583 145,661 194,244 54,420 139,852 194,272 121,849 353,118 474,967 182,912 390,661 573,573 19,338 68,857 88,195 49,888 149,371 199,259 55,021 144,072 199,093 124,247 362,300 486,547 191,854 405,764 597,618 22% 78% 100% 25% 75% 100% 28% 72% 100% 26% 74% 100% 32% 68% 100% 14% 17% 16% 74% 92% 87% 103% 114% 110% 70% 78% 76% 136% 90% 103%
Note: Total* (5) includes teachers of educational institutions at all levels i.e. Pre-Primary, Higher Secondary, Degree level, technical and vocational and Deeni Madaris. However, the 1999-2000 data in Table 1.2 does not cover teachers of Pre-Primary and Deeni Madaris.
Source: Compiled by I-SAPS from Census of Private Educational Institutions 1999-2000, National Education Census 2005 and NEMIS reports for 2000 and 2007-08
S.No.
Table 1.3: Enrolment in Schools: Public versus Private
Level Primary Middle High Total (1-4) Total* Type 1999-2000 2005 2007-08 % of Total in 2007-08 Change since 2000 (%) 1 2 3 4 5 Private Public Total Private Public Total Private Public Total Private Public Total Private Public Total 4,568,890 12,480,466 17,049,356 885,146 3,073,938 3,959,084 305,798 1,311,107 1,616,905 5,759,834 16,865,511 22,625,345 5,952,224 16,952,185 22,904,409 5,120,963 10,982,715 16,103,678 1,675,556 3,325,884 5,001,440 680,383 1,480,549 2,160,932 7,476,902 15,789,148 23,266,050 11,775,558 20,782,205 32,557,763 5,072,796 12,155,478 17,228,274 1,668,543 3,694,175 5,362,718 702,946 1,723,309 2,426,255 7,444,285 17,572,962 25,017,247 12,140,458 23,411,173 35,551,631 29% 71% 100% 31% 69% 100% 29% 71% 100% 30% 70% 100% 34% 66% 100% 11% -2.6% 1% 89% 20% 35% 130% 31% 50% 29% 4% 11% 104% 38% 55%
Note: Total* (5) includes enrolment at all stages i.e. Pre-Primary, Higher Secondary, Degree level, technical and vocational and Deeni Madaris. However, the 1999-2000 data in Table 1.3 does not cover enrolment at the stages of Pre-Primary, Deeni Madaris and public sector enrolment in degree level and technical and vocational institutions.
Source: Compiled by I-SAPS from Census of Private Educational Institutions 1999-2000, National Education Census 2005 and NEMIS reports for 2000 and 2007-08
Figure 1.5: Educational Institutions by Region: Public-Private Mix (2007-08)
Note: The above percentages do not include universities, Deeni Madaris and technical institutions. Source: Compiled by I-SAPS from the NEMIS report for 2007-08
Pakistan Punjab Sindh KPK Balochistan AJK FATA Gilgit-Baltistan ICT 74% 62% 84% 81% 93% 76% 93% 59% 46% 26% 38% 16% 19% 7% 24% 7% 41% 54% Public Private 0% 20% 40% 60% 80% 100% 120%
The Rise of Private Education
Size and Growth
01
The Rise of Private Education
Size and Growth
07
I-S
A
P
S
P
u
b
lic
a
ti
o
n
s
enrolment accounted for 34% of total enrolment in educational institutions in 2007-08. This means that one in every three children enrolled in educational institutions was in a private institution (Table 1.3). This proportion is much higher for technical & vocational education and Deeni Madaris, as private sector's share in enrolment at these two stages was 57% and 97% respectively in 2007-08 (Table 5A in Annex I). In terms of growth, data reveals two important findings. First, the increase in overall enrolment has been the lowest at the primary stage (1%) between 1999-2000 and 2007-08. Indeed, public sector enrolment at the primary stage has declined by 2.6% during this period. At middle and high stages, enrolment increased by 35% and 50% respectively. This pattern refers to significant improvement in transition of children from primary to middle and high schools. Secondly, percentage increase in enrolment in private sector institutions has been much higher than the public sector. Between 1999-2000 and 2007-08, public sector witnessed an increase of mere 4% in combined enrolment for primary, middle and high stages, as compared to 29% increase in the private sector enrolment. Thus, enrolment in private sector has expanded 7 times faster than that of the public sector (Table 1.3).
The rapid growth of private schooling entails many implications for the public sector. One piece of evidence comes from changes in the share of private schools in total enrolment between 1999-2000 and 2007-08. As Figure 1.6 shows, public sector schools witnessed a decline of 2% in enrolment at primary, 19% at middle and 10% at high stage. Obviously, this decline came from increase in enrolment in private schools.
06
I-
S
A
P
S
P
u
b
lic
a
ti
o
n
s
was considerably higher than females for private higher secondary and technical and vocational institutions (Table A4 in Annex I).
Like the number of institutions and teachers, private education marks a significant phenomenon in terms of enrolment at various stages. Overall, private sector
S.No.
Table 1.2: Number of Teachers in Private Schools
Level Primary Middle High Total (1-3) Total* Sex 1999-2000 2005 2007-08 % of Total in 2007-08 Change since 2000 (%) 1 2 3 4 5 Male Female Total Male Female Total Male Female Total Male Female Total Male Female Total 17,020 58,904 75,924 28,752 77,629 106,381 27,150 67,459 94,609 72,922 203,992 276,914 81,264 213,638 294,902 18,846 67,605 86,451 48,583 145,661 194,244 54,420 139,852 194,272 121,849 353,118 474,967 182,912 390,661 573,573 19,338 68,857 88,195 49,888 149,371 199,259 55,021 144,072 199,093 124,247 362,300 486,547 191,854 405,764 597,618 22% 78% 100% 25% 75% 100% 28% 72% 100% 26% 74% 100% 32% 68% 100% 14% 17% 16% 74% 92% 87% 103% 114% 110% 70% 78% 76% 136% 90% 103%
Note: Total* (5) includes teachers of educational institutions at all levels i.e. Pre-Primary, Higher Secondary, Degree level, technical and vocational and Deeni Madaris. However, the 1999-2000 data in Table 1.2 does not cover teachers of Pre-Primary and Deeni Madaris.
Source: Compiled by I-SAPS from Census of Private Educational Institutions 1999-2000, National Education Census 2005 and NEMIS reports for 2000 and 2007-08
S.No.
Table 1.3: Enrolment in Schools: Public versus Private
Level Primary Middle High Total (1-4) Total* Type 1999-2000 2005 2007-08 % of Total in 2007-08 Change since 2000 (%) 1 2 3 4 5 Private Public Total Private Public Total Private Public Total Private Public Total Private Public Total 4,568,890 12,480,466 17,049,356 885,146 3,073,938 3,959,084 305,798 1,311,107 1,616,905 5,759,834 16,865,511 22,625,345 5,952,224 16,952,185 22,904,409 5,120,963 10,982,715 16,103,678 1,675,556 3,325,884 5,001,440 680,383 1,480,549 2,160,932 7,476,902 15,789,148 23,266,050 11,775,558 20,782,205 32,557,763 5,072,796 12,155,478 17,228,274 1,668,543 3,694,175 5,362,718 702,946 1,723,309 2,426,255 7,444,285 17,572,962 25,017,247 12,140,458 23,411,173 35,551,631 29% 71% 100% 31% 69% 100% 29% 71% 100% 30% 70% 100% 34% 66% 100% 11% -2.6% 1% 89% 20% 35% 130% 31% 50% 29% 4% 11% 104% 38% 55%
Note: Total* (5) includes enrolment at all stages i.e. Pre-Primary, Higher Secondary, Degree level, technical and vocational and Deeni Madaris. However, the 1999-2000 data in Table 1.3 does not cover enrolment at the stages of Pre-Primary, Deeni Madaris and public sector enrolment in degree level and technical and vocational institutions.
Source: Compiled by I-SAPS from Census of Private Educational Institutions 1999-2000, National Education Census 2005 and NEMIS reports for 2000 and 2007-08
Figure 1.5: Educational Institutions by Region: Public-Private Mix (2007-08)
Note: The above percentages do not include universities, Deeni Madaris and technical institutions. Source: Compiled by I-SAPS from the NEMIS report for 2007-08
Pakistan Punjab Sindh KPK Balochistan AJK FATA Gilgit-Baltistan ICT 74% 62% 84% 81% 93% 76% 93% 59% 46% 26% 38% 16% 19% 7% 24% 7% 41% 54% Public Private 0% 20% 40% 60% 80% 100% 120%
Figure 1.6: Growth of Enrolment in Public and Private Educational Institutions
Source: Compiled by I-SAPS from Census of Private Educational Institutions 1999-2000 and NEMIS reports for 2000 and 2007-08 100% 90% 80% 70% 60% 50% 40% 30% 20% 10% 0%
Private Public Private Public
2000 2007-8 Primary Middle High 27% 22% 19% 73% 88% 81% 29% 31% 29% 71% 69% 71%
09
I-S
A
P
S
P
u
b
lic
a
ti
o
n
s
primary, 54% middle, 53% high and 51% at higher secondary level. The enrolment of girls is higher than boys only at degree level (Class XIII-XIV) and stands at 64% compared with boys (36%) (Table A7 in Annex I). However, the growth trend shows that enrolment of girls in private sector institutions is growing at a faster rate than that of boy at primary, middle and high levels (Table 1.4).
The largest proportion of enrolment in private educational institutions was in urban areas and stood at 68% in 1999-2000. In rural areas, enrolment increased from 32% in 1999-2000 to 36% in 2005 but it has not further increased as a percentage of total private sector enrolment. While the number of private educational institutions has increased at a much faster rate in rural areas than in urban areas, corresponding change in enrolment has not been witnessed. This implies that most of the recently established rural private schools are smaller in size.
08
I-
S
A
P
S
P
u
b
lic
a
ti
o
n
s
Out of total enrolment in educational institutions in Pakistan, private sector accounted for 32% in 2007-08. This percentage is the highest in Gilgit-Baltistan (43%) followed by Punjab and AJK (35% each), Sindh and ICT (31% each), KPK (23%) and Balochistan (16%). The share of private sector in total enrolment is the lowest in FATA (14%) (Figure 1.7).
Overall, the number of boys in total enrolment of private educational institutions is higher up to higher secondary level. The difference is not as high as in the public sector. In 2007-08, boys accounted for 55% out of total private sector enrolment at
Pakistan Punjab Sindh KPK Balochistan AJK FATA Gilgit-Baltistan ICT 0% 20% 40% 60% 80% 100% 120% 68% 65% 69% 77% 84% 65% 86% 57% 69% 32% 35% 31% 23% 16% 35% 14% 43% 31%
Figure 1.7: Public-Private Mix in Enrolment by Region (2007-08)
Note: The above percentages do not include universities, Deeni Madaris and technical institutions. Source: Compiled by I-SAPS from the NEMIS report for 2007-08
Public Private
Level
Table 1.4: Growth of Enrolment in Private Schools by Gender
Primary
Middle
High
Source: Compiled by I-SAPS from Census of Private Educational Institutions 1999-2000, National Education Census 2005 and NEMIS reports for 2000 and 2007-08
Boys Girls 1999-2000 to 2005 8% 90% 121% 7% 88% 127% 17% 89% 124% 16% 89% 133% 1999-2000 to 2007-08 1999-2000 to 2005 1999-2000 to 2007-08
Figure 1.8: Enrolment in Private Educational Institutions by Location
Source: Compiled by I-SAPS from Census of Private Educational Institutions 1999-2000, National Education Census 2005 and NEMIS reports for 2000 and 2007-08
Rural Urban 36% 64% 36% 64% 32% 68% 2007-08 2005 1999-2000 0% 20% 40% 60% 80% 100% 120%
The Rise of Private Education
Size and Growth
01
The Rise of Private Education
Size and Growth
Figure 1.6: Growth of Enrolment in Public and Private Educational Institutions
Source: Compiled by I-SAPS from Census of Private Educational Institutions 1999-2000 and NEMIS reports for 2000 and 2007-08 100% 90% 80% 70% 60% 50% 40% 30% 20% 10% 0%
Private Public Private Public
2000 2007-8 Primary Middle High 27% 22% 19% 73% 88% 81% 29% 31% 29% 71% 69% 71%
09
I-S
A
P
S
P
u
b
lic
a
ti
o
n
s
primary, 54% middle, 53% high and 51% at higher secondary level. The enrolment of girls is higher than boys only at degree level (Class XIII-XIV) and stands at 64% compared with boys (36%) (Table A7 in Annex I). However, the growth trend shows that enrolment of girls in private sector institutions is growing at a faster rate than that of boy at primary, middle and high levels (Table 1.4).
The largest proportion of enrolment in private educational institutions was in urban areas and stood at 68% in 1999-2000. In rural areas, enrolment increased from 32% in 1999-2000 to 36% in 2005 but it has not further increased as a percentage of total private sector enrolment. While the number of private educational institutions has increased at a much faster rate in rural areas than in urban areas, corresponding change in enrolment has not been witnessed. This implies that most of the recently established rural private schools are smaller in size.
08
I-
S
A
P
S
P
u
b
lic
a
ti
o
n
s
Out of total enrolment in educational institutions in Pakistan, private sector accounted for 32% in 2007-08. This percentage is the highest in Gilgit-Baltistan (43%) followed by Punjab and AJK (35% each), Sindh and ICT (31% each), KPK (23%) and Balochistan (16%). The share of private sector in total enrolment is the lowest in FATA (14%) (Figure 1.7).
Overall, the number of boys in total enrolment of private educational institutions is higher up to higher secondary level. The difference is not as high as in the public sector. In 2007-08, boys accounted for 55% out of total private sector enrolment at
Pakistan Punjab Sindh KPK Balochistan AJK FATA Gilgit-Baltistan ICT 0% 20% 40% 60% 80% 100% 120% 68% 65% 69% 77% 84% 65% 86% 57% 69% 32% 35% 31% 23% 16% 35% 14% 43% 31%
Figure 1.7: Public-Private Mix in Enrolment by Region (2007-08)
Note: The above percentages do not include universities, Deeni Madaris and technical institutions. Source: Compiled by I-SAPS from the NEMIS report for 2007-08
Public Private
Level
Table 1.4: Growth of Enrolment in Private Schools by Gender
Primary
Middle
High
Source: Compiled by I-SAPS from Census of Private Educational Institutions 1999-2000, National Education Census 2005 and NEMIS reports for 2000 and 2007-08
Boys Girls 1999-2000 to 2005 8% 90% 121% 7% 88% 127% 17% 89% 124% 16% 89% 133% 1999-2000 to 2007-08 1999-2000 to 2005 1999-2000 to 2007-08
Figure 1.8: Enrolment in Private Educational Institutions by Location
Source: Compiled by I-SAPS from Census of Private Educational Institutions 1999-2000, National Education Census 2005 and NEMIS reports for 2000 and 2007-08
Rural Urban 36% 64% 36% 64% 32% 68% 2007-08 2005 1999-2000 0% 20% 40% 60% 80% 100% 120%
10
I-
S
A
P
S
P
u
b
lic
a
ti
o
n
s
The above analysis provides illuminating insights into the size and growth of private sector education between 1999-2000 and 2007-08. One of the revelations is the unprecedented pace at which this sector is growing vis-à-vis public sector. Between 1999-2000 and 2007-08, the number of private educational institutions increased 8 times faster than the public sector. This growth is much higher for single-sex schools than mixed schools and much higher in rural areas than urban areas. In addition, the rise of private schooling has significant impact on enrolment in government schools. Between 1999-2000 and 2007-08, public sector's percentage share of enrolment decreased by 2%, 19% and 10% at primary, middle and high levels respectively because the private sector was able to attract greater number of children. Another important trend is visible in the form of higher growth of girls' enrolment during this period which is likely to change the conventional ratio in which boys exceed girls in absolute numbers in private schools. These changes mark significant transformation in internal dynamics of the private education sector on one hand, and call for deeper analysis and informed debate on their implications for public education sector and Pakistan's overall education indicators, on the other.
The Rise of Private Education
Size and Growth
S
E
C
T
IO
N
13
I-S
A
P
S
P
u
b
lic
a
ti
o
n
s
The previous section has highlighted significant changes in the size of private sector engaged in delivery of education services vis-à-vis public sector and its rapid growth in terms of number of institutions, teachers and enrolment. These changes draw attention to some fundamental questions pertaining to financing of private education in Pakistan. How much does the private sector invest in education annually? How much do different types of private schools cost to children from households in low-, middle- and high income groups? How much profit do the private schools earn? How does the fee structure correlate with quality of education in private schools? To what extent does the cost of private provision of education vary in different regions and in urban and rural areas? The data available to answer these and similar questions related to financing of private education is insufficient and whatever is available is too much scattered. While the volume of research on public financing of education has grown considerably over the past few years, little attention has been paid to investigate the dynamics of education financing in the private sector.
The deficiency of data is evident from the fact that the most comprehensive set of financing statistics are available only in the Census of Private Educational Institutions 1999-2000. Since then, considerable changes might have occurred in trends and patterns of investment, receipts and expenditure of private educational institutions but it is difficult to analyze those changes because subsequent National Education Census 2005 and NEMIS have not captured information about private spending.
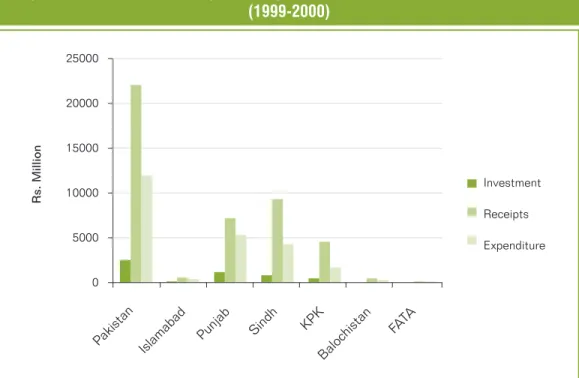
The Census 1999-2000 showed that annual investment by the private sector was Rs. 2.5 billion whereas the recurrent expenditure amounted to about Rs.12 billion in the year preceding the Census. The Gross Income of all types of private educational institutions was Rs. 22 billion showing an estimated return of Rs. 7.5 billion in 1999-2000. Region-wise expenditure and income data is shown in Figure 2.1. Overall, the major source of income was tuition fee (58%) and admission fee (28%). Donations contribute about 9% whereas 5% came from other
SECTION 02
1
Op. cit. ,Census of Private Educational Institutions in Pakistan 1999-2000, p. 18.
2
This proposition is supported by a note in the Census 1999-2000 (p. 6) about reluctance of the heads of some private educational institutions to provide information about expenditure, investment and income.
14
1
sources . These statistics shed light on considerable size of investment and expenditure by the private sector and the high rate of return. According to the Census 1999-2000, the private sector's net return was 52% of investment plus expenditure in the year covered in the Census. This figure might well be understated because an accurate picture could not have been captured in the Census due to
2
sensitivity of financial information . Despite this probability, this rate of return indicates that the incentive to invest in private education is high for profit-oriented entrepreneurs that would eventually lead to rapid expansion of the sector – a proposition which is already confirmed in the analysis presented in Section I of this study.
According to the Census 1999-2000, the largest chunk of private sector's expenditure went to teaching staff (57%). The other two major types of expenditure were salaries for non-teaching staff (11%) and rent of building (10%). These figures suggest that the percentage of combined expenditure on salaries and benefits of staff (68%) is considerably lower than the public sector for which this percentage is generally higher than 80 percent. Given that the quality of education is perceived superior to the public sector, the difference in percentage expenditure on staff calls for deeper research to investigate how the private sector manages to get better quality despite the fact that it spends less on its teaching staff compared with the public sector.
I-S
A
P
S
P
u
b
lic
a
ti
o
n
s
15
I-S
A
P
S
P
u
b
lic
a
ti
o
n
s
As far as the cost of private education is concerned, data on household annual expenditure per pupil is available in the Pakistan Social and Living Standards Measurement (PSLM) Survey. In 2007-08, overall household annual expenditure per pupil in a private educational institution was Rs. 6,130 which was 3.5 times higher than the expenditure of Rs. 1,756 incurred in public sector educational institutions. There are significant differences in expenditure at all levels. The household annual expenditure per pupil amounted to Rs. 4367 at primary level, Rs. 6,728 at middle level, Rs. 9,172 at secondary level, and Rs. 13,547 at higher education level - higher than public sector by 7.3 times at primary, 5.3 times at middle, 3.8 times at secondary and 1.5 times at higher education levels. These statistics indicate that the difference between costs of education in the private and public sectors is the highest at the primary level and lowest at the higher level, which is probably due to subsidies provided to the latter by the government. Overall, an urban household spends Rs. 2433 more than a rural household does per pupil in a private educational institution.
From the perspective of equity, it is important to note that disparity between rural and urban areas in proportional terms is higher for the public sector. An urban household spends 68% more than a rural household does for educating a child in a government educational institution whereas this percentage is 50% for private educational institutions. This difference indicates the prevalence of low-fee schools in rural areas to cater to the educational needs of the poor households which itself calls for deeper research to examine the issues related with quality and the value for money.
In addition to the expenditure incurred by the private institutions of education and households, government provides considerable funds in the form of grants-in-aid to the private sector. According to a study recently conducted by I-Figure 2.1: Investment, Receipts and Expenditure of Private Educational Institutions
(1999-2000)
Source: Compiled by I-SAPS from Census of Private Educational Institutions 1999-2000
25000 20000 15000 10000 5000 0 Investment Receipts Expenditure a an Pki st lm aad Isa b nab Pu j inh S d KP K Balo chist an A FAT R s . M il li o n
Figure 2.2: Distribution of Expenditure of Private Educational Institutions
Source: Compiled by I-SAPS from Census of Private Educational Institutions 1999-2000
Teching staff 57% Utilities 7% Non-teaching staff 11% Building rent 10% Repair and maintenance 4% Miscellaneous 11%
1
Op. cit. ,Census of Private Educational Institutions in Pakistan 1999-2000, p. 18.
2
This proposition is supported by a note in the Census 1999-2000 (p. 6) about reluctance of the heads of some private educational institutions to provide information about expenditure, investment and income.
14
1
sources . These statistics shed light on considerable size of investment and expenditure by the private sector and the high rate of return. According to the Census 1999-2000, the private sector's net return was 52% of investment plus expenditure in the year covered in the Census. This figure might well be understated because an accurate picture could not have been captured in the Census due to
2
sensitivity of financial information . Despite this probability, this rate of return indicates that the incentive to invest in private education is high for profit-oriented entrepreneurs that would eventually lead to rapid expansion of the sector – a proposition which is already confirmed in the analysis presented in Section I of this study.
According to the Census 1999-2000, the largest chunk of private sector's expenditure went to teaching staff (57%). The other two major types of expenditure were salaries for non-teaching staff (11%) and rent of building (10%). These figures suggest that the percentage of combined expenditure on salaries and benefits of staff (68%) is considerably lower than the public sector for which this percentage is generally higher than 80 percent. Given that the quality of education is perceived superior to the public sector, the difference in percentage expenditure on staff calls for deeper research to investigate how the private sector manages to get better quality despite the fact that it spends less on its teaching staff compared with the public sector.
I-S
A
P
S
P
u
b
lic
a
ti
o
n
s
Financing of Private Education
02
15
I-S
A
P
S
P
u
b
lic
a
ti
o
n
s
As far as the cost of private education is concerned, data on household annual expenditure per pupil is available in the Pakistan Social and Living Standards Measurement (PSLM) Survey. In 2007-08, overall household annual expenditure per pupil in a private educational institution was Rs. 6,130 which was 3.5 times higher than the expenditure of Rs. 1,756 incurred in public sector educational institutions. There are significant differences in expenditure at all levels. The household annual expenditure per pupil amounted to Rs. 4367 at primary level, Rs. 6,728 at middle level, Rs. 9,172 at secondary level, and Rs. 13,547 at higher education level - higher than public sector by 7.3 times at primary, 5.3 times at middle, 3.8 times at secondary and 1.5 times at higher education levels. These statistics indicate that the difference between costs of education in the private and public sectors is the highest at the primary level and lowest at the higher level, which is probably due to subsidies provided to the latter by the government. Overall, an urban household spends Rs. 2433 more than a rural household does per pupil in a private educational institution.
From the perspective of equity, it is important to note that disparity between rural and urban areas in proportional terms is higher for the public sector. An urban household spends 68% more than a rural household does for educating a child in a government educational institution whereas this percentage is 50% for private educational institutions. This difference indicates the prevalence of low-fee schools in rural areas to cater to the educational needs of the poor households which itself calls for deeper research to examine the issues related with quality and the value for money.
In addition to the expenditure incurred by the private institutions of education and households, government provides considerable funds in the form of grants-in-aid to the private sector. According to a study recently conducted by
I-Financing of Private Education
02
Figure 2.1: Investment, Receipts and Expenditure of Private Educational Institutions (1999-2000)
Source: Compiled by I-SAPS from Census of Private Educational Institutions 1999-2000
25000 20000 15000 10000 5000 0 Investment Receipts Expenditure a an Pki st Isla mab ad Punj ab Sind h KPK Bao chs n l i ta A FAT R s . M il li o n
Figure 2.2: Distribution of Expenditure of Private Educational Institutions
Source: Compiled by I-SAPS from Census of Private Educational Institutions 1999-2000
Teching staff 57% Utilities 7% Non-teaching staff 11% Building rent 10% Repair and maintenance 4% Miscellaneous 11%
I-S
A
P
S
P
u
b
lic
a
ti
o
n
s
16
SAPS, the total amount of grants-in-aid (excluding KPK) provided to the private sector amounted to Rs. 5.2 billion in 2009-10, up by 20% over 2007-08. In 2008-09, the amount of grants-in-aid fell due to cut worth Rs.1.2 billion by the government of Punjab. Major chunk of the grants-in-aid is spent on establishing public-private partnerships through federal and provincial education foundations.
6000.00 5000.00 4000.00 3000.00 2000.00 1000.00 0.00 Federal Punjab Sindh Balochistan Total 2007-08 2008-09 2009-10
Figure 2.3: Grants-in-Aid to Private Education Sector
Source: I-SAPS (2009). Public Financing of Education in Pakistan: Analysis of Federal and Provincial Budgets. Islamabad.
S
E
C
T
IO
N
Diversity of Private Education
I-S
A
P
S
P
u
b
lic
a
ti
o
n
s
16
SAPS, the total amount of grants-in-aid (excluding KPK) provided to the private sector amounted to Rs. 5.2 billion in 2009-10, up by 20% over 2007-08. In 2008-09, the amount of grants-in-aid fell due to cut worth Rs.1.2 billion by the government of Punjab. Major chunk of the grants-in-aid is spent on establishing public-private partnerships through federal and provincial education foundations.
Financing of Private Education
02
6000.00 5000.00 4000.00 3000.00 2000.00 1000.00 0.00 Federal Punjab Sindh Balochistan Total 2007-08 2008-09 2009-10Figure 2.3: Grants-in-Aid to Private Education Sector
Source: I-SAPS (2009). Public Financing of Education in Pakistan: Analysis of Federal and Provincial Budgets. Islamabad.
S
E
C
T
IO
N
Diversity of Private Education
19
I-S
A
P
S
P
u
b
lic
a
ti
o
n
s
Diversity of private education in Pakistan is a characteristic feature and has tremendous implications for policy research but this aspect remains largely under explored in the literature. As a result, private sector as the provider of education has g